Bay Watch: A Weekly Look into the Bay Area Economy
March 11, 2024
Due to major data revisions last week, the Bay Area’s total job count is nearly 100,000 lower than previously reported
Due to major revisions released by the Bureau of Labor Statistics last Friday, employment figures in the 9-county Bay Area are significantly lower than previously disclosed. Every year, the state’s Employment Development Department (EDD) conducts a “Benchmark,” an annual process in which employment estimates are revised. Each month we release a Bay Watch report on the labor market with the latest job numbers from the BLS and EDD. These are estimates based on a sampling of employers. However, every March, data are updated based on unemployment insurance (UI) tax reports that nearly all employers are required to file with state employment security agencies.
This March, revisions showed staggering changes to labor market trends: total payroll employment in the region is nearly 95,000 lower than previously reported, for a total of 4,073,900 jobs in January 2024. Previous estimates showed the Bay Area fully recouping pre-pandemic employment mid-2023, while new estimates show that the region never fully recovered, and is still down 1.1% (or 46,100 jobs).
While the new data includes revisions to pre-pandemic jobs, the biggest revisions occurred for 2023: the EDD originally estimated that 62,100 jobs were added to the Bay Area last year, when we actually added only 4,600 jobs, losing 27,600 jobs in the first three quarters of the year. However, these losses were followed by major gains in the final quarter and into 2024. Preliminary data released for January 2024 show the biggest month of job gains since early 2022.
Which industries are leading the region’s recovery?
The education & health sector, which includes most teachers, nurses, and other medical/care professionals saw the biggest increase in employment last year. This sector has also seen the biggest increase since before the pandemic. Despite taking the biggest hit since the start of the pandemic, the leisure and hospitality industry (restaurants, bars, hotels, arts, sports) added 16,700 jobs last year, however, still remains 36,300 jobs below pre-pandemic levels.
The biggest shift due to the revision is that losses in tech and office jobs appear to be larger than previously thought. The Information sector (which houses most of the tech sector) lost 23,100 jobs last year, for a net loss of 9,000 since February 2020. Previously, Information was thought to have lost only 300 jobs last year, for a net gain of 14,800 jobs. These figures previously defied many of the tech layoffs and bank failures that had characterized the first quarter of 2023, but now seem to more realistically match what was seen on the ground.
Bay Watch: A Weekly Look into the Bay Area Economy
February 21st, 2024
Bay Area transit agencies still struggling to recoup ridership
Transit ridership in the Bay Area was severely impacted by the COVID-19 pandemic and shift to remote work. While there have been several efforts underway to revitalize ridership across the region’s 27 different agencies, ridership has remained relatively stagnant over the last 12 months. Which begs the question: have we reached the peak of post-pandemic ridership? Is there any hope of getting more riders back on transit? In this week’s Bay Watch, we analyze ridership over the last year for the region’s key transit agencies to get a deeper understanding of the Bay Area’s transit ridership recovery.
CalTrain and BART ended the year with low levels of ridership, bringing in 28% and 38% of pre-pandemic weekday riders in December 2023, respectively. Contrastingly, toll tag data show 88% of pre-pandemic traffic volumes have returned on the Bay Bridge. Ridership on WETA’s 15 passenger ferries has fared better, having recovered 86% of pre-pandemic riders. Other transit agencies including VTA, AC Transit, MUNI, and Golden Gate Ferry have experienced at least a 50% ridership recovery as of December 2023.
Over the course of 2023, most agencies saw little change in average weekday ridership. The chart below shows average weekday ridership in absolute terms for WETA, Caltrain, VTA and BART. While some agencies saw minor surges in ridership, largely during the fall, most have remained relatively stagnant. BART averaged 166,422 riders per weekday during the final half of 2023, down 245,327 (or 61%) of riders from 2019’s average weekday ridership of 407,681. BART ridership peaked in October 2023 at 41% of its pre-pandemic ridership, while CalTrain’s recovery peaked in November 2022 at 30%.
How do things look by days of the week?
Unlike public transportation, car commuting across the Bay Area’s state-owned toll bridges has made a nearly full recovery. Our analysis reveals that that many people who are now commuting are choosing to drive alone or carpool, rather than take transit. In an analysis of morning commutes (6-10am) across the four most trafficked bridges in the region, the Bay Bridge demonstrated the highest midweek volumes (over 100% pre-pandemic traffic), while the San Mateo-Hayward bridge, which takes many commuters from the East Bay and beyond into tech campuses and startups scattered throughout the South Bay, has demonstrated some of the lowest midweek volumes given pre-pandemic levels, given the high share of remote work in the tech industry. Additionally, the most recent data provided by Kastle Systems 10-City Back to Work Barometer, indicates that the highest days for office occupancy are on Tuesdays, where the occupancy rate for the San Francisco and San Jose metro areas is 59% and 53%, respectively, which is lower than the 61% average of the top-10 peer metros.
These changes align closely with our return to work and transit survey, which we administer bi-monthly to roughly 200 employers throughout the region to inform transit agencies and policymakers. When asked what percentage they anticipate their workforce to come into the workplace six months from now, employers responded that around 50-60% will come in Tuesday through Thursday, while only 41% will come in Mondays, and 30% will come in Fridays.
Bay Watch: A Weekly Look into the Bay Area Economy
January 31st, 2024
Region ends the year strong, adding nearly 11,000 jobs in December
The 9-county Bay Area gained nearly 20,000 jobs in the last two months of 2023 — a reversal that defied the previous four months, when the region lost over 11,000 jobs. Over the course of 2023, the region added 43,100 jobs, for a net increase of 40,000 jobs since February 2020. The East Bay subregion (which includes Alameda and Contra Costa counties) led the region’s growth with 15,700 new jobs added in 2023, followed by the South Bay with 11,500 new jobs, the North Bay with 9,900 new jobs, and San Francisco & the Peninsula with 6,000 new jobs. The region’s job creation in December accounted for nearly half of all of the jobs created in California.
While these gains could signal a bounce back, it is too soon to draw any conclusions about the pace of future job creation. Many of the recently announced layoffs across the region have yet to be reflected in the Bureau of Labor Statistics’ labor market data, and layoffs may continue through the end of the year as companies continue to focus on profitability by reducing headcounts.
Which industries led the region's recovery in 2023?
The education & health sector, which includes most teachers, nurses, and other medical/care professionals saw the biggest increase in employment last year. This sector has also seen the biggest increase since before the pandemic. Despite taking the biggest hit since the start of the pandemic, the leisure and hospitality industry (restaurants, bars, hotels, arts, sports) added 35,300 jobs last year, however, still remains 9,000 below pre-pandemic job levels.
Last week's Bay Watch chronicled the possible end of the SF "exodus" - marking the first time in over a decade that San Francisco saw positive net domestic migration. This population growth, paired with a low unemployment rate and evaded recession may indicate stable and steady job growth into 2024.
Bay Watch: A Weekly Look into the Bay Area Economy
January 23, 2024
San Francisco population decline abating
The California Department of Finance released new county-level population data for 2023, and for the first time since 2012, San Francisco saw positive net domestic migration. The city’s housing affordability crisis, paired with a largely permanent hybrid/remote work has contributed to large swaths of young professionals leaving for more affordable cities or states. These data indicate a reversal in a trend that started long before the pandemic. Although foreign immigration levels remained strong in the 2010s, domestic migration turned increasingly negative as high housing prices forced many residents. As losses due to domestic out-migration accelerated during the pandemic, so too did lower births (when accounting for deaths), and near zero foreign immigration.
In the 9-county region, domestic out-migration has been a major problem and contributor to the region’s population loss. If it weren’t for positive foreign immigration and net births, the region would have lost 111,000 people in 2022. In 2023, the region’s net domestic losses nearly halved, while foreign immigration increased by over 7,000 residents, leading to an overall population gain of nearly 15,000 residents. Yet the continued 2023 decline is mostly the result of increasing out-migration with the largest outflow from Santa Clara and Alameda counties.
For San Francisco, rents continue to remain below pre-pandemic levels, an unusual trend among its peers. As domestic in-migration continues on an upward trajectory, it is likely that rental prices consequently rise. As San Francisco, and the region more broadly begins to recoup its pandemic-related population losses, the next needed steps involve lowering the cost of building new housing, changing zoning to allow more and less expensive housing to be built and, hopefully, state funding to offset some costs of housing.
Bay Watch: A Weekly Look into the Bay Area Economy
November 30th, 2023
All eyes were on San Francisco this month as the city hosted the 32nd annual Asia-Pacific Economic Cooperation (APEC) conference, the largest gathering of world leaders in the city since the 1945 UN Conference on International Organization. With leaders, dignitaries, and delegates converging for critical discussions on international trade and cooperation, the city’s leisure and hospitality industry experienced an unprecedented surge in demand, prompting a vital boost in revenue streams for hotels, restaurants, and bars across the city.
How did APEC impact the hotel economy?
During APEC week (November 12 to November 18, 2023), occupancy rates across San Francisco’s hotels increased by 8 percentage points when compared to the same week in 2022. RevPAR, or revenue per room, is the most comprehensive metric for measuring the health of the hotel economy. It incorporates both the average daily rate and occupancy rate, and illustrates the revenue generated per room regardless of if rooms are occupied. RevPAR in San Francisco increased by $52 year-over-year, for a 37% increase. Among the country’s largest hotel markets, this increase was bested only by Las Vegas.
With Park Hotels & Resorts, one of the nation's largest hotel chains, announcing earlier this year that they plan to pull out of two hotels in downtown San Francisco, as well as data from the American Hotel & Lodging Association (AHLA) showing that SF business travel revenue plunged nearly 69% from 2019 to 2022, this surge provided a much-needed boost and positive momentum to the city's struggling hotels. Around 32 hotels are backed by commercial market-based securities loans in San Francisco, and more than a dozen have been placed on a loan servicer’s watch list.
Bay Watch: A Weekly Look into the Bay Area Economy
November 20, 2023
The region saw marginal job growth in October after three months of losses, but layoffs loom
The 9-county Bay Area gained 3,000 jobs last month — a reversal that defied the previous three months, when the region lost over 10,000 jobs. The region’s losses were driven largely by core employment centers in the East Bay, Solano County, and Santa Clara county, losing a collective 1,800 jobs. However, a gain of 4,000 jobs in San Francisco and San Mateo counties – and another 1,100 in Napa and Sonoma counties kept the region’s growth net positive.
While these gains could signal a bounce back from the 7,500 jobs lost over the last four months, it is too soon to draw any conclusions about the pace of future job creation. Many of the recently announced layoffs across the region have yet to be reflected in the Bureau of Labor Statistics’ labor market data, and layoffs may continue through the end of the year as companies continue to focus on profitability by reducing headcounts.
Which industries are leading the region's recovery?
Despite taking the biggest hit since the start of the pandemic, jobs in leisure and hospitality (restaurants, bars, hotels, arts, sports) are close to pre-pandemic levels, while retail continues to suffer amid shuttered storefronts and hollowed out shopping centers and business districts. Education, Health, Information (which includes much of the tech industry), and manufacturing have all seen growth well beyond pre-pandemic levels.
Bay Watch: A Weekly Look into the Bay Area Economy
October 31, 2023
Happy Halloween from the Economic Institute! To celebrate, we tracked consumer spending of your favorite halloween goodies…
Halloween is back! After a couple years of Halloween withdrawal from the pandemic, total Halloween spending this year is projected to reach a record $12.2 billion, surpassing the previous year’s spending of $10.6 billion, based on data from the National Retail Federation’s annual Halloween consumer survey. More people are participating (73%) in Halloween-related activities this year, up from 69% in 2022. The following charts show inflation-adjusted per capita spending on costumes, candy, and decorations back to 2005. Overall spending per capita hit $108 per person this year, up from $103 per person in 2019 (inflation adjusted to 2023 dollars).
One of the biggest changes provoked by the pandemic was increased spending on decorations over costumes or candy, as restrictions on public gatherings and concerns about health and safety left many opting for at-home Halloween celebrations. As in-person trick-or-treating and costume parties were discouraged or limited, decorating homes became a safer and contactless way to celebrate Halloween. People now spend around $3 more per capita on decorations than they do on candy, a shift from pre-pandemic trends.
While these numbers show spending on a per capita basis, consumers are expected to spend nearly as much on candy as on costumes on an absolute basis. Inflation remains high, making the prices of everyday items such as groceries and utilities more expensive. Candy prices are up an average of 13% this month compared to last October, more than double the 6% increase in all grocery prices. Still, even after adjusting for inflation, the average consumer is not expected to spend as much on candy this year as they did in 2021.
This year, about 2.6 million children nationwide plan to dress as Spiderman, 2 million as their favorite princess, around 1.6 million as a ghost, 1.5 million as a superhero and 1.4 million as a witch. This marks the third year in a row Spiderman has been the most popular choice among children, surpassing “Princess” in 2021 following the release of Spider-Man: No Way Home. Newcomers include Barbie, following the release of Barbie (2023), and Wednesday Addams, following last year’s release of Netflix’s Wednesday.
Bay Watch: A Weekly Look into the Bay Area Economy
October 26, 2023
Since the start of 2022, cities in California have permitted far fewer units of housing than peer cities.
From January 2022 to September 2023, San Francisco permitted only 296 units of housing per 100,000 people (or 2,391 units total), one of the lowest per capita housing production rates in the country, and the lowest of any major peer city. Permitting data come from the U.S. Census Bureau’s building permit survey, a dataset updated monthly on new residential housing permits. San Francisco isn’t the only city underproducing housing — other cities in the region and elsewhere in California are also lagging behind. Meanwhile, rapidly growing cities like Austin, Nashville, and Denver have permitted 5-10x as much housing as San Francisco on a per capita basis.
While many cite San Francisco’s size (49 square miles) and location on a peninsula as reasons for the city’s lack of new housing construction, many housing advocates point to Paris, France — a city smaller than San Francisco (40 square miles), but with high housing density and a population nearly 3 times the size. When opponents cite topography as a constraint, many advocates point to Hong Kong. Even if the goal is not to grow as large as Paris or as dense as Hong Kong, existing housing policies impede the city and region from building new housing, which in turn increases already high housing costs and displaces largely low-income earners who can’t afford to stay.
In fact, the city makes it more difficult to create more housing than any other city in the state, according to a new report released yesterday by the California Department of Housing and Community Development. The report calls on reforms to the city’s housing approval process, stating that “San Francisco has the longest timeline in the state for advancing a housing project from submittal to construction, taking an average of 605 days to issue a building permit to an already entitled housing project.” The report also found that at least 18 city policies and practices are out of compliance with state law.
What are the implications of underproducing housing?
In a supposedly progressive state, outcomes have been remarkably regressive. Our region has one of the worst affordability crises in the country, creating conditions that have pushed lower income households to locations further from job centers or out of the region or state entirely. The median home sales price for single family homes in the San Francisco metro area (which includes Alameda, Contra Costa, Marin, San Francisco and San Mateo counties) is over $1.3 million, significantly higher than peer regions, including high cost areas like New York (whose metro area includes all of NYC, and parts of New Jersey and parts of upstate New York).
So, what's the solution?
There are three key ways our state, and cities in our region can reform to alleviate our housing crisis:
• Reform fees and exactions: During the process of updating its Housing Element, a state-mandated affordable housing plan, SF was asked to estimate the total cost of fees and other exactions on a typical housing project in San Francisco, and even it could not produce this number. According to members of the Bay Area Council, these fees and exactions can add more than $200,000 per home. SF can and should reduce these costs.
• Reform the review process for housing: San Francisco has chosen an extensive series of policies that result in the longest timelines to review housing, adding hundreds of thousands of dollars per home to the approval process. SB 35 (Wiener), a state law that forces faster review for certain projects, reduced SF's approval timeline from nearly 5 years to about 3 months, according to the State of California. San Francisco could and should choose to simply apply these review standards to every housing project.
• Reform zoning: even in progressive San Francisco, residential segregation remains a large issue. This is enforced through zoning codes, which determine what type of housing is allowed where and typically focus development away from wealthy, disproportionately whiter neighborhoods, concentrating development in less powerful, poorer communities. Reforming zoning to allow more apartments in wealthy, racially concentrated areas of affluence would have two key advantages: the higher rents developers can charge for homes in these areas would help them offset the cost of high construction loan interest rates, and it would decrease spatial segregation by locating affordable housing next to the region's best amenities and public schools.
Bay Watch: A Weekly Look into the Bay Area Economy
October 20, 2023
The region saw a decline in job growth in September after a short lived increase in August.
The 9-county Bay Area lost 16,700 jobs last month — a reversal that defied a slight uptick in August, when the region added 3,000 jobs. The region’s losses were driven largely by San Francisco and San Mateo Counties — losing 10,000 jobs from August to September with Professional and Business Services jobs leading the month-over-month loss with a decline of 6,100 jobs. Meanwhile, the North Bay fared well, gaining 2,000 jobs. However, the core employment centers of the region lost a significant amount of jobs — 10,000 fewer jobs in San Francisco and San Mateo, and 5,700 fewer jobs in the San Jose region, and 3,000 fewer jobs in Alameda and Contra Costa. The region experienced three months of rapid growth earlier this Spring, adding almost 35,000 jobs from April to June. Now, with growth cooling in August, and now the region experiencing its largest decline since December 2020, the future remains uncertain through the rest of the year.
San Jose continues to outpace other parts of the region in terms of overall employment recovery
Within the region, the San Jose metro area continues to outpace other parts of the region -- having grown 2.0% beyond pre-pandemic employment levels, adding 22,900 jobs since February 2020. The region as a whole is up 1% from pre-pandemic levels, attributed wholly to gains in San Jose plus the San Francisco region, which includes San Mateo county. The North Bay saw tremendous growth but continues to lag behind the rest of the region, particularly the San Rafael metro, which contains Marin County, still down 2.2% of pre-pandemic jobs.
Which industries are leading 2023 job gains?
Despite taking the biggest hit since the start of the pandemic, jobs in leisure and hospitality (restaurants, bars, hotels, arts, sports) are driving recent growth. Construction, Education, Health, and Retail Trade have also seen big gains. Professional Services and Information saw a decline this month. Industries that have rebounded since January are Retail Trade and Government.
Bay Watch: A Weekly Look into the Bay Area Economy
October 12th, 2023
Last week news reports across the region celebrated that Bay Area home prices had risen for the first time in 14 months, finally overcoming climbing interest rates amid ever-tight inventory. And while that is true in year-over-year terms – a traditional measure of home values that compensates for the seasonality in the housing market – home values have actually been rising in absolute terms throughout most of 2023. The Bay Area market currently sits a full 26 percent higher than it did at the start of the year, following a precipitous drop from the post-pandemic highs of 2022.
The End of Seasonality in the Housing Market?
No, it’s not likely that the seasonal nature of the housing market will go away. However, massive shifts in preferences following the COVID-19 pandemic coupled with rapidly rising interest rates have resulted in a market environment that in some cases is overcoming traditional seasonal trends. This continues today as return to work policies continue to shift, causing individuals and families to reevaluate their housing choices and commutes, and rates continue to rise. Exceptionally low inventory is also a driving factor, the total number of transactions in the region is down over 18 percent in the past year. One thing is clear: with inventory so low and prices continuing to climb, buyers are looking to get into a home regardless of the season.
Rents Holding Steady
Rents on the other hand have remained relatively stable, with a few exceptions. San Francisco remains well below its pre-pandemic high, as do other urban centers, while traditional bedroom communities continue to see slightly elevated rents. While rents originally saw some of the same rapid adjustments to changing preferences as the housing market did, they appear to be somewhat immune to the current interest rate driven speculation.
Bay Watch: A Weekly Look into the Bay Area Economy
October 6th, 2023
As San Francisco struggles to recoup pre-pandemic economic activity, AI companies soar
Amidst San Francisco’s economic struggles post-pandemic, the growth of AI companies has been a remarkable bright spot. The region’s deep talent pool, world-class research institutions, and venture capital ecosystem have fostered an environment where AI startups emerge and thrive. 2023 has already been a record year for VC investment in generative AI startups: 86 deals have yielded $14.1 billion in funding, almost 6x the amount of funding companies received in 2022. The 5 companies that have raised this year’s largest equity rounds are:
1. OpenAI, the AI research lab, which, according to its acclaimed AI model ChatGPT is “a leading AI research organization and technology company based in San Francisco, known for developing advanced AI models like GPT-3 and promoting responsible AI development” ($10B corporate minority round)
2. Inflection, which focuses on human-computer interfaces ($1.3B Series B)
3. Anthropic, an AI model developer and research outfit ($850M across a Series C and corporate minority round)
4. Adept, computer vision solutions for autonomous vehicles and robotics ($350M Series B)
5. Cohere, developer of natural language processing products, such as “Cohere Conversational AI,” designed to enhance customer support and communication through AI-driven chatbots and virtual assistants ($270M Series C)
Of the top 50 generative AI companies (meaning they are capable of generating text, images, etc.), 50% of them are headquartered in the Bay Area, with 12 in San Francisco alone. The map below shows exact locations of these 12 companies, mostly located in and around SoMa and the Mission District.
Bay Watch: A Weekly Look into the Bay Area Economy
September 22nd, 2023
New 2022 data show remote work in the Bay Area is here to stay
New data released last week from the U.S. Census Bureau show that 25% of Bay Area workers (aged 16+) primarily worked from home in 2022, a 8 percentage point decrease from a record level high of 33% in 2021. By comparison, only 17% of California and 15% of the nation primarily worked from home in 2022. The data come from the 2022 American Community Survey, an annual survey of 3.5 million households across the nation and reflect home locations, not work locations, of residents who worked from home as their primary form of commuting. In 2019, 260,000 residents in the Bay Area worked primarily from home, in 2021, that number skyrocketed to 1.2 million, a nearly 5 fold increase. By 2022, the number reduced to 938,000, as many office workers were asked to return to the workplace on a regular basis.
Still, these data indicate that remote work is here to stay for a large chunk of Bay Area workers, a major shift in a region where less than 10% of people primarily worked from home pre-pandemic. These new data also corroborate the Bay Area Council’s Return to Office survey, a survey of 200 employers across the region administered bi-monthly since April 2021. Each survey asks employers what percentage of their workforce they predict will be fully remote post pandemic, and for 15 months in a row, the results have hovered around 25%, closely matching new data from the Census. Meanwhile, public transit ridership continues to lag behind: only 5.5% of workers commute by transit as their primary form of transportation, up a meager 2 percentage points since 2021, and down 8 percentage point since 2019.
Bay Area residents are more likely to work from home than other parts of the state
On a municipal level, Bay Area cities had much higher shares of remote work than cities in Southern California or the Central Valley. Due to the prevalence of tech jobs in the Bay Area and a consequently higher remote work eligibility, 9 of the top 10 cities with the largest remote work shares were in one of five major Bay Area counties. On the flip side, big cities in California’s Central Valley such as Fresno and Bakersfield saw less than 10% of residents primarily working from home, illustrating a massive socioeconomic divide between coastal high-tech cities and the suburbs that surround them, and central in-land cities with higher shares of in-person working class jobs.
Bay Watch: A Weekly Look into the Bay Area Economy
September 15, 2023
The region saw positive job growth in August after a short lived decline in July, but growth rates have slowed
The 9-county Bay Area added 3,000 jobs last month — a reversal that defied a slight downtick in July, when the region lost 700 jobs. The region’s gains were driven largely by the East Bay — gaining 3,500 jobs from July to August. The North Bay also fared well, gaining 1,200 jobs. Meanwhile, the core employment centers of the region continued to lose jobs — 1,200 fewer jobs in San Francisco and San Mateo, and 500 fewer jobs in the San Jose region. The region experienced three months of rapid growth earlier this Spring, adding almost 35,000 jobs from April to June. Now, growth is starting to cool, and the future remains uncertain as we enter the final quarter of the year.
Over the last six months, the region’s average monthly job gain hovered around 5,430. Compare that to the same six months in 2019, when the average gain was around 6,850, we are not faring much worse. The region continues to grow across most sectors, not just tech, and core job centers (see line chart below) have mostly experienced positive growth.
San Jose continues to outpace other parts of the region in terms of overall employment recovery
Within the region, the San Jose metro area continues to outpace other parts of the region -- having grown 2.2% beyond pre-pandemic employment levels, adding 24,100 jobs since February 2020. The region as a whole is up 1% from pre-pandemic levels, attributed wholly to gains in San Jose plus the San Francisco region, which includes San Mateo county. The North Bay continues to lag behind the rest of the region, particularly the San Rafael metro, which contains Marin County, still down 4.4% of pre-pandemic jobs.
Which industries are leading 2023 job gains?
Despite taking the biggest hit since the start of the pandemic, jobs in leisure and hospitality (restaurants, bars, hotels, arts, sports) are driving recent growth. Construction, Education, Health, Professional Services and Information have also seen big gains (the latter two comprising most tech jobs). Industries that continue to struggle are Retail Trade and Government.
Bay Watch: A Weekly Look into the Bay Area Economy
August 4th, 2023
Tracking economic recovery: San Francisco ranks 24th out of 25 major regions for the 3rd quarter in a row, fastest growing regions all in Texas
For the third quarter in a row, the San Francisco metro area remains second to last in a list of 25 large metropolitan areas and their post-pandemic economic recovery. The Bay Area Council Economic Institute, in partnership with CBRE’s Tech Insights Center, updated their Regional Economic Recovery Index with data from the second quarter of the year, tracking recovery across 15 different metrics.
The three highest performers? Austin, Dallas, and Houston – hot, up-and-coming Texas regions that have seen staggering growth over the last three years. While the Bay Area has grown in a number of ways – reaching pre-pandemic employment levels, bringing in disproportionately high sums of VC dollars, and growing real wages faster than peer metros, its overall growth remains sluggish.
One major culprit? Remote work
The pandemic and resulting work-from-home policies — more prominent in the region’s vast tech sector — deeply affected the way many companies approached hiring and the cost of doing business. Within the region, San Francisco saw the largest increase in office vacancies among major markets, going from a 4% vacancy rate in Q4 2019 to 32% by Q2 2023. This 28 percentage point increase is nearly double as high as the next highest increase, a 10 percentage point increase in the Tri-Valley. Net absorption in the region is also remains negative —meaning that there is more space is coming onto to the market (via new construction, subleasing and lease expirations) than new leasing activity.
How do we score regions?
Regions are scored on 15 different metrics across 5 different categories: jobs, people, investment, economic activity, and affordability. Scores are out of 100. A score of 100 indicates that a region ranked first on every metric, while a score of 0 indicates that a region ranked last on every metric.
For example, Austin scored 100 in the People category, meaning it had the highest rate of both population growth and labor force growth, the two metrics in that category. San Jose, San Francisco, and Los Angeles all scored the lowest because they experienced the greatest population and labor force losses given their pre-pandemic levels.
The index was first developed in January 2023, with most data reflecting Q4 2022. The index was then updated in May 2023, with most data reflecting Q1 2023. The newest update reflects Q1 2023. Changes in regional ranks and scores are shown below.
Economic recovery scores as of July 2023:
Bay Watch: A Weekly Look into the Bay Area Economy
August 4th, 2023
As some cities experience a resurgence in business travel, reaching or exceeding pre-pandemic levels of hotel occupancy, conventions, and air travel, San Francisco and San Jose continue to struggle. This week we investigate what’s going on with business travel in the region, and whether a glimmer of hope or continued uncertainty looms on the horizon.
First, let’s dive into the labor market.
The Bay Area’s tourism industry has experienced one of the slowest recoveries in the nation. Between shutdowns during the first half of the pandemic, and the fundamental shift to remote work that followed, the region’s tourism and hospitality industry has struggled to stay afloat. The City of San Francisco’s tourism bureau says the industry is not expected to make a full recovery until 2025. Unsurprisingly, the Leisure and Hospitality industry (which includes jobs in restaurants, bars, hotels, theaters, and stadiums) in the San Francisco metro area (which includes SF, Alameda, Contra Costa, Marin, and San Mateo counties) has been slowest to recover.
Within this industry, the Accommodation sub-sector (which includes workers in hotels, lodging or other short-term accommodation) has struggled most to recoup its pre-pandemic employment, still down a quarter of its pre-pandemic employment. Meanwhile, jobs in the Performing Arts and Spectator Sports made a full recovery at the start of 2022, now having grown 6% beyond its pre-pandemic level. San Francisco’s struggling hotel industry can be largely traced to an outsized reliance on tech and the business travel tech companies brought to the city.
RevPAR, or revenue per room, is the most comprehensive metric for measuring the health of the hotel economy. It incorporates both the average daily rate and occupancy rate, and illustrates the revenue generated per room regardless of if rooms are occupied. The San Francisco and San Jose metro areas are the slowest two metro areas to recover, down over 10% of their pre-pandemic RevPAR, while hotels in southern vacation destinations like Tampa, San Diego, and Miami have seen drastic increases in demand, occupancy, and revenue.
Park Hotels & Resorts, one of the nation's largest hotel chains, announced earlier this summer that they plan to pull out of two hotels in downtown San Francisco, citing major challenges the city is facing and uncertainty in its future. In a report following their announcement, they draw a direct correlation between office vacancy rates (which are over 30% in San Francisco, the highest of any major office market in the country) and RevPAR. This means that the health city's hotel economy is largely reliant on business and office activity, unlike some cities that are more heavily reliant on leisure travelers.
According to data from the American Hotel & Lodging Association (AHLA), business travel revenue plunged nearly 69% in 2022, or $1.68 billion, compared to 2019, the steepest of any major metro area. And while it is impossible to fully differentiate hotel performance based on business versus leisure, we can look to hotels booked by attendees of conventions at the Moscone Center, San Francisco's largest convention space, to better understand how the city's business related travel is performing compared to pre-pandemic patterns.
In 2019, nearly 1 million hotel rooms were booked in the city by delegates attending Moscone Center conventions. By 2022, that number has not even recovered 40%, a much lower estimate than hotel, lodging and tourism experts were expecting, as 75% of group rooms nights were for events outside of Moscone Center. Moving forward, representatives for SF Travel say that their strategy for 2024 is to secure more corporate events in hotels as opposed to conventions or larger scale events, targeting smaller group events with shorter booking windows and expanding efforts to attract luxury and international group business.
What about air travel?
In terms of enplanements (total passenger boardings), SFO and SJC have still only recouped about 80-85% of pre-pandemic travel. Regional growth in RevPAR closely mirror patterns in air travel -- with places like Austin, Riverside, Miami, Dallas, Phoenix and Tampa experiencing growth well beyond pre-pandemic levels. While San Francisco has long relied on business travel to support its economy, most travelers coming in and out of SJC in San Jose are business travelers, which is why passenger boardings out of Silicon Valley are still down more than 20%, while SFO has fared a bit better - with international tourism opening back up and leisure travelers slowly returning.
Bay Watch: A Weekly Look into the Bay Area Economy
July 11th, 2023
Are wealthy people actually leaving the Bay Area in droves?
Short answer: no. However, they are leaving the region at a faster rate than they were before the pandemic, or after the Great Recession. The interactive chart below shows data from the U.S. Census American Community Survey in 2010, 2019 and 2021 to the questions “did you live in this house or apartment 1 year ago” and “where did this person live 1 year ago?” We tracked everyone who said they either moved into or moved out of the Bay Area, and tabulated them by income level to calculate overall trends in migration.
We found that in 2021, every income group experienced negative net migration, including what we call ultra-high income residents (earning $350k or more), which saw a net loss of 4,117 people. There has been a lot of buzz about wealthy residents leaving San Francisco and the Bay Area overall. Using data from the IRS, the San Francisco Chronicle wrote about the city’s declining population and the increase in average incomes of those leaving. However, as the article states, a high average income among people moving away doesn’t necessarily mean most of those migrants are wealthy, postulating that the increase in average incomes could be driven by a small number of very high earners.
While our dataset is a resident survey different from the Chronicle’s, the below chart does confirm a change in migration patterns that have led to a decline in the region’s population of higher income earners. In 2019, 3,340 ultra-high income residents left the region, while 3,626 moved in, for a net increase of 286 residents. In 2021, 7,979 left, and 3,862 moved in, for a net decrease of 4,117. It is critical to note that despite these shifts, net losses are still driven by lower income residents moving out: nearly 75% of the region’s net out-migration is attributable to individuals leaving who earn $100k or less. Therefore, reported increases in average incomes of those who left the region are skewed because of the increase in relatively small numbers of ultra-high income movers.
Bay Watch: A Weekly Look into the Bay Area Economy
June 29th, 2023
Bay Area residents are increasingly moving out of state. Still, 67% of those who moved in 2021 stayed in the Bay Area, and another 15% moved elsewhere in California
The Bay Area has long been a destination for tech-driven opportunities, cultural diversity, and iconic natural beauty, attracting a steady stream of newcomers. However, like many large metropolitan areas across the country, the pandemic exacerbated many of the issues the Bay Area has been facing for years: a high cost of living and high remote work eligibility that allowed people to chase more affordable options elsewhere. This out-migration, paired with record low birth rates and a temporary slow down on international migration, led to record population losses for San Francisco and the region more broadly. If it weren’t for an uptick in foreign immigration and net births in 2022, the region would have lost 111,000 people. Instead, it netted a loss of 68,000 people.
In 2021, the region saw 113,844 out of state moves and 106,201 moves to other parts of California, according to the U.S. Census American Community Survey, up 36,000 and 25,000, respectively, since 2019. Despite this, no category fared worse in 2021 than right after the Great Recession in 2010, after which the region experienced 10 years of hyper fast growth.
More and more people are moving from the Bay Area out of state: in 2010 80% of people who moved stayed in the Bay Area, while in 2021 that percentage shrank to 67%. Still, 2/3 is no small measure. Paired with an additional 15% of people that moved elsewhere in California, over 80% of people that moved stayed in-state.
Among those who left the region entirely, top destinations include Los Angeles and Sacramento counties, as well as states like Texas, Washington, and Oregon
Of the 17% of people that moved out of the Bay Area entirely in 2021 (275,212 people total), 47% moved elsewhere in California, down from over half (51%) in 2010. This is in part due to large increases to more affordable states with emerging tech opportunities like Texas and Washington. Of those that moved elsewhere in California, counties in Southern California have grown in popularity, while nearby counties such as Sacramento, San Joaquin, and Yolo have seen decreasing shares over time.
Most of these trends have been occurring since before the pandemic started, but in terms of demographics, moves out of the region were composed of more highly educated, wealthy people leave than we've historically seen – in 2019, 49% of people that moved out of the bay area had a Bachelor's degree or higher. In 2021, that number jumped to 53%. In terms of income, 63% of people that moved made $50,000 or less. In 2021, that number shrank to 54% as higher earners who were more likely to work remotely left in greater droves. Still, those earning $150,000 or more only comprise 12% of those leaving - so low income earners still constitute the majority of exits.
Bay Watch: A Weekly Look into the Bay Area Economy
June 23rd, 2023
San Francisco on the silver screen
In the wake of the pandemic, downtowns across the nation have been grappling with empty storefronts, low foot traffic and hollowed out office buildings. As cities begin to think strategically about how to increase downtown vibrancy, arts and culture have emerged as possible drivers of economic revitalization, including cultural festivals, art exhibitions, and live performances, which can add vitality, foot traffic, and a sense of community to a currently bleak landscape.
This week, as San Francisco continues to struggle with its reputation post-pandemic, we celebrate the city through its illustrious contribution to movies and television, and why it remains such a captivating backdrop for filmmakers. From Alfred Hitchcock’s Vertigo, which showcased some of the city’s most iconic landmarks, to the famous car chase in Bullitt, the city has left an important mark on film history.
Since 1915, over 300 films and television shows have been shot in San Francisco, averaging around 6 per year since 2000. In 2015, a peak 15 films and shows were filmed in the city, including Steve Jobs, Ant-Man, Terminator Genisys, and the TV show Looking. Four directors have shot a record four movies a piece in the city: Philip Kaufman (Hemingway & Gelhorn, Invasion of the Body Snatchers, The Right Stuff, Twisted), Chris Columbus (Bicentennial Man, Mrs. Doubtfire, Nine Months, Rent), Alfred Hitchcock (Family Plot, Marnie, The Birds, Vertigo), and Garry Marshall (Beaches, Pretty Woman, The Other Sister, The Princess Diaries).
What are the most popular locations to film in San Francisco?
Of the 319 films and television shows shot in San Francisco, nearly 10% featured a shot in Golden Gate Park, including shots in or of the Conservatory of Flowers (Harold and Maude, Vertigo, Heart and Souls), and the Steinhart Aquarium (Basic Instinct, The Lady from Shanghai) and Kezar Stadium (Dirty Harry). Other popular locations include City Hall, the Fairmont Hotel, and the Golden Gate Bridge.
Hover over a popular landmark below to view all films and shows, in chronological order, shot in that location.
Bay Watch: A Weekly Look into the Bay Area Economy
June 16th, 2023
The region showed strong job gains again in May, defying tech layoffs and March losses
In March 2023, the Bay Area’s two-year growth streak came to an end when the region lost 4,400 jobs, which many saw as the first impacts of reported tech layoffs across the region. However, the region added 12,400 jobs in April and 10,400 jobs in May — a surprising reversal that defies the tech layoffs and bank failures that had characterized the first quarter of the year. While sectors other than tech are continuing to create new jobs, there is still great uncertainty at a macro level regarding the economy’s future path. As the region moves forward, it remains to be seen whether the impact of tech layoffs will continue to be reflected in future job deficits or if the worst is behind us, but two solid months of growth do show that the Bay Area is not on the precipice of a recession.
San Jose continues to outpace other parts of the region in terms of overall employment recovery
Within the region, the San Jose metro area, which includes Santa Clara and San Benito counties, continues to outpace other parts of the region -- having grown 1.8% beyond pre-pandemic employment levels, adding 20,600 jobs since February 2020. Only San Jose, San Francisco, and Oakland/East Bay (as of this month) have exceeded their pre-pandemic employment levels. The North Bay continues to lag behind the rest of the region, particularly the San Rafael metro, which contains Marin County, still down 4.6% of pre-pandemic jobs.
Bay Watch: A Weekly Look into the Bay Area Economy
June 9th, 2023
The region’s finance and insurance sector has struggled to regain its former strength
The recent turmoil in the banking sector has put the spotlight on the Bay Area, with the notable failure of Silicon Valley Bank and the collapse of First Republic Bank this year. In this week’s Bay Watch, the Economic Institute analyzes newly released data from the U.S. Bureau of Labor Statistics to better understand the trajectory of the Bay Area’s finance sector over the last two decades.
The numbers show that the region’s total employment in finance and insurance has dropped by from 150,000 in 2001 to 130,000 in 2022. This decline has occurred over the same period that the region’s overall number of jobs has grown from 3.5 million to near 4.0 million—with broad increases across almost all sectors. When looking at the numbers by county, only San Francisco and San Mateo counties had more finance jobs in 2022 when compared to 2006 (before the Great Recession), and both of their increases are marginal.
While jobs in finance and insurance have not experienced significant nationwide growth in the last two decades, changes to the industry after the financial crisis appear to have eroded the Bay Area’s place as the West Coast’s financial center. While the numbers in this particular industry category have fallen across the region, finance-adjacent companies—such as those in payment processing and financial technology—are growing. These companies often are placed in technology sectors rather than the finance sector, so the Bay Area’s strength in non-traditional finance is likely being masked.
Bay Watch: A Weekly Look into the Bay Area Economy
June 2nd, 2023
Bay Area aging faster than ever before
Last week, we wrote about significant racial demographic shifts with data from the latest 2020 Census release. This week, we dive deeper into the Bay Area’s aging population – as the region experiences an exodus of young people from the region, and many retirees choose to stay. The region’s 75+ residents now account for nearly 7% of the region’s population, a higher share than any of the previous 5 censuses (dating back to 1970). In terms of overall numbers, the number of residents aged 60+ saw the most dramatic increases, while the number of young children was the only category to see a population decline from the last census.
The region’s housing affordability crisis, paired with a largely permanent hybrid/remote work has contributed to large swaths of young professionals leaving the region. Domestic out-migration remains a major problem and contributor to the region’s population loss. If it weren’t for positive foreign immigration and net births, the region would have lost 111,000 people in 2022. In contrast, retirees, many of whom may already own their homes, are choosing to stay for quality of life, established social networks, and high quality access to healthcare services.
Bay Watch: A Weekly Look into the Bay Area Economy
May 26th, 2023
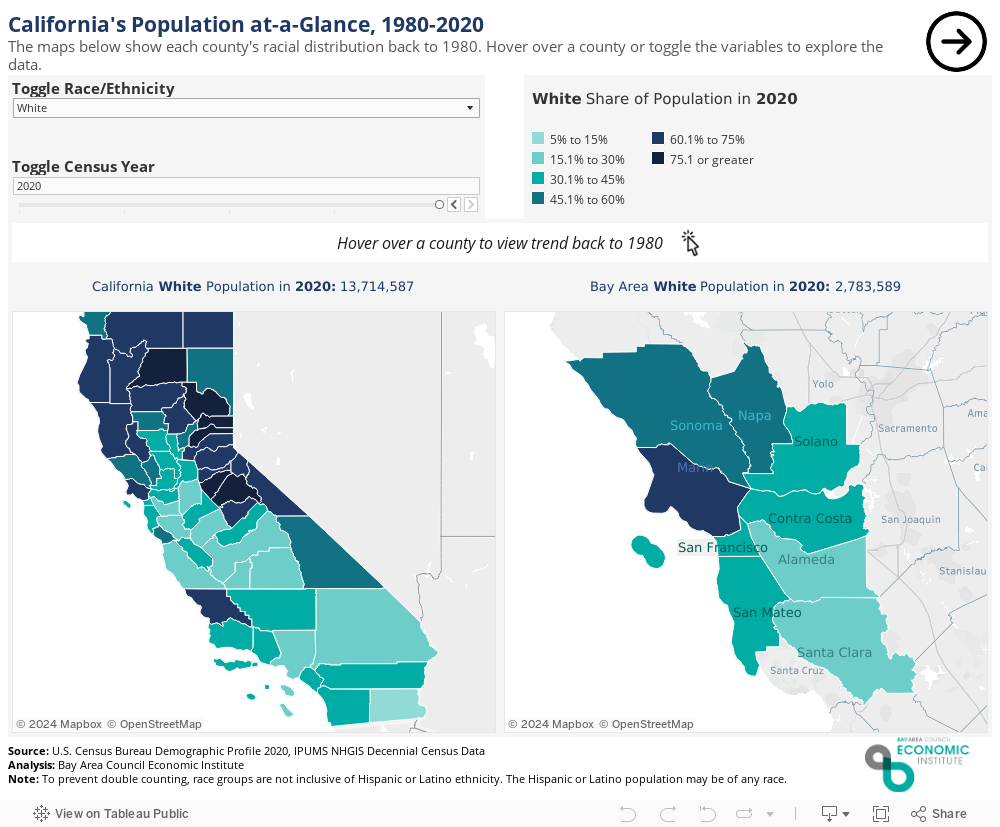
Bay Area more diverse than ever with new 2020 Census data
New demographic data released by the U.S. Census Bureau this week highlights an increasingly diverse Bay Area population. Data from the 2020 Census shows the nine-county Bay Area’s population of 7.765 million increasing by over 600,000 people over the course of the previous decade. While the total number of residents has fallen in the last three years, these data points from 2020 provide the best approximation of the region’s demographic makeup.
Notably, the combined numbers for Latinx (24.4%) and Asian/Pacific Islander (28.5%) residents now make up a majority of the region’s population. While Latinx and Asian/Pacific Islander counts increased, the number of Black residents and White residents in the region both fell. The region’s Black population has been falling since 1990, with a net loss of 80,000 residents over 30 years, and it now makes up just 5.6% of the region’s overall population. In 1990, the White population accounted for 61% of the region’s population; that number has fallen to 36% in 2020.
Interactive data tool:
For more data visualizations on the region’s demographics, please visit the Economic Institute’s Bay Watch. We will analyze age trends in next week’s edition.
Bay Watch: A Weekly Look into the Bay Area Economy
May 19th, 2023
The region showed strong job gains in April, defying tech layoffs and previous month’s losses
In March 2023, the Bay Area’s two-year growth streak came to an end when the region lost 4,400 jobs, which many saw as the first impacts of reported tech layoffs across the region. However, the region added 11,000 jobs in April, a surprising reversal that defies the tech layoffs and bank failures that had characterized the first quarter of the year. Sectors other than tech are continuing to create new jobs, and the region seems to be entering a phase of the economic cycle where inflation is moving back toward a reasonable range and high interest rates have become normalized. However, there is still great uncertainty at a macro level regarding the economy’s future path. As the region moves forward, it remains to be seen whether the impact of tech layoffs will continue to be reflected in future job deficits or if the worst is behind us, but the April numbers do show that the Bay Area is not on the precipice of a recession.
San Jose continues to outpace other parts of the region in terms of overall employment recovery
Within the region, the San Jose metro area, which includes Santa Clara and San Benito counties, continues to outpace other parts of the region -- having grown 1.7% beyond pre-pandemic employment levels, for an additional 19,400 jobs. Only San Jose and San Francisco have exceeded their pre-pandemic employment levels at any point since March 2020. After suffering the greatest job loss in March, the Oakland MD (which includes Oakland, Hayward and Berkeley) saw the greatest bounce back in April, recouping the nearly 5,000 jobs it lost, on top of 1,500 additional jobs. The North Bay continues to lag behind the rest of the region, particularly the San Rafael metro, which contains Marin County, still down 5.2% of pre-pandemic jobs.
Bay Watch: A Weekly Look into the Bay Area Economy
May 5th, 2023
The Bay Area sees population loss for the third straight year, losing 34,000 people across 2022.
New data released this week by the California Department of Finance shows a continuation of population losses in the nine-county San Francisco Bay Area during 2022. For the third straight year, the region and the state experienced a decline in population. The Bay Area and California each lost 0.4% of their populations during 2022, 34,000 people and 138,000 people, respectively. This number represents a slowing pace of population loss compared to 2020 and 2021, which is attributable to increases in international immigration and reduced outflows from net domestic migration across the state.
Marin and Napa counties in the North Bay experienced the largest percentage losses of 2022 in the region, both falling in population by 1.0%. In terms of overall population numbers, Alameda, San Francisco, and Santa Clara counties saw the greatest population losses, with 8,054, 5,333, and 4,888 residents leaving the respective counties.
Despite the Bay Area’s continuing population loss, it is occurring at a slower rate than the previous two years.
With high costs of living and more options for remote work, there continues to be a net movement of population out of the Bay Area to other parts of the state. While the data released this week does not include county-to-county migration flows, neighboring counties such San Joaquin, Merced, and San Benito did register population gains. Only 12 of the state’s 58 counties produced a population increase in 2022.
The Bay Area’s population now sits at an estimated 7,549,000, down a full 200,000 people from the January 2020 estimate of 7,749,000.
Bay Watch: A Weekly Look into the Bay Area Economy
April 28th, 2023
The Bay Area ends its nearly two year long job growth streak as layoffs take further effect.
For the past two years, the Bay Area experienced consistent albeit plateauing job growth as the region recovered from impacts of COVID-19. This growth streak came to an end this past March as the Bay Area lost nearly 7,000 jobs. Last month, the first impacts of tech layoffs were seen in slower job growth, with the region adding only 2,000 jobs compared with the previous month’s high of 23,000. However, this month the Bay Area is seeing the more realized effects of the layoffs as the region experienced its first negative growth in the past two years. As the region moves forward, it remains to be seen whether the impact of tech layoffs will continue to be reflected in negative job growth or if the worst is over.
San Jose experiences positive job recovery once again despite negative job growth for the region overall.
Within the region, the San Jose metro area once again leads the pack, adding 2,200 jobs over the last month despite the region losing 6,700 jobs overall. Only San Jose and San Francisco have exceeded their pre-pandemic employment levels at any point since March 2020. However, unlike San Jose, and as one of the tech hubs of the region, San Francisco did not avoid the job loss seen by the rest of the region losing 1,400 jobs over the past month. Oakland suffered the biggest job loss of the past month, losing 6,400 jobs, contributing to a majority of the region’s losses. The North Bay continues to lag behind the rest of the region, particularly the San Rafael metro, which contains Marin County, still down nearly 6% of pre-pandemic jobs.
Bay Watch: A Weekly Look into the Bay Area Economy
April 14th, 2023
The Bay Area continues to be a regional hub for new unicorn companies, indicating lasting strength of the region’s start-up eco-system.
The term “unicorn” was coined in 2013 to describe a privately owned start-up company valued at $1 billion or above. While unicorns were not as common in the early 2010s, venture capital investment during the COVID-19 pandemic sparked a substantial increase in their numbers, leading to an unprecedented high of 1,000 unicorn companies worldwide as of 2022.
Despite a downturn in economic activity across the regions business cores, The Bay Area is still home to 44% of all unicorn companies, and over half (57%) of US pentacorns, or companies with valuations of $5 billion or above. And contrary to stories questioning whether the Bay has lost its edge as an innovation hub, the region still accounts for 39% of new unicorns, or 64 of 161 US companies that hit a $1 billion valuation since the start of last year, more than double the amount of the next highest region (the New York metropolitan area).
San Francisco positions itself as the intra-regional leader over Silicon Valley. Of the 64 new unicorns across the Bay Area, 37 are in San Francisco, 22 are in Silicon Valley/Peninsula, and 5 are in the East Bay. The largest among these include Miro, an online, visual collaboration platform based in SF worth $17.5B, and Anthropic, an AI safety and research company based in SF worth $4.4B. Nearly half of top 20 largest companies to reach a $1B valuation in the last year are headquartered in the Bay Area.
Bay Watch: A Weekly Look into the Bay Area Economy
March 30th, 2023
Job growth slowed in February, indicating tech layoffs finally reflected in the data
In January, we saw dramatic job growth in the Bay Area – the region added 23,000 jobs, finally recovering to pre-pandemic employment levels. The pace of growth slowed considerably in February, based on new data from the Bureau of Labor Statistics. The Bay Area added 2,400 jobs last month, a modest but not negligible increase. February’s slow down is the first real indication that tech layoff announcements are finally being reflected in the employment data. The modestly positive gains in February show that the Bay Area economy, while concentrated in tech, is not only tech, as our other sectors remain resilient in the face of inflation, high interest rates, and general uncertainty about the future economic path of the nation and region.
San Jose leads the pack in terms of overall recovery
Within the region, the San Jose metro leads the pack, adding 17,600 jobs since February 2020. And despite a slight drop of 900 jobs in February, this subregion, which mostly consists of Santa Clara county, is still up 1.5% from pre-pandemic employment levels. San Francisco also experienced a slight drop from its 8,900 gain in January, losing 1,500 jobs last month. The East Bay was the biggest winner, gaining 3,500 jobs in addition to its 7,900 job gain in January. This may be due to the high concentration of tech in San Francisco and the South Bay, where the impact of layoffs and hiring freezes is greater. Another factor may be that the East Bay has more to gain, given it still has not hit pre-pandemic employment levels. The North Bay continues to lag behind the rest of the region, particularly the San Rafael metro, which contains Marin County, still down nearly 6% of pre-pandemic jobs.
Bay Watch: A Weekly Look into the Bay Area Economy
March 24th, 2023
While banking failures and tech layoffs spark fear, the Bay Area’s tech and venture capital ecosystem remains strong.
The Bay Area economy is considered one of the most innovative business ecosystems in the world, leading in both startups and technological advancements. Despite historic strength in these key industries, the Bay Area is currently facing significant economic pressures that are leaving many concerned. Mostly recently, the collapse of the Silicon Valley Bank, a crucial resource for many Bay Area startups, has created uncertainty regarding the near future of venture capital investment.
Venture capital investment experienced its highest ever level during the pandemic, with the Bay Area seeing upwards of $29 billion in quarterly funding and nearly 40% of all VC investments made in the US. However, much of this momentum has slowed down in recent quarters in the Bay Area and nationwide. The region saw much lower receipts of VC across the last two quarters which is cause for some concern due to the region’s reliance on the VC industry. However, even at its current low, the Bay Area received 23%, or just over a fifth, of all US VC funding during Q4 of 2022. Despite VC funding dropping off a cliff, the Bay Area is still seeing a significant portion of VC funding entering the region and is receiving more than any other nationwide.
California and the US have consistently exceeded the Bay Area’s job recovery, hitting pre-pandemic employment levels last summer. The Bay Area’s slower jobs recovery is largely attributable to the lagging recovery of its Leisure and Hospitality sector, which includes jobs in accommodation (hotels, lodging), food services (restaurants, bars), arts, entertainment, and recreation. And despite tech layoffs, some of which are still not reflected in the data, the region continues to show resilience and steady growth.
The Bay Area remains a stronghold for IPOs and billion-dollar companies.
The pandemic saw many of the Bay Area’s tech companies turn to remote work and ultimately some of these companies chose to relocate their headquarters and office space out of the Bay Area. Once again, the exodus of several companies from the Bay Area sparked concern about the future of the region’s tech stronghold but these fears may be overstated. The table below lists U.S. IPOs and tech exits valued over $10 billion, which occurred over the course of the pandemic. Of these 27 companies, 15 locate their headquarters within the Bay Area. With more than half of the major stock market exits in the last three years, the region has flexed its significant tech economy strength.
While there are reasons to be concerned about the Bay Area’s economy, many of these concerns overlook the fact that despite the region losing some ground, overall, it remains the stronghold of VC and technological innovation. Many of the world’s most valuable companies remain in the region, and despite layoffs, many of these companies are still larger than they were two or three years ago. The Bay Area’s tech and innovation economy is down, but not out.
Bay Watch: A Weekly Look into the Bay Area Economy
March 17th, 2023
After 3 years of steady, slow growth, the Bay Area has fully recovered its pre-pandemic jobs
This week, the Bureau of Labor Statistics released its first look at employment in 2023 – showing that the Bay Area has finally recovered to pre-pandemic employment levels, adding 23,000 jobs in January of this year. Since the region’s pandemic low-point for employment in May 2020, the region has added back 581,000 jobs, with the largest gains occurring in the San Jose metro (gaining 153,300 jobs).
Within the region, the South Bay added 5,100 jobs, the East Bay added 7,900 jobs and the San Francisco-San Mateo metro region added 8,900 jobs. In terms of overall recovery since February 2020, the South Bay and San Francisco metros are leading the charge. The San Jose metro is at +0.8% employment compared to pre-pandemic levels, the San Francisco-San Mateo metro is at +0.2%, while East Bay is still down -0.8% and the North Bay is down -2.7%.
California and the US have consistently exceeded the Bay Area’s job recovery, hitting pre-pandemic employment levels last summer. The Bay Area’s slower jobs recovery is largely attributable to the lagging recovery of its Leisure and Hospitality sector, which includes jobs in accommodation (hotels, lodging), food services (restaurants, bars), arts, entertainment, and recreation. And despite tech layoffs, some of which are still not reflected in the data, the region continues to show resilience and steady growth.
The Bay Area added 23,000 jobs from December 2022 to January 2023, the biggest month-to-month gain since 2021
In terms of monthly job gains, January 2023 saw the biggest month-to-month increase since October 2021, and marked the 24th consecutive month that the region gained employment, since the peak of the Omicron variant outbreak in late 2020/early 2021, when we lost 35,000 jobs in a 2-month period. The state’s Employment Development Department announced technical issues that prevented us from investigating these data by industry, so it is still unknown how much of these gains are due to tech/office jobs and how much are due to service sector jobs in the leisure and hospitality industry. When those data are released, we will dive deeper into sector-by-sector gains.
Bay Watch: A Weekly Look into the Bay Area Economy
March 9, 2023
It’s been three years since the onset of the COVID-19 pandemic, and many businesses in San Francisco have struggled to stay afloat amid new variants, shutdowns, and a shift to remote work. Throughout the pandemic, the spotlight has been on downtown activity as a measure of the city’s economic health and vitality – but how much worse is downtown faring in terms of business starts and closures? Are trends downtown representative of the city at large, or are other neighborhoods bolstering the city’s business activity?
A north/south divide
From March 2020 to February 2023, the City of San Francisco saw almost as many businesses close as open, based on real time data from the Office of the Treasurer and Tax Collector, which tracks businesses that are registered and pay taxes to the city. Over this three year period, 29,456 businesses of all sizes closed, while 29,998 opened, a small net increase of 532 new businesses. The Financial District and Chinatown took the biggest hits, accounting for nearly 20% of the city’s overall business closures. For every business that closed in the Financial District, 0.5 businesses opened. The city overall fared better, seeing 1.02 business openings for every business closure, largely attributable to the city’s southern-most neighborhoods such as Bayview/Hunter’s Point, Visitacion Valley, Excelsior, Portola, and Oceanview/Merced/Ingleside, all of which saw more business openings than closures during the pandemic.
When we analyze business activity for only the last 12 months (Feb 2022 through Feb 2023) – FiDi and Chinatown were the only two neighborhoods in the entire city to see more businesses close. This indicates that most of the city, outside of the downtown core, has started to recover its pre-pandemic business activity.
Heading in the right direction
Overall, the city is in an upward trajectory in terms of net business starts. In 2022, 1.45 businesses opened across San Francisco for every business that closed, a higher ratio than the first two years of the pandemic, and a higher ratio than years leading up to the pandemic. As businesses and employees alike enter an age of remote work, residential neighborhoods are seeing an uptick in business activity and commercial vitality, compensating for the decline in new businesses in and around downtown.
The overall number of new business starts is still below what it was pre-pandemic. In 2019, San Francisco saw 14,270 new businesses open, compared to 10,080 for 2022. However, factoring in the number of business closures, the city is still netting a higher number of new businesses (3,140 in 2022 versus 1,540 in 2019). While we may see fewer businesses open than the historic average, we’re also seeing far fewer closures.
Bay Watch: A Weekly Look into the Bay Area Economy
February 23rd, 2023
The Bay Area’s tourism industry has experienced one of the slowest recoveries in the nation. Between shutdowns during the first half of the pandemic, and the fundamental shift to remote work that followed, the region’s tourism and hospitality industry has struggled to stay afloat. In fact, the City of San Francisco’s tourism bureau says the industry is not expected to make a full recovery until 2025. This week’s Bay Watch analysis explores the Bay Area’s leisure, hospitality, and tourism industries and what recovery might look like going forward.
How does service sector employment currently stand?
Leisure and Hospitality jobs in the Bay Area are still down 10.3% as of December 2022. These jobs include workers in accommodation (hotels, lodging), food services (restaurants, bars), arts, entertainment, and recreation. While other sectors like Information and Professional and Businesses Services, which include the majority of office workers (tech, legal services, R&D etc.) have actually exceeded their pre-pandemic employment numbers, overall employment is still down 1% largely due to the lagging recovery in Leisure and Hospitality.
Which sub-sectors are driving the slow recovery in Leisure and Hospitality?
Within the Leisure and Hospitality industry in the San Francisco metro area (which includes SF, Alameda, Contra Costa, Marin, and San Mateo counties), employment in Accommodation has seen the slowest recovery. This sub-sector, which includes workers in hotels, lodging or other short-term accommodation, which has recovered just 66% of its pre-pandemic jobs. Jobs in the Performing Arts and Spectator Sports made a full recovery at the start of 2022, even growing 11% beyond pre-pandemic employment in the latter half of the year. Food Services and Drinking Places, which include bars, restaurants, and caterers accounts closely mirrors recovery of the sector as a whole, since it accounts for nearly 70% of Leisure and Hospitality employment.
How have Bay Area hotels fared during the pandemic?
Hotel RevPar (revenue available per room) in both San Francisco and San Jose are still down more than 20% as of Q4 2022 from Q4 2019. RevPar is the most comprehensive metric for measuring the health of the hotel economy. It incorporates both the average daily rate and occupancy rate, and illustrates the revenue generated per room regardless of if rooms are occupied. Despite a current occupancy rate of 64%, San Francisco's decrease in RevPar indicates that hotels are bringing in $143 per day per room, down $38 per day per room in Q4 2019. Current estimates place national RevPar growth at 5.8% as of January 2023, demonstrating a continuing trend of strong but moderate growth.
What lies ahead for the Bay Area's tourism industry?
Overall, the Bay Area is still down 38,600 pre-pandemic jobs or -0.9% of its pre-pandemic employment. However, when excluding just the Leisure and Hospitality industry, the Bay Area has actually fully recovered its pre-pandemic employment and additionally gained 7,000 pre-pandemic jobs. The lagging recovery of the tourism industry hides the strength of the Bay Area’s recovery in its non-tourism industries. One promising trend: SFO is at nearly 80% of its pre-pandemic passenger boardings, up an additional 20% from December 2021.
Bay Watch: A Weekly Look into the Bay Area Economy
February 3rd, 2023
Bay Area transit agencies still struggling to recoup ridership, while bridge traffic hovers close to pre-pandemic levels
Amidst pandemic-related shutdowns, spikes in COVID cases due to new variants, and a fundamental shift to remote work, downtown cores, businesses, and transit agencies that rely on office workers have struggled to recover. This decline in economic activity has led to a slow and challenging recovery of ridership on the Bay Area’s numerous public transit systems. In this week’s Bay Watch, we analyze BART, CalTrain and WETA (ferry) ridership throughout 2022, as well as car commuters crossing the Bay’s various toll bridges.
CalTrain and BART ended the year with low levels of ridership, bringing in 18% and 33% of their pre-pandemic ridership in December 2022, respectively. Contrastingly, toll tag data show 86% of pre-pandemic traffic volumes have returned on the Bay Bridge. Ridership on WETA’s 15 passenger ferries has fared better, having recovered nearly 70% of pre-pandemic riders.
From January to December of last year, BART added an average of 41,979 new weekday riders, bringing its pre-pandemic recovery up to 33% from 26%. Still, BART averaged 130,381 riders per weekday in 2022, down 277,946 (or 68%) of riders from 2019’s average weekday ridership of 408,326. BART ridership peaked in September 2022 at 41% of its pre-pandemic ridership, while CalTrain’s recovery peaked in August 2022 at 29%.
How do things look by days of the week?
Unlike public transportation, car commuting across the Bay Area’s state-owned toll bridges have made a nearly full recovery. Our analysis reveals that that many people who are now commuting are choosing to drive alone or carpool, rather than take transit. In an analysis of morning commutes (6-10am) across the four most trafficked bridges in the region, the Bay Bridge demonstrated the highest midweek volumes (over 100% pre-pandemic traffic on Wednesdays), while the San Mateo-Hayward bridge, which takes many commuters from the East Bay and beyond into tech campuses and startups scattered throughout the South Bay, has demonstrated some of the lowest midweek volumes given pre-pandemic levels. Mondays and Fridays remain the lowest traffic days, reflecting how hybrid work schedules have changed the nature of commuter traffic.
These changes align closely with our return to work and transit survey, which we administer bi-monthly to roughly 200 employers throughout the region to inform transit agencies and policymakers. When asked what percentage they anticipate their workforce to come into the workplace six months from now, employers responded that around 50-60% will come in Tuesday through Thursday, while only 37% will come in Mondays, and 27% will come in Fridays.
Bay Watch: A Weekly Look into the Bay Area Economy
January 27th, 2023
Bay Area population falls for third straight year
New data released this week by the California Department of Finance offers a first look at the region’s population in 2022. Each year, the DoF releases population estimates for July of the previous year, and for the third straight year, the nine-county Bay Area lost population from July 2021 to July 2022, bringing the total population down to 7.56 million, a loss of over 200,000 people since the pandemic began. San Francisco proper lost 4,300 people, or 0.5 percent of its population from 2021 to 2022, a smaller loss than the whopping 32,000 people (or 4 percent of its population) it lost from 2020 to 2021. The biggest losers (relative to their 2021 population) were in the North Bay – with Marin and Napa counties losing 1.5 and 1.3 percent of their populations, respectively.
What's driving the region's population decline?
From July 2020 to July 2021, the region saw record negative net domestic migration, as nearly 127,000 people left the region. New data for July 2022 show a significant uptick in foreign immigration, as travel restrictions loosened for international newcomers. The region's natural increase (births minus deaths) also increased slightly, as death rates declined and birth rates increased. But domestic out-migration remains a major problem and contributor to the region's population loss. If it weren't for positive foreign immigration and net births, the region would have lost 111,000 people in 2022.
Where did people go?
While remote work opened new avenues for many prospective homebuyers once restricted by geography, most of the residents who left fled to suburban communities within Northern California, or to other more affordable parts of the state. Many see Texas and Florida as the most common destinations for residents who left, and while moves out of state did increase during the pandemic, top destinations for those who moved away from the region are still largely in the Northern California megaregion or California more broadly. Among those who moved out of the region in 2021, a quarter moved to the Los Angeles, Sacramento or Santa Cruz metro areas. Another 20% moved to cities in the Central Valley or smaller cities just outside the region.
Bay Watch: A Weekly Look into the Bay Area Economy
January 20th, 2023
Region ends the year strong, but layoffs loom
The Bay Area ended the year strong, adding nearly 14,000 jobs and bringing unemployment rates across the region down even further. The San Jose metropolitan region added 1,800 jobs, Oakland and the greater East Bay added 3,100, while the San Francisco metropolitan region led the pack with an additional 6,400 jobs. Across the nine-county Bay Area, the region added a total of 13,600 jobs, a significant increase from November’s gain of 7,400 jobs. However, despite finishing the year out strong, these figures could be seen as deceiving, with the majority of recently announced layoffs being excluded from these figures until they officially take effect in the coming months.
Recently announced layoffs not yet included in regional job totals
Despite strong growth region-wide, layoffs at technology companies that have been widely reported in the news have mostly yet to take effect and are therefore not included in regional job data. Alphabet, Lyft, Meta, Stripe, and Twitter have all announced large-scale reductions in headcounts in the previous months. State WARN Act filings show reductions at Meta Platforms and Twitter Inc., some of the largest cuts in the region, took effect just this month and therefore will not show up in the data until February’s release at the earliest. Meanwhile Alphabet, which today announced plans to reduce its global workforce by 12,000 (or 6%), has yet to even file a notice with the State.
Where do we go from here?
So, how do we make sense of all this? Are these moves indicative of the start of a technology-led recession, or something else? For years Bay Area technology companies have relentlessly increased headcounts, citing rapid growth and competition for talent. Now, with an increased focus on profitability, many of them are discovering they may have grown too quickly. Only time will tell, but these moves could be seen as maturing companies making prudent but difficult decisions given their individual circumstances rather than the beginning of a bigger technology-led slide.
Over the next several months, nearly 13,000 layoffs are expected to take effect in the region. While this may lead to a couple of months of low or slightly negative job growth, it is unlikely to be catastrophic. Still, January figures will answer a critical question: is the Bay Area’s economy robust enough to absorb layoffs within the big technology firms, or do we all go as they do?
Bay Watch: A Weekly Look into the Bay Area Economy
January 13, 2023
Have We Really Turned the Corner on Inflation?
New data released this week by the Bureau of Labor Statistics had markets excited about easing inflation readings for the month of December. With inflation numbers down, many investors are beginning to hope that Federal Reserve interest rate hikes will slow as we move further into 2023. While the headline readings were indeed good news for overall inflation – the consumer price index for all items produced its lowest year-over-year reading (+6.5%) since 2021, and it actually declined month-over-month (-0.1%) – the underlying data shows that inflation has not disappeared.
Notably, inflation for services continues to run upward. While prices for energy and other goods have moderated as supply chain issues have resolved themselves over the course of 2022, a tight labor market has pushed wages higher – meaning the service industry must charge more to cover its costs. Inflation readings for core services (which exclude energy services) in December were up 7.0% year-over-year and they rose 0.5% month-over-month. The month-over-month increase is particularly concerning as it reverses a two-month trend of slower growth in service prices. The high inflation numbers for services also contributed to pushing the core consumer price index (excluding energy and food) to its highest month-over-month reading (+0.3%) since September 2022.
The upward pressure on service prices is a direct result of a continued mismatch between the number of available job openings and the number of people looking for work. In November, there remained over 10 million job openings in the U.S. – a number that has come down in the last 12 months, but still remains far higher than pre-pandemic levels. Federal Reserve actions in 2022 appear to have worked in moving businesses to reduce their hiring plans, but the number of job openings must continue to come down in order for service sector inflation to moderate.
Bay Watch: A Weekly Look into the Bay Area Economy
December 9, 2022
Data released by the Bureau of Economic Analysis on Thursday provided a new reason to be optimistic about the region’s economic recovery. In 2021, San Francisco County grew its contribution to Gross Domestic Product at the fastest rate of any county in the nation – posting a 14.0% year-over-year growth rate. Santa Clara (13.3%) and San Mateo (12.9%) counties were not far behind, with Travis County (11.6%) – home of Austin, Texas – coming in fourth.
The region’s one-year growth from 2020 to 2021 was impressive on its own, but overall GDP growth since the onset of the pandemic also places Bay Area counties at or near the top of the list. Santa Clara County is the fastest growing county in the nation since 2019, trailed by San Francisco County, Travis County, San Mateo County, and King County (Seattle). No other county in the U.S. posted growth rates comparable to these five counties, which showcases the impact that the tech economy has on overall economic output. Through 2021, tech companies continued to create high-value outputs, while growing wages and employment at rapid pace – even while much of the work took place remotely.
Bay Watch: A Weekly Look into the Bay Area Economy
December 1, 2022
The Bay Area continues to lead the nation in home values.
The Nine-County Bay Area – comprised of Alameda, Contra Costa, Marin, Napa, San Francisco, San Mateo, Santa Clara, Solano, and Sonoma counties, and 101 municipalities – is home to the most expensive housing market in the country. The combination of high demand and limited inventory due to having one of the lowest per capita housing production rates in the country continues to contribute to the housing affordability crisis in the region. Even though homes in the Bay Area continue to sell for record setting levels, the housing market continues to shift away from the buying frenzy experienced during the pandemic. According to the California Association of Realtors, home sales in the Bay Area declined 37.3 percent in October 2022 when compared to the same month last year. As mortgage rates increase (currently 7% in California), home buyers and sellers alike are becoming more discouraged.
The San Francisco metro, which comprises Alameda, Contra Costa, San Francisco, San Mateo, and Marin counties, and San Jose metro areas, which comprises of Santa Clara and San Benito counties, continue to have the highest home values in the nation, followed by Los Angeles, San Diego, and Seattle.
Home values in metro areas across the U.S. have grown at a significantly higher rate over the last year when compared to San Jose and San Francisco metro areas, which have grown at 6.3% and 3.4%, which are the lowest across comparable metro areas. Metro areas located in Florida – including Miami, Orlando, and Tampa – have experienced the largest annual growth in home values from the previous year.
Taking a deeper look at Bay Area cities and counties
In May 2022, Bay Area home values reached their peak during the pandemic as interest rates remained low and buyers would offer hundreds of thousands over the asking price. Since then, there has been a cooling off across almost every county, except Sonoma, which has experienced steady increases since October 2021. San Francisco County was the only county to have an annual decline in home prices.
Taking a more granular look at cities in the Bay Area illustrates an interesting picture. While home values have increased from last year, some cities have started to see a decline in home prices.
The biggest declines occurred in cities on the Peninsula and in the South Bay. San Francisco, Castro Valley, and Palo Alto saw the greatest decline in their home values from the pandemic peak in May. San Francisco’s home values have dropped 7.6% from May, down from $1.58 million. San Francisco, Palo Alto, San Jose, and other core cities have been greatly impacted by the COVID-19 pandemic as many workers have been working remotely and are not yet back in the office regularly.
Bay Watch: A Weekly Look into the Bay Area Economy
November 22, 2022
Happy Thanksgiving from the Economic Institute! This week, as millions of Americans look forward to gathering with friends and family for turkey day, inflation and cost pressures weigh heavily on the evening’s budget. The turkey is the centerpiece of a traditional American Thanksgiving and a staple purchase for the meal. So, how much are Americans spending this Thanksgiving?
The American Farm Bureau Federation’s annual Thanksgiving dinner price survey estimates the average cost of classic Thanksgiving foods for a family of 10. The price calculations are adjusted to reflect the amount of the ingredient necessary for a family of 10 to consume and have leftovers. The AFBF’s calculation averages the cost of 12 staple ingredients, including the turkey, and has reached an all-time high of $64.05. This cost demonstrates a significant increase from $17.15 just two years earlier in 2020.
Turkey prices, which increased 21% in just the last year, have historically fluctuated due to a myriad of factors like inflation, supply, and demand. According to a recent New York Times article, suppliers of the famous bird are facing a variety of challenges this year that are driving up prices. A global inflation surge means farmers are paying a lot more for agricultural supplies and labor, which are already in short supply. According to the Department of Agriculture, an avian flu outbreak has been another factor contributing to a declining supply of turkeys nationwide, killing about 7.3 million in 2022 (or 3.6% of all turkeys). Given these pressures on the national turkey supply, turkeys are more expensive and elusive than they have ever been. Households could be paying twice as much for a turkey in 2022 as they did in 2021, meaning many may have to forgo the iconic bird this year.
The AFBF annually tracks individual prices for 12 staple Thanksgiving items. From 2021 to 2022, every single item tracked experienced significant price increases. While the bag of cubed stuffing mix stands out with a 69% increase, more than half of the items saw at least a 20% increase over the past year. These price increases are not surprising considering the rates of inflation experienced by Americans over the past year and appears to be a symptom of a larger cost pressures. Thanksgiving may be more expensive than ever, but time with family and friends is still free.
The Economic Institute continues to track national trends and any unique economic impacts in the Bay Area. Stay tuned for more economic updates in next week's Bay Watch.
Bay Watch: A Weekly Look into the Bay Area Economy
November 18th, 2022
October job growth ticks up
Despite continuing widespread fears an economic downturn is around the corner, the region’s three major metros posted their strongest job growth since July while September’s figures were revised upwards. The San Jose metropolitan region added 5,500 jobs, Oakland and the greater East Bay added 4,400, while the San Francisco metropolitan region led the pack with an additional 6,300 jobs. Across the nine-county Bay Area, the region added a total of 17,600 jobs, a significant increase from September’s modest gain of 2,300 jobs. Professional and Business Services, Private Educational and Health Services, and Trade, Transportation and Utilities led the way. Leisure and Hospitality also posted a notable increase across all three regions.
Major layoffs continue in the technology sector
Despite strong growth region-wide layoffs at technology companies continued this week, following last week’s news that many major technology companies were reducing headcounts significantly, some for the first time ever. Lyft, Meta, Stripe, and Twitter all announced large-scale reductions in headcounts last week, fueling speculation the region could soon be facing a technology-led downturn. Meta Platforms made the largest cut in the region, announcing it was laying off 13 percent of its workforce, or more than 11,000 individuals, following months of declining market value. Lyft and Stripe reduced their headcounts 13 and 14 percent respectively. Meanwhile, Twitter has reduced its workforce by an astonishing 50 percent or more amid a sudden change in ownership.
Where do we go from here?
So, how do we make sense of all this? Are these moves indicative of the start of a technology-led recession, or something else? For years Bay Area technology companies have relentlessly increased headcounts, citing rapid growth and competition for talent. Now, with an increased focus on profitability, many of them are discovering they may have grown too quickly. Only time will tell, but these moves could be seen as maturing companies making prudent but difficult decisions given their individual circumstances rather than the beginning of a bigger technology-led slide.
November figures will answer a critical question: is the Bay Area’s economy robust enough to absorb layoffs within the big technology firms, or do we all go as they do?
Bay Watch: A Weekly Look into the Bay Area Economy
November 2nd, 2022
This week’s Baywatch highlights the Economic Institute’s latest report on the economic benefits of multilingual learning, filling a gap in the literature by providing a connection between multilingual programs and the economy. By making the economic case for bilingualism and in turn multilingual programs, this analysis can be used alongside previous analyses to advocate for an increased focused on the importance of educational outcomes for not just English proficiency but multilingual learning.
California is home to nearly a quarter of the nation’s foreign-born population
The foreign-born population is larger in California than any other state or the United States at large, and multilingual children represent 40% of the state’s public-school enrollment, a number that only continues to grow among the state’s youngest children. Unlike programs that have traditionally pushed students to learn English above all else, programs designed to support students’ home languages in addition to English– also know as multilingual programs – are increasingly gaining support. In our report, we find that supporting multilingual learning among California’s youngest children can improve educational outcomes, boost household incomes, and give California companies the edge needed to compete on the world stage.
Bilingual educational programs typically take one of two forms: transitional and multilingual learning. Transitional bilingual programs have long been the preference for bilingual instruction. These programs are designed to temporarily support English learners’ home language as they become accustomed to English-dominant instruction. As they achieve English proficiency, native language instruction is gradually phased out of instruction. This model, therefore, does not further advance students’ home languages. Multilingual programs, on the other hand, elevate students’ home languages, enabling them to become bilingual, biliterate, and bicultural. They are also more successful at narrowing academic achievement gaps between English learners and English native students than transitional education programs.
There is a clear and growing need for a bilingual workforce
Many industry sectors and businesses are creating more and more job opportunities for bilingual individuals. What was once viewed as a deficiency is now seen as an incredible asset for interpersonal sectors engaging with local communities of non-English speakers, as well as businesses looking to interact with the global marketplace. Recent studies have shown that businesses in sectors that require interpersonal skills – such as healthcare (nursing, medical assistants, mental health counselors), leisure and hospitality, and sales – prefer to hire multilingual employees.
Using data from a labor market analytics tool that web scrapes millions of job postings each week, the chart below shows the increase of total job postings in California that requested applicants with bilingual skills from 2010 to 2020. Postings for bilingual skills nearly quadrupled from 23,000 postings to over 96,000, growing at a faster rate than postings overall.
What are the long-term implications of multilingual learning programs?
Multilingual children from low-income families perform better on a number of verbal and nonverbal tasks than their single-language counterparts, underscoring the value of investing in multilingual childhood education to raise children’s lifetime income profiles. In terms of earning potential, while we cannot quantify the difference in incomes of adults who participated in different language immersion programs as children, we can evaluate differences in income between non English-speaking households, and households that speak both English and another language at home. For the bottom 20% of earners, median earnings are mostly comparable between these two groups. As households move up the earning spectrum, however, disparities widen between linguistically isolated and non-linguistically isolated households, with a pay gap of over $100,000 for the top 20% of earners. This gap represents a rough estimate of a multilingual learner’s earning potential when given the opportunity to reach English fluency, as well as maintain speaking a non-English home language.
California has the unique opportunity to foster early language skills in its 2.4 million multilingual children by implementing more multilingual programs across the state. Critics cite early evidence of multilingual instruction as detrimental to academic success, but as our study shows, there is increasing evidence that these essential programs do not come at the cost of academic performance in other subjects. Multilingual instruction allows students to celebrate their home language while achieving English proficiency, ideally at a young age. This principal benefit is lacking in traditional bilingual programs, which prevents true multilingualism, a skill increasingly in demand across multiple industry sectors and regions.
Read the full study here: http://www.bayareaeconomy.org/report/the-economic-benefits-of-multilingual-learning/
Bay Watch: A Weekly Look into the Bay Area Economy
October 27, 2022
So far in 2022, Austin metro has produced nearly 10x as much housing on a per capita basis as San Francisco metro
So far in 2022, the San Francisco metro area has posted one of the lowest per capita housing production rates in the country, behind only Detroit and Chicago when comparing the 25 largest regions by GDP. As of August, the San Francisco metro area – which includes San Francisco, Alameda, Marin, Contra Costa, and San Mateo Counties – has permitted only 143 units of housing per 100,000 people. Nearby San Jose (Santa Clara County) permitted housing at nearly double the rate given its population size. Meanwhile, sunbelt cities like Austin and Houston, which have experienced a meteoric rise in population since the onset of the pandemic, have permitted 5-10x as much housing as San Francisco on a per capita basis.
As Austin’s population grows astronomically, the city has made an active effort to preserve existing affordable housing by repairing and upgrading 1,550 units of affordable housing, according to their strategic housing plan updates. Meanwhile in San Francisco, permitted units from previous years could still break ground, but developers are hesitant, as the cost to build new housing has outpaced revenues that can be generated through rents or sales.
While the San Francisco metro area lags peer regions, California has already permitted more housing in 2022 than any year since 2006. While this increase in permitting represents a move in the right direction, California is still far behind its historic housing production. Even if 2022 represents the top of the state’s housing cycle, local governments are still permitting far below historic averages – averaging 90,000 units permitted per year since 2006 versus 205,000 from 1955 to 1989. To meet the state’s housing affordability need, California would need to double its production, building 180,000 new units of housing per year.
So, what are the implications of gross underproduction of housing?
Principally, one of the worst affordability crises in the country, creating conditions that have pushed lower income households to locations further from job centers or out of the region or state entirely. Now, with rapidly rising interest rates, homebuyers in the state are simply choosing to live elsewhere as their purchasing power has substantially diminished. In a supposedly progressive state, outcomes have been remarkably regressive. Median home sales prices in the San Francisco and San Jose metro areas are nearly $1 million higher than median prices in Austin. In fact, of the top 25 largest metro areas, the four most expensive regions are all in California.
A lack of production permeates the rental market as well, with San Francisco ranking as the second most expensive city for 2-bedroom rentals in the United States according to a recent October 2022 Zumper National Rent Report. The median price for a two-bedroom apartment in San Francisco for October was $4,060, only surpassed by rental prices in New York City.
Bay Watch: A Weekly Look into the Bay Area Economy
October 21, 2022
Bay Area loses jobs for the first time since January 2021
New employment data released today by the California Employment Development Department (EDD) show that the Bay Area lost jobs for the first time since early 2021. From August 2022 to September 2022, the Bay Area lost 600 jobs, signaling that the region’s sluggish recovery may be over. Counterintuitively, all three of the region’s major metros also posted lower unemployment rates, reflecting a shrinking labor force across the region as citizens either leave the region entirely or drop out to retire, care for children, or care for themselves.
Within the region, San Francisco and its immediate surrounds saw the greatest losses, while Silicon Valley saw modest gain of 600 jobs. According to data from Beacon Economics, tech companies added 4,200 jobs in the Bay Area, mostly driven by Santa Clara, San Mateo and San Francisco counties. At the same time, vacancy rates remain high and businesses continue to shutter across major business districts, which has lead to a loss of 5,000 jobs in the region’s leisure and hospitality industry (which includes hotels, restaurants, drinking establishments, arts, entertainment).
What's next?
Looking ahead, these numbers may decline even further. Meta, for the first time in its 18-year history announced plans to reduce its staff in 2023. Other large tech companies have also announced hiring freezes or layoffs. Companies are reluctant to grow their workforce amid the Federal Reserve raising interest rates by three-quarters of a percentage point for a third straight time. The Fed has also signaled that borrowing costs would continue to rise this year as they attempt to curb inflation.
The Economic Institute will continue to track national trends and any unique economic impacts in the Bay Area. October jobs numbers will be released November 18th.
Bay Watch: A Weekly Look into the Bay Area Economy
October 13, 2022
Recent analysis by the Bay Area News Group reported that for the first time in at least twenty years, Los Angeles County’s per capita transit ridership surpassed the Bay Area’s. The two major metropolitan areas have historically differed in their approach to transit – in fact, in 2019, Bay Area residents took forty-three million more public transit trips than L.A. residents despite L.A.’s larger population. However, post-pandemic, the Bay Area’s public transit ridership recovery continues to lag, leading to L.A. riders taking eighty-three million more transit trips than the Bay Area in 2021.
Each month, we track Bay Area transit ridership compared to traffic volumes across the region’s bridges. We analyze BART, Caltrain, and WETA Ferry ridership as a share of pre-pandemic ridership. Last month’s data show that Caltrain has recovered just 29% of its pre-pandemic ridership. BART ridership has demonstrated a slightly stronger ridership recovery, reaching an all-time high of pre-pandemic ridership last month at 41%. WETA Ferry ridership experienced the greatest decline in ridership at the peak of the pandemic, dropping to 1% ridership in April 2020. Now, ferry ridership boasts the largest ridership recovery at 62%.
Bay Area transit ridership trails bridge traffic recovery as many continue to drive rather than take transit to work
As transit ridership makes a slow recovery, traffic volumes tell a different story. At the peak of the pandemic, toll tags across all seven state-owned toll bridges fell to only 51% of their pre-pandemic levels. Since then, bridge crossings have remained largely between 80-95% of their pre-pandemic levels. As of last month, bridge crossings across all bridges are at 92%, illustrating that people who are commuting are choosing to drive alone or carpool, rather than take transit. And while remote work initially appeared a temporary solution, many Bay Area workers never returned to the office and do not plan to. According to a recent September 2022 poll of employers conducted by the Bay Area Council, 44% of those surveyed reported downsizing or consolidating office space following the pandemic and 73% of respondents reported their employees currently come in three or less days a week. Employers also reported that of their employees who come into the office, an estimated 30% take public transit compared to 51% pre-pandemic.
The Economic Institute continues to track national trends and any unique economic impacts in the Bay Area. September jobs data for California and its regions will be available on October 21.
Bay Watch: A Weekly Look into the Bay Area Economy
October 7, 2022
Economic growth slows – is a recession next?
New data released this week by the Bureau of Labor Statistics showed some of the first signs that the Federal Reserve’s interest rate hikes have finally impacted the labor market. While employment and job posting data remained relatively solid in the face of ongoing inflation pressures and interest rate uncertainty, a downward trend in employment likely foreshadows a fourth quarter of limited growth in the U.S.
The U.S. added 263,000 jobs in September – well below the 450,000 jobs that had been added on average during the first six months of 2022.
Even with a slowdown in hiring, the labor market remains extremely tight. Wages grew by 5% month-over-month, and labor force participation fell slightly – a possible result of the start of the school year and more limited seasonal employment opportunities.
A forward-looking metric, job postings, also produced a downward trend in the most recent data available. US job openings in August totaled 10 million after nearly reaching 12 million in the early part of the year. Even with this decline, the 10 million openings are well above pre-pandemic levels with many employers still struggling to fill open positions.
With numerous large Bay Area employers announcing hiring freezes or layoffs in recent weeks, the region has already experienced a steep drop in its employment growth. In August, the nine-county region added just 4,400 jobs – its worst monthly job performance in 12 months.
The Economic Institute will continue to track national trends and any unique economic impacts in the Bay Area. September data for California and its regions will be available on October 21.
Bay Watch: A Weekly Look into the Bay Area Economy
September 21, 2022
New data reveal number of Bay Area residents primarily working from home nearly quintupled from 2019 to 2021
New data released last week from the U.S. Census Bureau show that 46% of San Franciscans (aged 16+) worked from home in 2021, a nearly 40 percentage point increase since 2019. The data come from the 2021 American Community Survey, an annual survey of 3.5 million households across the nation and reflect home locations, not work locations, of residents who worked from home as their primary form of commuting.
In 2019, 260,000 residents in the Bay Area worked primarily from home, in 2021, that number skyrocketed to 1.2 million, a nearly 5 fold increase. Of all major metro regions in the U.S., the Bay Area saw the second largest increase. The Bay Area’s 4.7x increase trailed only the DC region (5.1x) and was ahead of the Seattle Puget Sound region (4.5x). Southern California counties such as Los Angeles, Orange, and San Diego all ranked significantly lower than the Bay Area with around 20-22% of their residents working from home. Of all California counties with available data, the top 5 with the highest work from home shares are all in the Bay Area:
- San Francisco: 46%
- Marin: 36%
- Santa Clara: 36%
- Alameda: 35%
- San Mateo: 33%
By comparison, only 21% of California as a whole worked from home in 2021, and only 18% of people nationwide worked from home in 2021. Explore the interactive maps below to see how much the largest counties in California increased their work from home shares:
Suburban residents are more likely to work from home than city-dwellers
On a municipal level, suburban residents were far more likely to work from home in 2021 than bigger city dwellers. Many people who work in a city live outside it, so for big cities with high levels of remote eligible industries (like government and tech) such as Washington D.C., Seattle, and San Francisco, the suburbs that surround them saw massive increases in residents working from home. In fact, eight of the top ten municipalities were suburbs outlying one of these three cities. Due to the prevalence of tech jobs in San Francisco and Seattle, and the prevalence of government jobs in D.C., these regions saw higher remote work eligibility than other places. On the flip side, in big cities in California's Central Valley such as Fresno and Bakersfield, only 11-12% of residents primarily worked from home, illustrating a massive socioeconomic divide between coastal high-tech cities and the suburbs that surround them, and central in-land cities with higher shares of in-person working class jobs.
California counties with higher incomes saw higher shares of remote work in 2021
Those who work in cities but live in the suburbs are also more likely to earn more than those who both live and work in the city. The correlation between high household incomes and the share of residents primarily working from home is strong and clear. Unlike San Francisco or Silicon Valley, counties with lower median household incomes such as Imperial, Merced, and Kings County saw the lowest rates of remote work among residents in 2021.
Bay Watch: A Weekly Look into the Bay Area Economy
September 13, 2022
The COVID-19 pandemic has had detrimental effects on the international economy, in particular foreign direct investments (FDI), which are substantial, lasting investments made by a company or government into a foreign country to acquire a substantial stake in a foreign business. Even with the global decline in FDI, California remains the largest recipient in the nation, followed by Massachusetts and New York. FDI in the Bay Area and the state plays an important role in catalyzing job growth, igniting innovation, increasing productivity, generating additional exports for the state’s economy, and promoting American competitiveness. The economic importance of the Bay Area, and California at large, remains the forefront of America’s recovery process. In this installment of Bay Watch, we take a deeper look into foreign direct investment in the Bay Area.
FDI in the Bay Area
Annual FDI in the San Francisco Bay Area has experienced a significant decline in the wake of the COVID-19 pandemic. After a booming year in 2019, FDI into the Bay Area has experienced a reduction in deals and investments, falling from $2.3 billion (98 deals) in 2019 to $897.1 million (62 deals) in 2020. In 2021, FDI experienced another decline in deals and investments. Through the first six months of 2022, FDI in the Bay Area is on track to be the lowest amount of in recent history.
FDI by County
The Bay Area is a major recipient of global capital and a top investor around the world. Prior to the pandemic, foreign investors invested into seven of the nine Bay Area counties, excluding Marin and Solano counties. Of the seven counties that received FDI in the Bay Area, San Francisco (42.8%), Santa Clara (30.8%), and Alameda (20.8%) counties received the largest percent of FDI in 2019.
While the global economy continues to recover from the pandemic, foreign investors have concentrated their investments into four Bay Area counties including San Francisco, Santa Clara, Alameda, and San Mateo. Santa Clara County led the Bay Area counties in FDI in 2021 with $421.8 million, overtaking San Francisco County with 47.6% of the total market share. The entire North Bay did not receive any FDI in 2021, which may have adverse impacts in the future.
FDI by Sector in the Bay Area
Investments into different sectors in the Bay Area has fluctuated of the years. Prior to the pandemic, investments into the Bay Area were spread across a diverse array of sectors including Consumer Goods, Tourism, Energy, and Wood, Apparel, and Related Products. The region’s top sectors for investment were ICT and Electronics ($804.9 million; 34.4%), Creative Industries ($385.6 million; 16.5%), and Retail Trade ($314.0 million; 13.4%).
In 2021, investors concentrated their investments to a more condensed list of sectors detailed in the chart below. ICT and Electronics remained the largest recipient of FDI and dominated the market share with $440.1 million, nearly 50% of total FDI in the region. Agribusiness and Life Sciences received the second and third largest investments with $84.6 million (9.5%) and $76.1 million (8.6%), respectively.
What does the future hold?
While there has been a significant decline of FDI in the Bay Area, there remains hope that the region will bounce back to pre-pandemic levels in the years to come. Investors have tightened their wallets while simultaneously concentrating their investments heavily into the ICT and Electronics sector and four counties in the Bay Area. The San Francisco Bay Area, and California at large, has strong track records when it comes to attracting FDI, and will need to retain its high standing among foreign investors as the region and state continues to recover from the COVID-19 pandemic.
Bay Watch: A Weekly Look into the Bay Area Economy
September 6, 2022
It’s been two and half years since the onset of the COVID-19 pandemic, and many businesses in San Francisco have struggled to stay afloat amidst new variants, shutdowns, and a shift to remote work. Throughout the pandemic, the spotlight has been on downtown activity as a measure of the city’s economic health and vitality – but how much worse is downtown faring in terms of business starts and closures? Are trends downtown representative of the city at large, or are other neighborhoods bolstering the city’s business activity?
A north/south divide
Since March 2020, over 27,000 businesses (or 10% of pre-pandemic businesses) of all sizes have closed across the City of San Francisco, based on real time data from the Office of the Treasurer and Tax Collector, which tracks businesses that are registered and pay taxes to the city. The Financial District has taken the biggest hit, accounting for nearly 20% of the city’s overall business closures. For every business that closed in the Financial District, less than half of one business opened (in other words, 2.2 businesses closed for every 1 business that opened). The city overall fared better, as 0.81 business openings for every business closure, largely attributable to the city’s southern-most neighborhoods such as Bayview/Hunter’s Point, Visitacion Valley, Excelsior, Portola, and Oceanview/Merced/Ingleside, all of which saw more business openings than closures during the pandemic.
Compare these trends to pre-pandemic patterns from 2018 and 2019, when 75% of the city’s neighborhoods saw more openings than closures. While growth in the Financial District was not nearly as fast as growth in other parts of the city, downtown San Francisco still experienced slightly more business openings than closures, keeping its net growth in businesses above zero.
Restructuring away from downtown and towards smaller community hubs
On the surface it may appear that the pandemic initiated a restructuring of business away from downtown and toward southern neighborhoods and community hubs. While this is partially true, this trend started long before the pandemic. In 2010, new business openings in downtown and its surrounds comprised nearly 30% of all openings citywide. Over time, this share dwindled, hitting 23% in 2019 and declining another 4 percentage points since the onset of the pandemic. The city’s southernmost neighborhoods, on the flip side, saw the inverse effect, comprising only 11% of new business openings in 2010, growing steadily and hitting an all-time high of 16% in 2022.
Heading in the right direction
So far in 2022, the city is seeing more business openings to closures, with a higher ratio than in years leading up to the pandemic. As businesses and employees alike enter an age of remote work, residential neighborhoods are seeing an uptick in business activity and commercial vitality, compensating for the decline in new businesses in and around downtown. Thus far in 2022, 1.23 businesses have opened across San Francisco for every business that has closed.
The overall number of new businesses is still far below what it was pre-pandemic. In 2019 from January to August, San Francisco saw 10,168 new businesses open, compared to 6,502 for the same months in 2022. However, factoring in the number of business closures, the city is still netting a higher number of new businesses (1,195 so far this year versus 1,047 for the same period in 2019). While we may see fewer businesses open than the historic average, we’re also seeing far fewer closures.
Bay Watch: A Weekly Look into the Bay Area Economy
August 30, 2022
In 2017, the Economic Institute issued a report highlighting the impact of the region’s housing crisis not only on residents, but on local ecosystems and the climate as a whole. Bay Area Balance estimated that California was significantly off track to meeting its ambitious climate goals by 2030, in large part by failing to address its housing crisis. Five years later, our region (and state) is no closer to housing everyone who desires to live here, and as a result is exporting tens of thousands of its residents to other states—states with much higher carbon footprints.
In many ways, the American dream has thrived in the Bay Area. Our economy regularly grows at rates more comparable to China’s than the U.S.’s, high-paying jobs are plentiful, and entrepreneurs from around the world dream of starting or moving their businesses here. However, the median price of a single-family home in San Francisco is now over $1.5 million, and the Bay Area Council’s annual poll routinely reports that nearly 50% of the region’s residents eventually plan to leave. The COVID-19 pandemic pushed many to take the plunge.
Over one billion pounds of additional CO2 were produced by households that left California
The latest estimates from the IRS show tens of thousands of California residents relocated to Texas, Colorado, Idaho, and other lower-cost states from 2019 to 2020 and pushed California’s growth rate into the negative for the first time in 170 years. Population loss surely won’t be good for the state’s economy, but it will also have significant impacts for our climate. California has the lowest carbon intensity in the nation – a measure of how much carbon is produced by the average household – and therefore each household that moves to another state means a two or even threefold increase in greenhouse gas emissions. While these figures do not take into account a household’s transportation-related emissions, they offer the most comprehensive estimate of carbon emissions from residential energy use. If our region, and state, are as serious as they claim to be about climate change, it’s time to get serious about the housing crisis.
While one billion additional pounds of CO2 may sound like a lot – and certainly every pound counts – it pales in comparison to California’s, and even the Bay Area’s, transportation footprint. Bay Area drivers log an astonishing 172 million miles a day in their vehicles. Assuming the average vehicle gets 25 miles to the gallon, and a gallon of gasoline produces 20 pounds of CO2, our region produces roughly one billion pounds of CO2 in just over a week’s time (7.1 days). California and the Bay Area may have had early success in establishing a relatively clean mix of grid power, but we have a long way to go before completely cleaning up our own footprint.
Bay Watch: A Weekly Look into the Bay Area Economy
August 24, 2022
In the last few weeks, Bay Watch has analyzed several different metrics that compare our region’s economic recovery with other metropolitan areas across the country. Our focus thus far has been on San Francisco. By almost every metric, San Francisco’s recovery is lagging the rest of the nation.
Other parts of the region share San Francisco’s problems to some extent, but there are interesting dynamics at play along the Peninsula and down to San Jose that put a new twist on a regional recovery story that to this point has been almost singularly focused on San Francisco. In this week’s edition of Bay Watch, we look at what is driving the differing economic experiences in San Francisco, San Mateo, and Santa Clara counties with a deeper look at the office economy.
The office market looks vastly different in San Francisco when compared to job centers in San Mateo and Santa Clara counties. In San Francisco, the office vacancy rate sits at 24.2% as of the second quarter of 2022 according to CBRE, and net absorption has been negative for 10 straight quarters—meaning that more space is coming onto to the market via sub-leasing compared to new lease activity. In San Jose, the office vacancy rate is 12.4% with net absorption moving positively in four of the last five quarters. In San Mateo County, three straight quarters of positive net absorption have brought the vacancy rate down to 11.5%.
Downtown San Francisco’s day-time population problem is much larger than San Jose’s. New research out of UC Berkeley uses cell phone tracking data at downtown points of interest to measure economic activity by both workers and visitors. Out of the 62 downtown areas studied across North America, San Francisco placed last with just 31% of its pre-pandemic activity. Downtown San Jose was 43rd out of 62 with 50% of its pre-pandemic activity.
Commute times are a major influencer of downtown activity. When surveyed on the benefits of remote work, employees almost always cite commute time savings as the number one answer. As such, it stands to reason that cities with broader commute sheds would have more trouble attracting employees back to an office. Longer commute times for San Francisco office workers are at least partially to blame for the city’s slower recovery. Of workers employed in the professional, scientific, and technical services sector in San Francisco pre-pandemic, just 45% had “easy commutes”—defined here as under 30 minutes. Moving down the Peninsula, the percentage of easy commutes grows to 51% for San Mateo County workers in professional services and 60% for Santa Clara County office workers.
San Francisco’s office employers are performing quite well, but the jobs they’re creating may not be physically present in the city. According to the Bureau of Labor Statistics, sectors that predominantly make up the office sector—professional services, information, and finance—have fully recovered their employment levels across the region. For companies that process payroll though a San Francisco or San Mateo County address (together making up the San Francisco Metropolitan District), employment in these three categories is up more than 8% in July 2022 when compared to July 2019. For companies processing payroll through a Santa Clara County address, employment is up only 6%. While remote work makes it difficult to understand the physical location of these jobs, the data does clearly show that these sectors are performing better in San Francisco than in San Jose.
Bay Watch: A Weekly Look into the Bay Area Economy
August 16, 2022
Last week, we highlighted San Francisco’s difficult road to recovery. Two years and five months after shelter-in-place orders were first implemented, the city is still down over 32,000 jobs, exhibiting one of the slowest economic recoveries in the nation. Oakland and San Jose have fared slightly better but have struggled to fully recover. While San Francisco continues to be the focus of local and national press for its flagging recovery, its unemployment rate is one of the lowest in the nation and now stands at an impressive 2.1%, exactly what it was in February of 2020. So how can San Francisco be down over 32,000 jobs yet back at “full” employment?
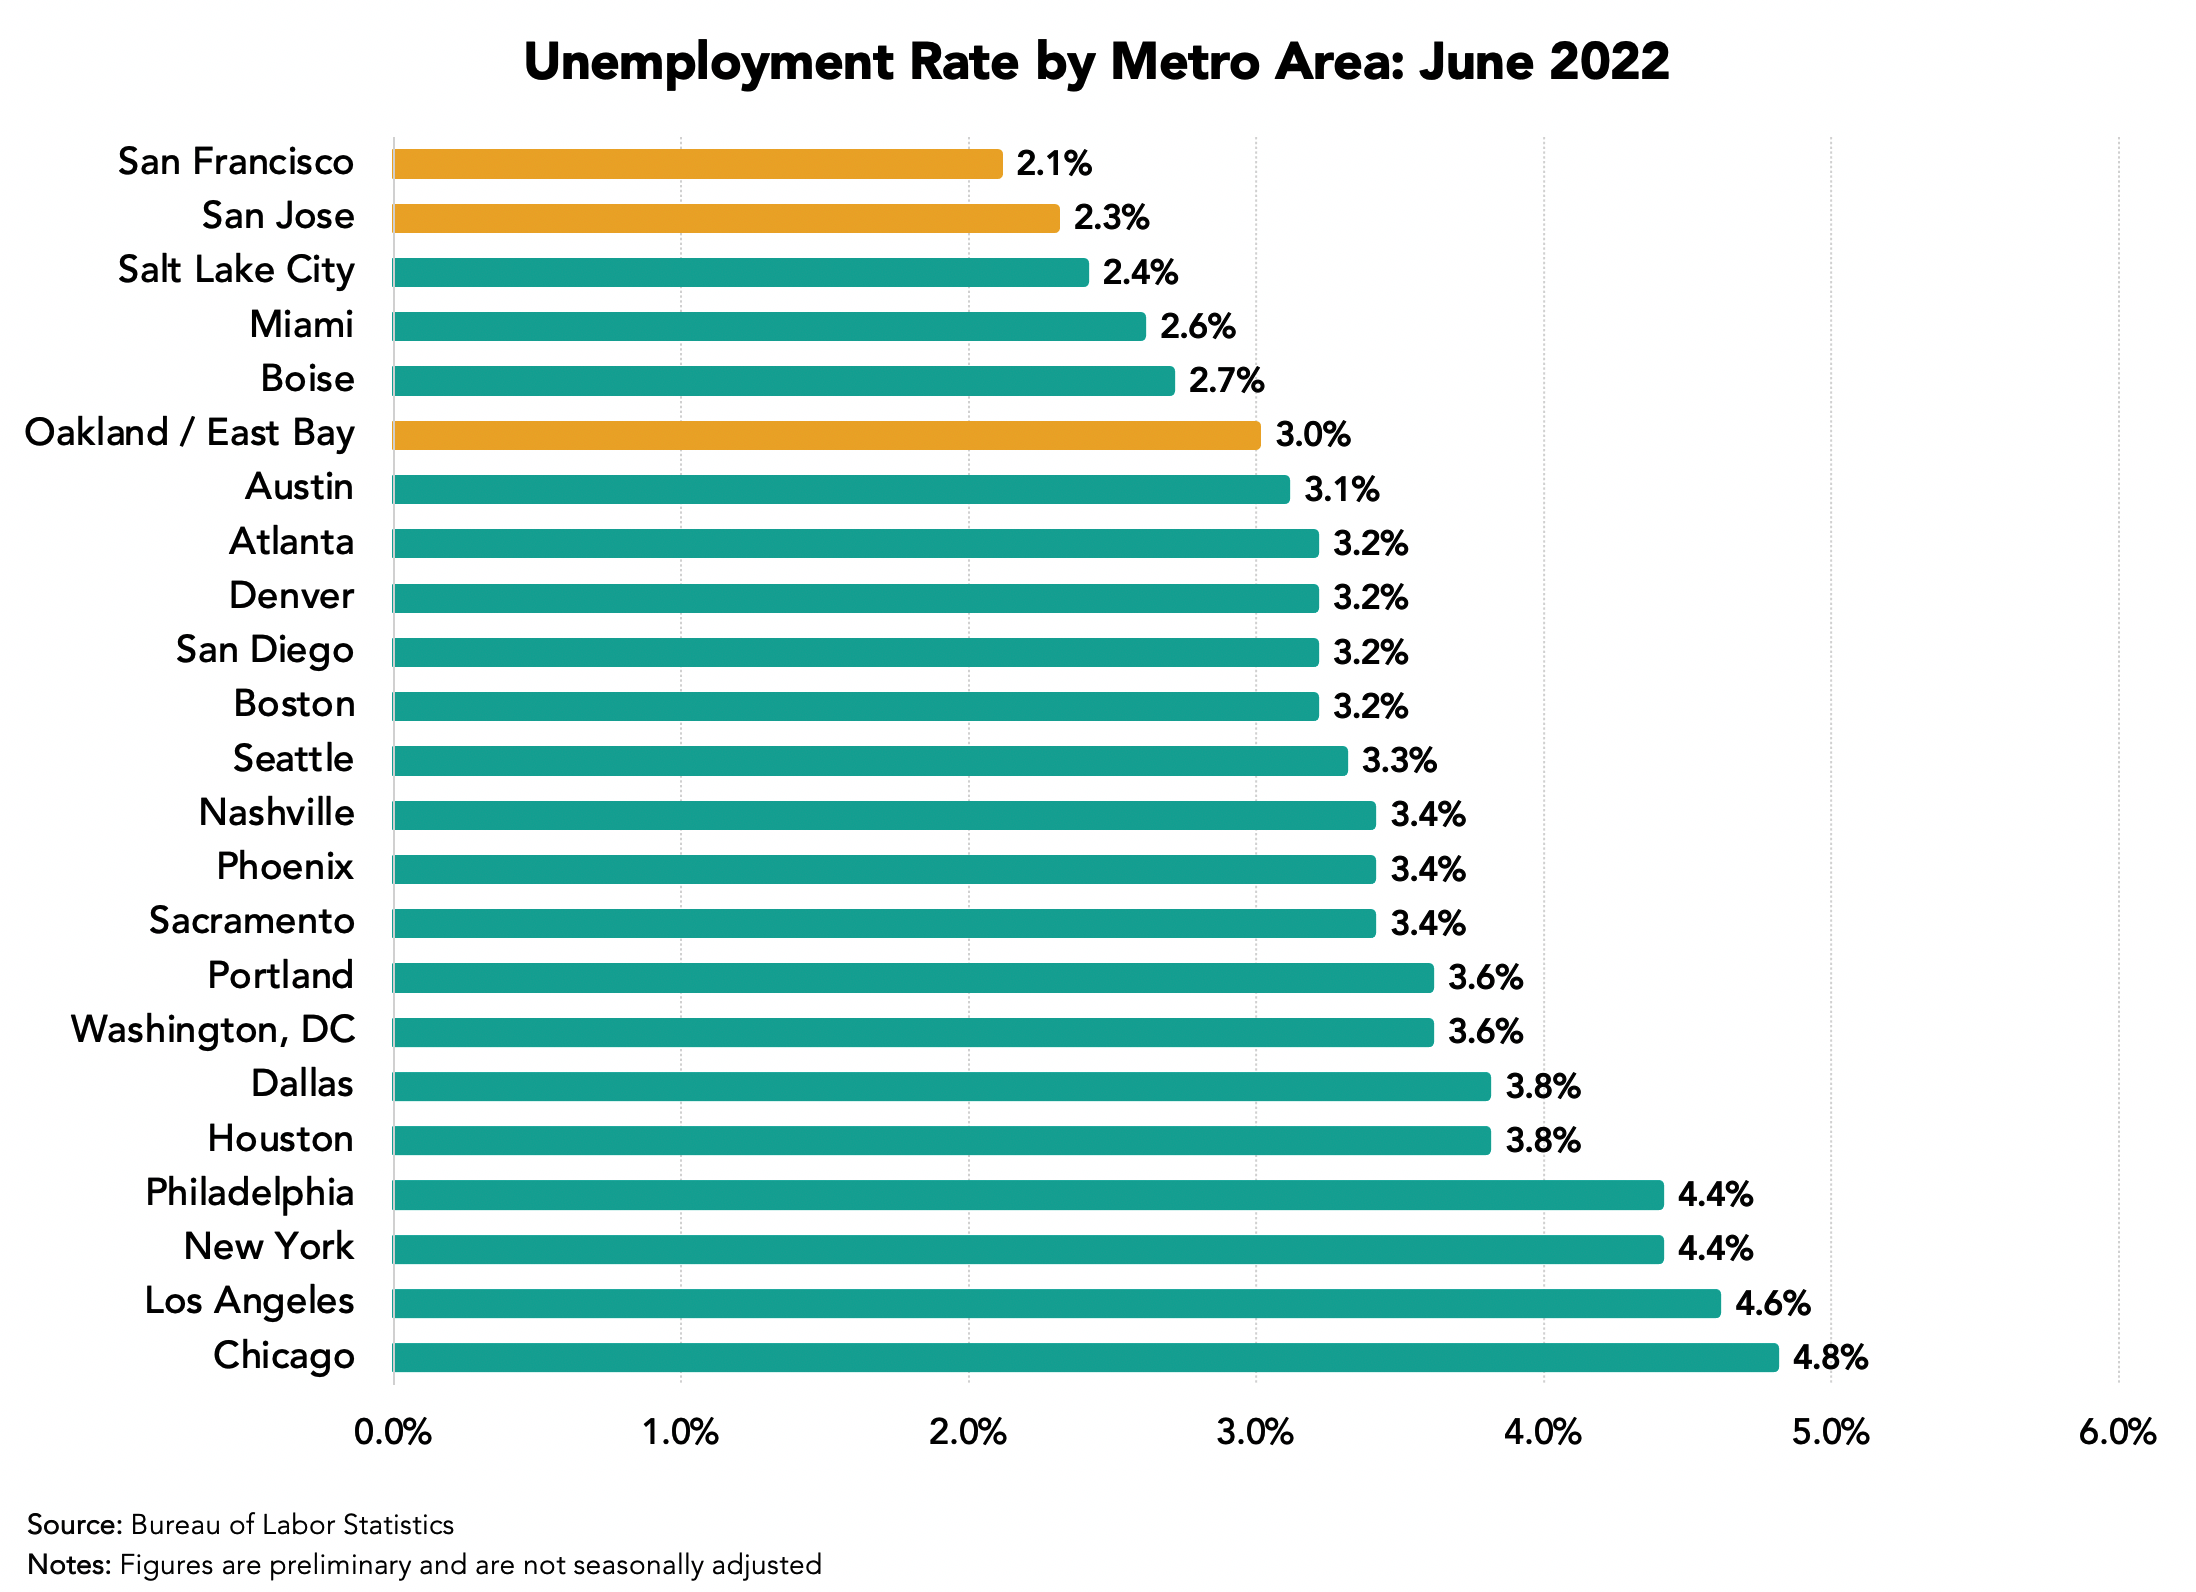
Fewer jobs, but the same unemployment rate?
The unemployment rate is the number of unemployed people as a percentage of the labor force, giving citizens and policymakers alike a quick way of gauging the health of our economy. Importantly, however, the number of unemployed only includes those actively looking for work, not the entire population of a region or even those of working age. People drop out of the labor force for a variety of reasons, including returning to school, retirement, or staying home to care for children or sick loved ones. In San Francisco’s case, nearly 43,200 individuals have chosen to leave and remain out of the labor force for one reason or another, contributing to the city’s near-record low unemployment rate but also its meager economic recovery. The story continues across the region: Oakland has experienced an even larger movement of individuals out of the labor force, losing 44,600 people, while San Jose has lost 26,200.
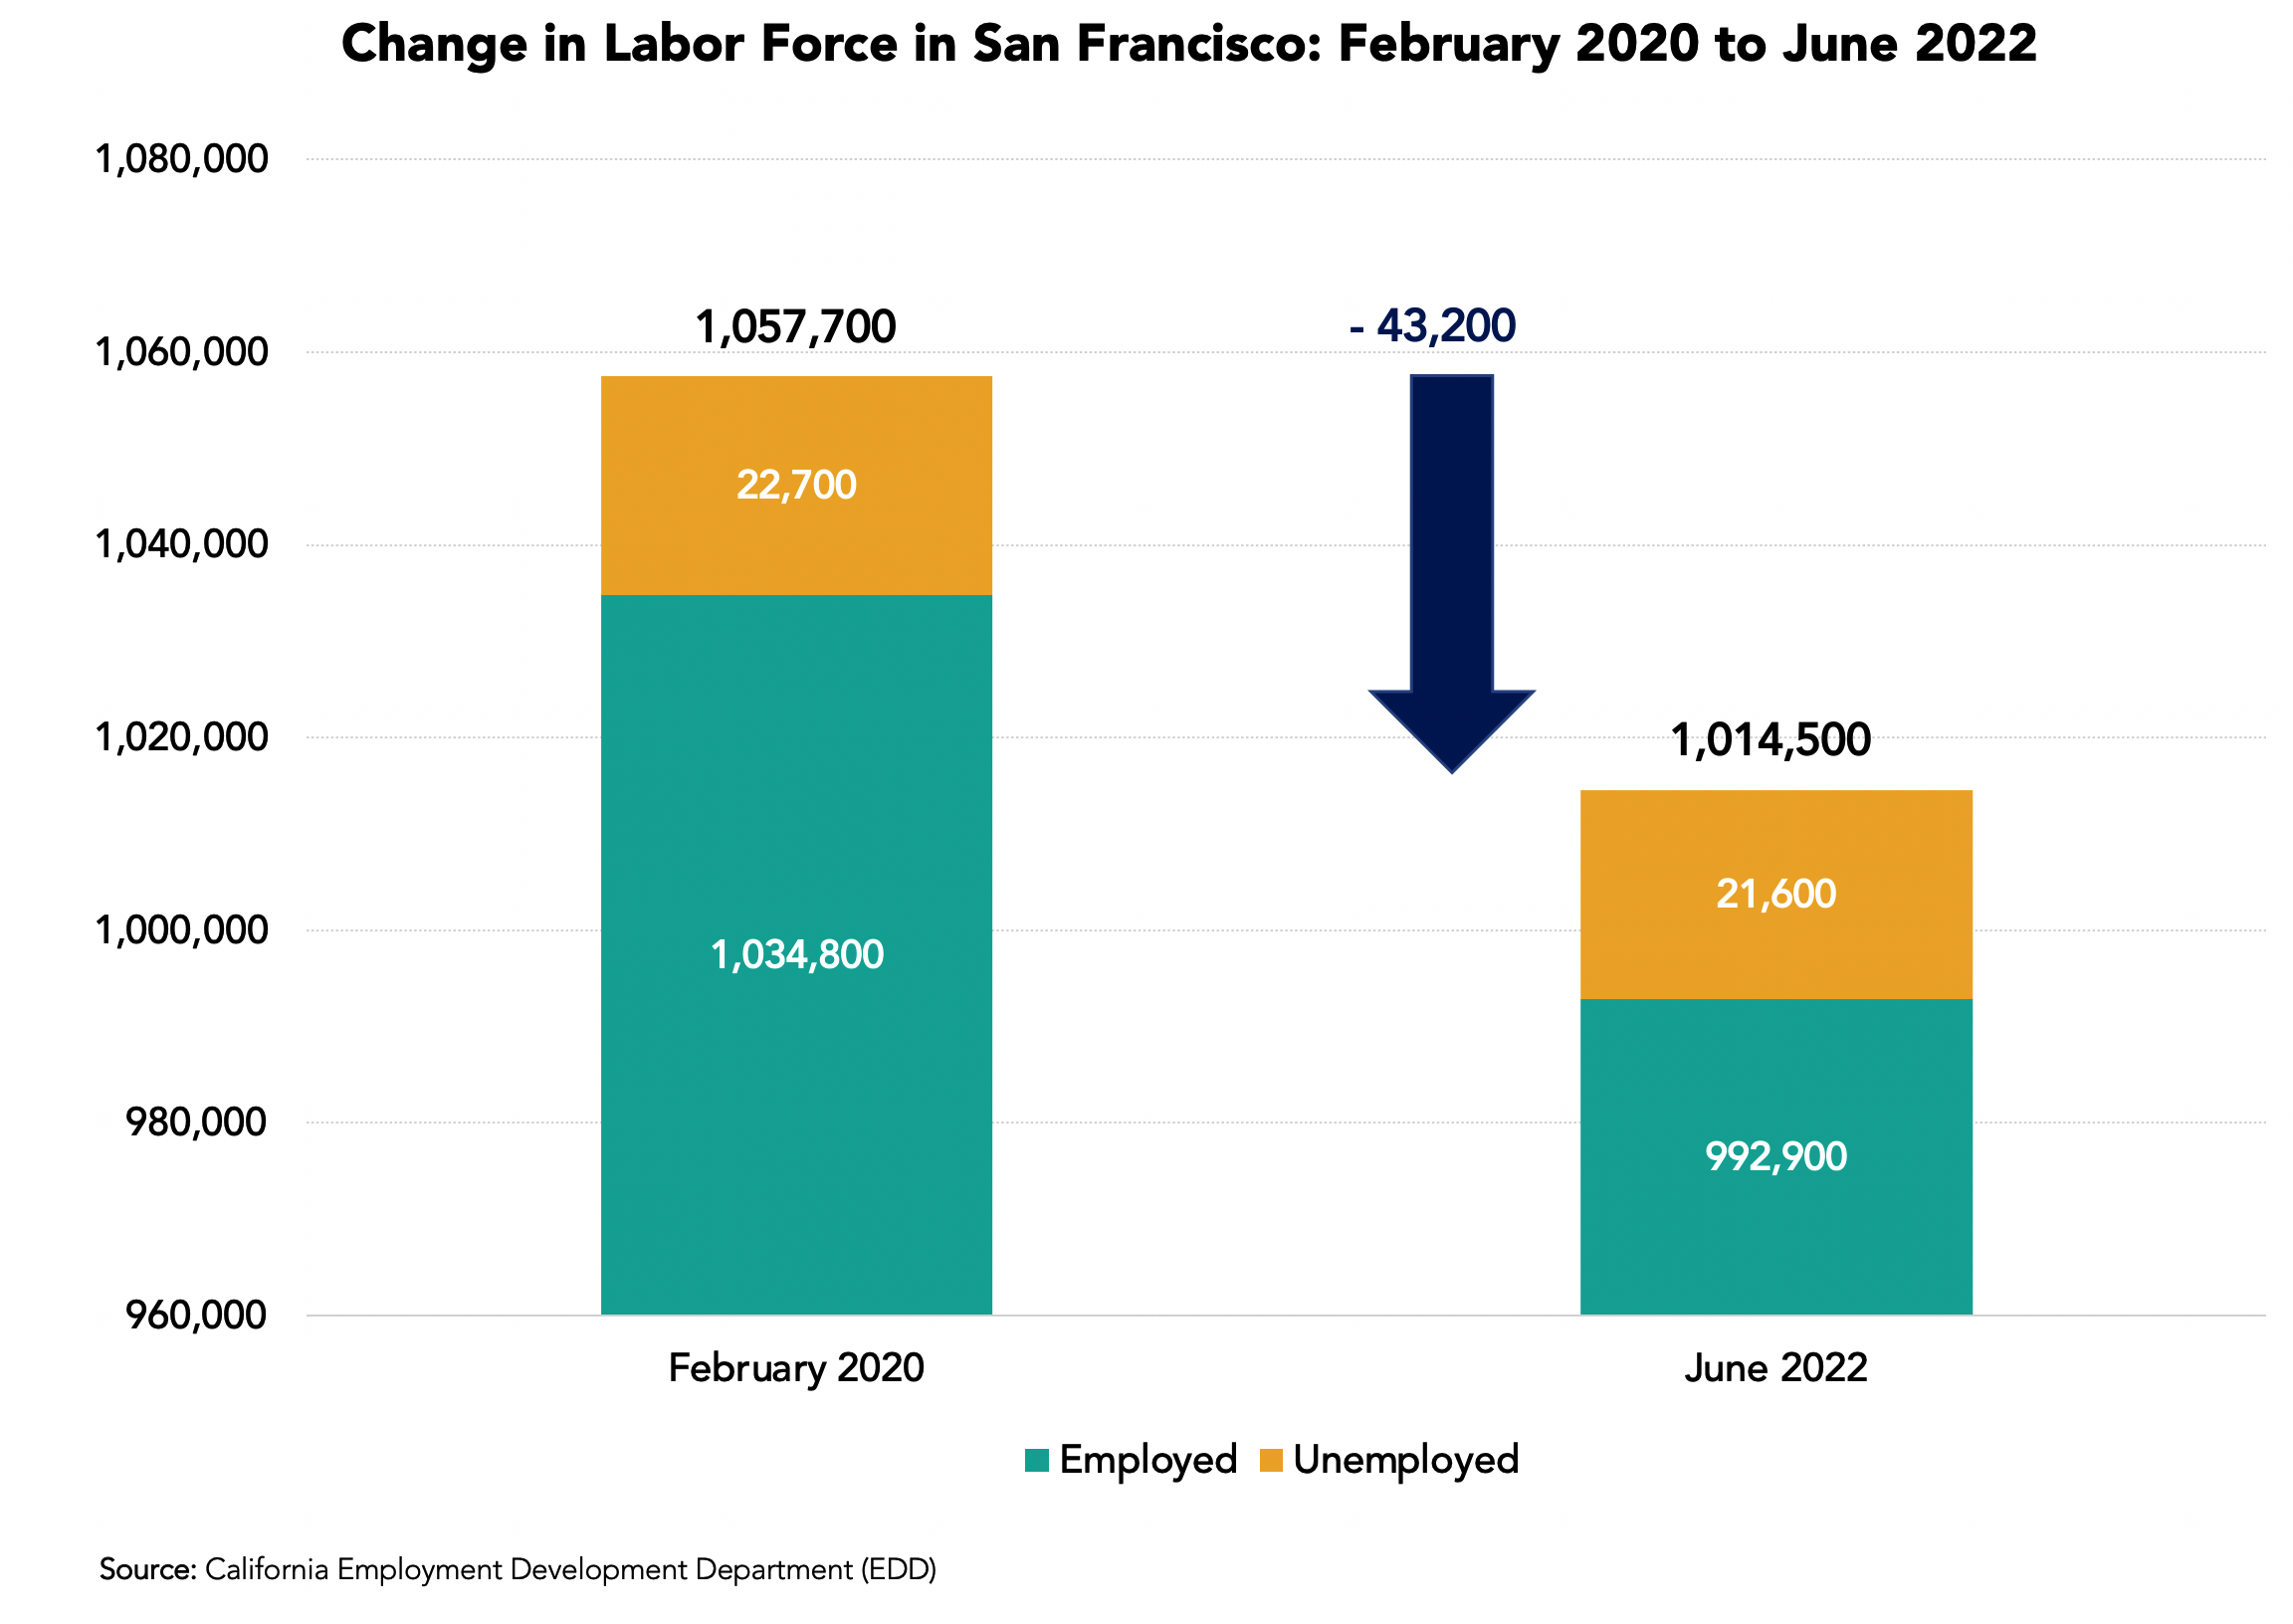
So where has the region’s labor force gone?
Access to talent has long been one of the key reasons startups and established companies alike choose to locate in the Bay Area. Whether it be from immigration, domestic in-migration, or natural growth, economically competitive regions are generally growing regions. The loss of 114,000 individuals from the workforce of our three largest job centers, and 144,800 from our region in total, does not bode well for the future of the region’s economic competitiveness.
If you’ve been following San Francisco’s recovery in the news, this all might not be a complete surprise. The region has some of the highest shares of remote-eligible jobs in the country, has experienced what has been dubbed an “exodus” of individuals moving out for better quality of life and affordability, and has some of the most cautious citizens in the country when it comes to COVID-19 protocols. And the simplest answer might be the right one: new data from the California Department of Finance estimates 135,000 residents have left the Bay Area over the last two years, a question we will examine in next week’s Bay Watch.
Bay Watch: A Weekly Look into the Bay Area Economy
August 9, 2022
Despite recent job growth across key industry sectors, the Bay Area continues to struggle to recover the jobs it lost during the COVID-19 pandemic. San Francisco is still down over 32,000 jobs, exhibiting one of the slowest economic recoveries in the nation. Meanwhile, sunbelt cities like Austin, Dallas, Nashville, Atlanta, Houston, and Phoenix are all showing signs of growth beyond pre-pandemic levels. So why is San Francisco so behind?
San Francisco still down over 32,000 jobs, while mid-sized sunbelt cities lead the nation’s jobs recovery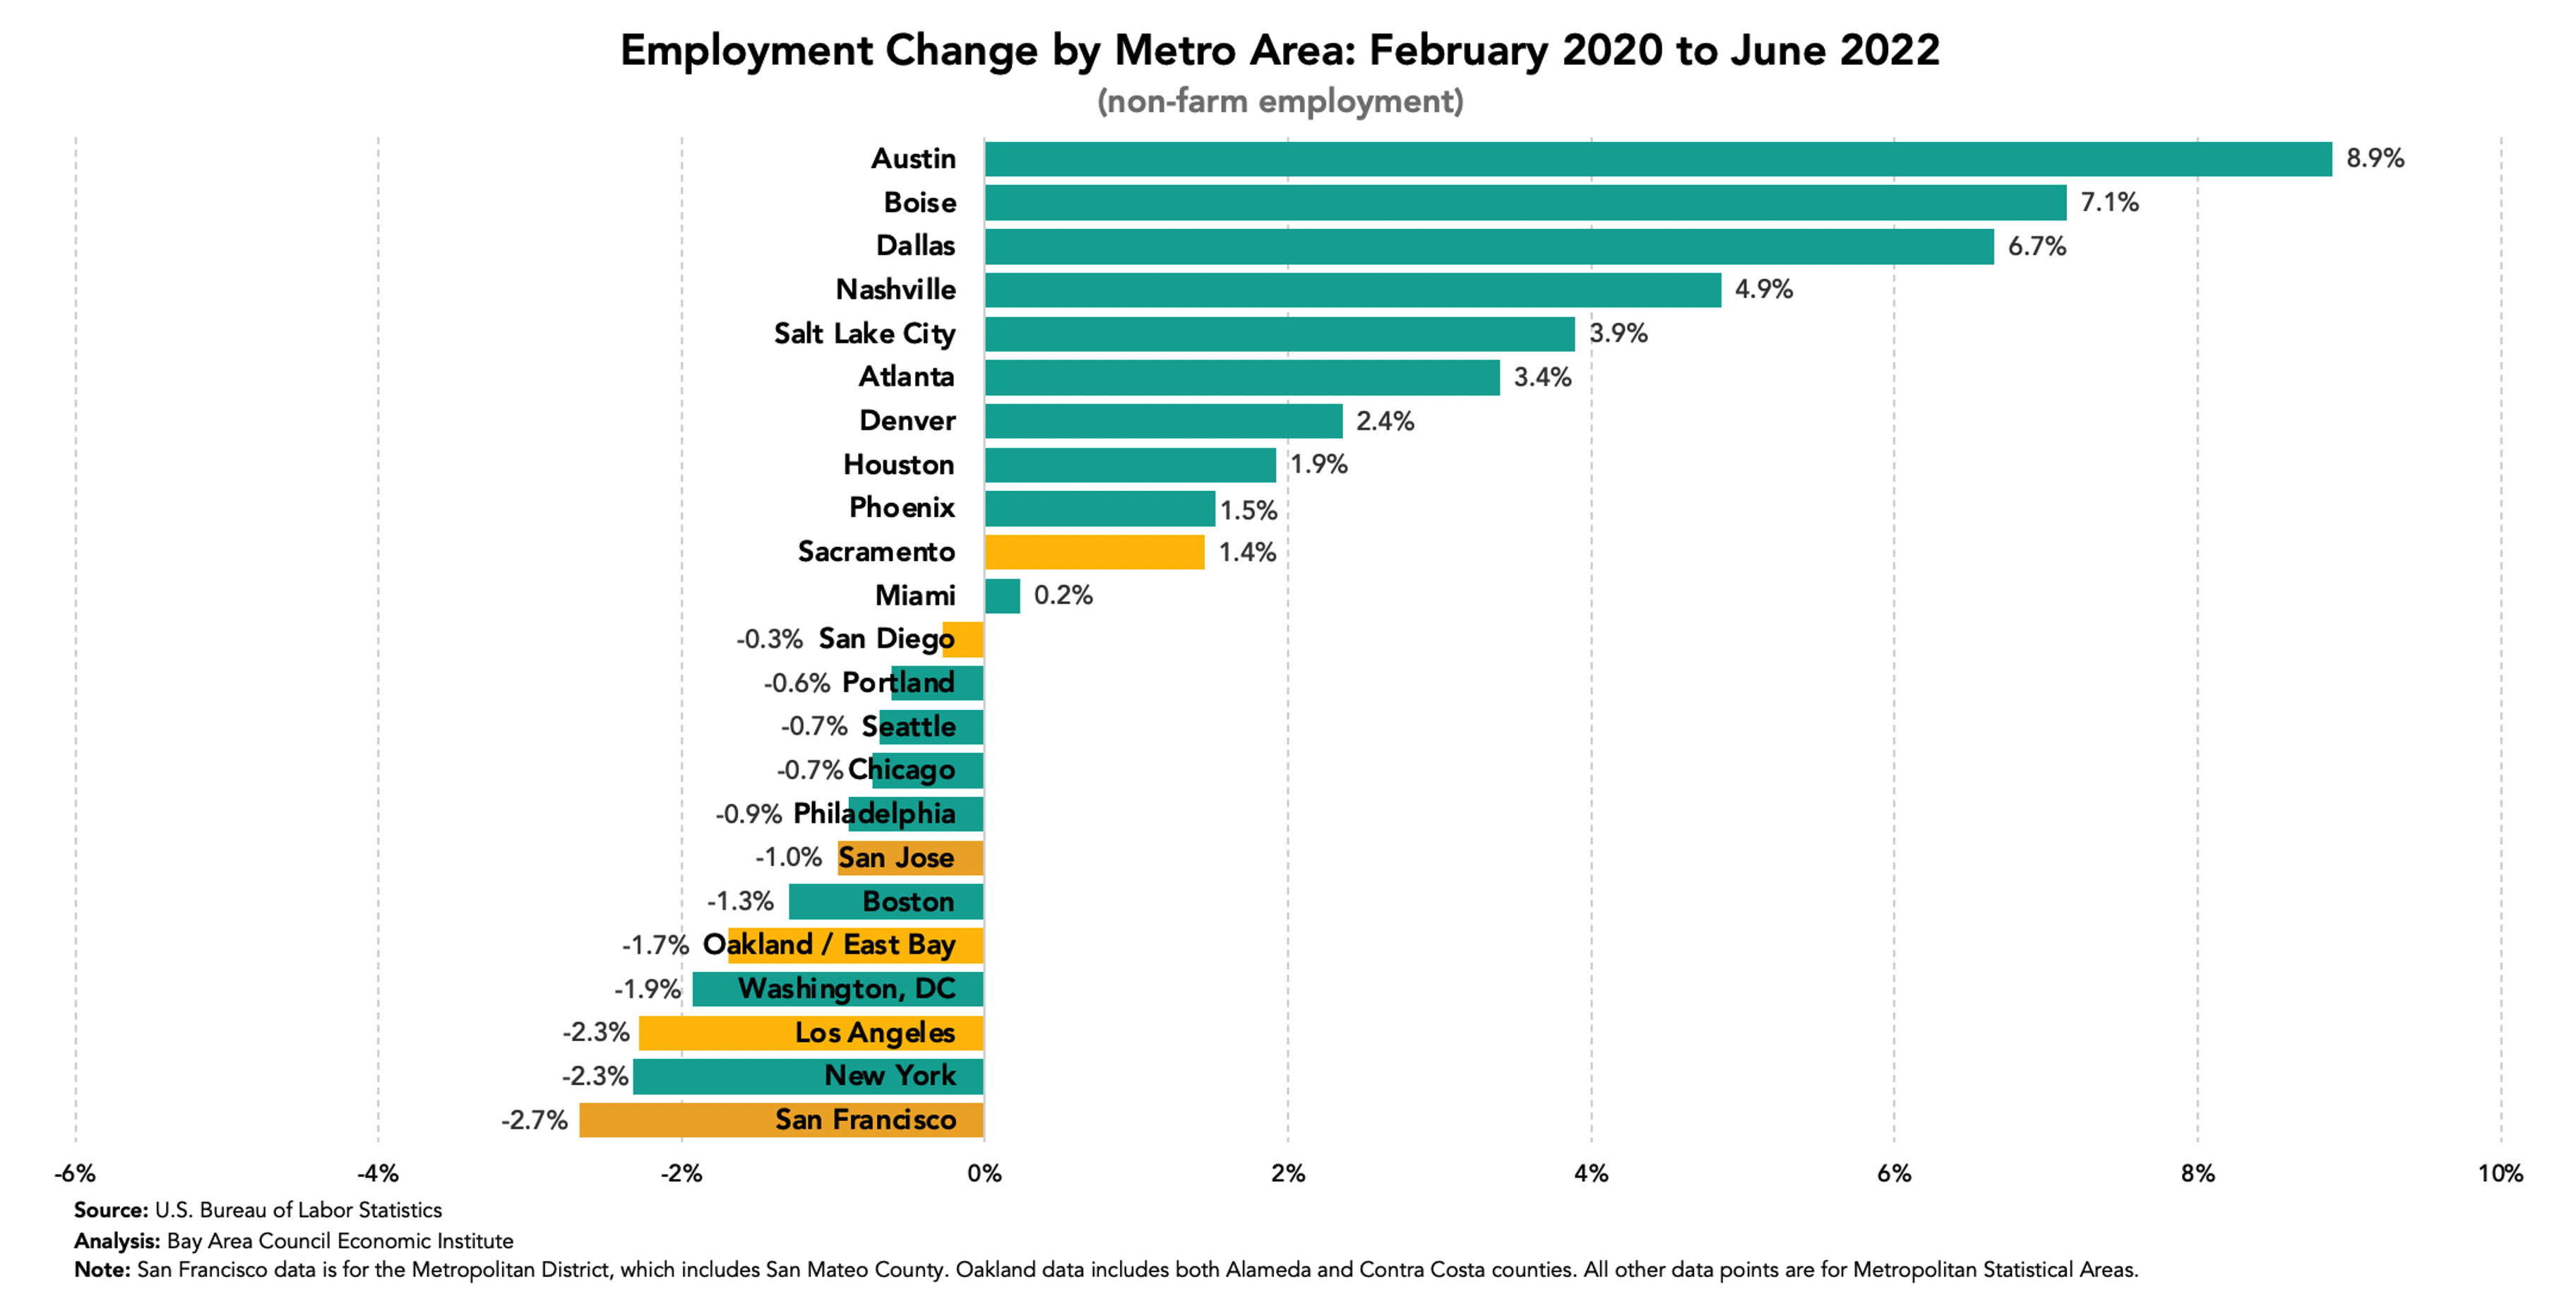
A struggling service sector
San Francisco, like many large urban metro areas, has high share of service economy jobs and a high share of office jobs. In many instances, the service economy relies on that office economy, and to some extent the tourism economy, for its revenues. With lower domestic and international tourism, and far fewer in person days in offices that line the city’s financial district, San Francisco’s leisure and hospitality sector (restaurants, bars, hotels, arts) is still down nearly 22%, accounting for 98% of the city’s jobs deficit.
Unlike other major cities also struggling to recover their service sector jobs, San Francisco’s downtown lacks the economic diversity necessary for a resilient urban economy. With an abundance of jobs in the professional services sector (which includes tech and other office jobs), San Francisco has one of the highest shares of remote-eligible occupations. As many of these companies went remote during the height of the pandemic, businesses in the leisure and hospitality sector had to shutter, or return with limited staff and hours. Now, with some of the lowest office occupancy rates, and labor shortage due to record low unemployment rates, San Francisco’s downtown businesses are struggling to stay afloat.
Narrowing in on service sector job recovery, San Francisco significantly behind peer metro areas
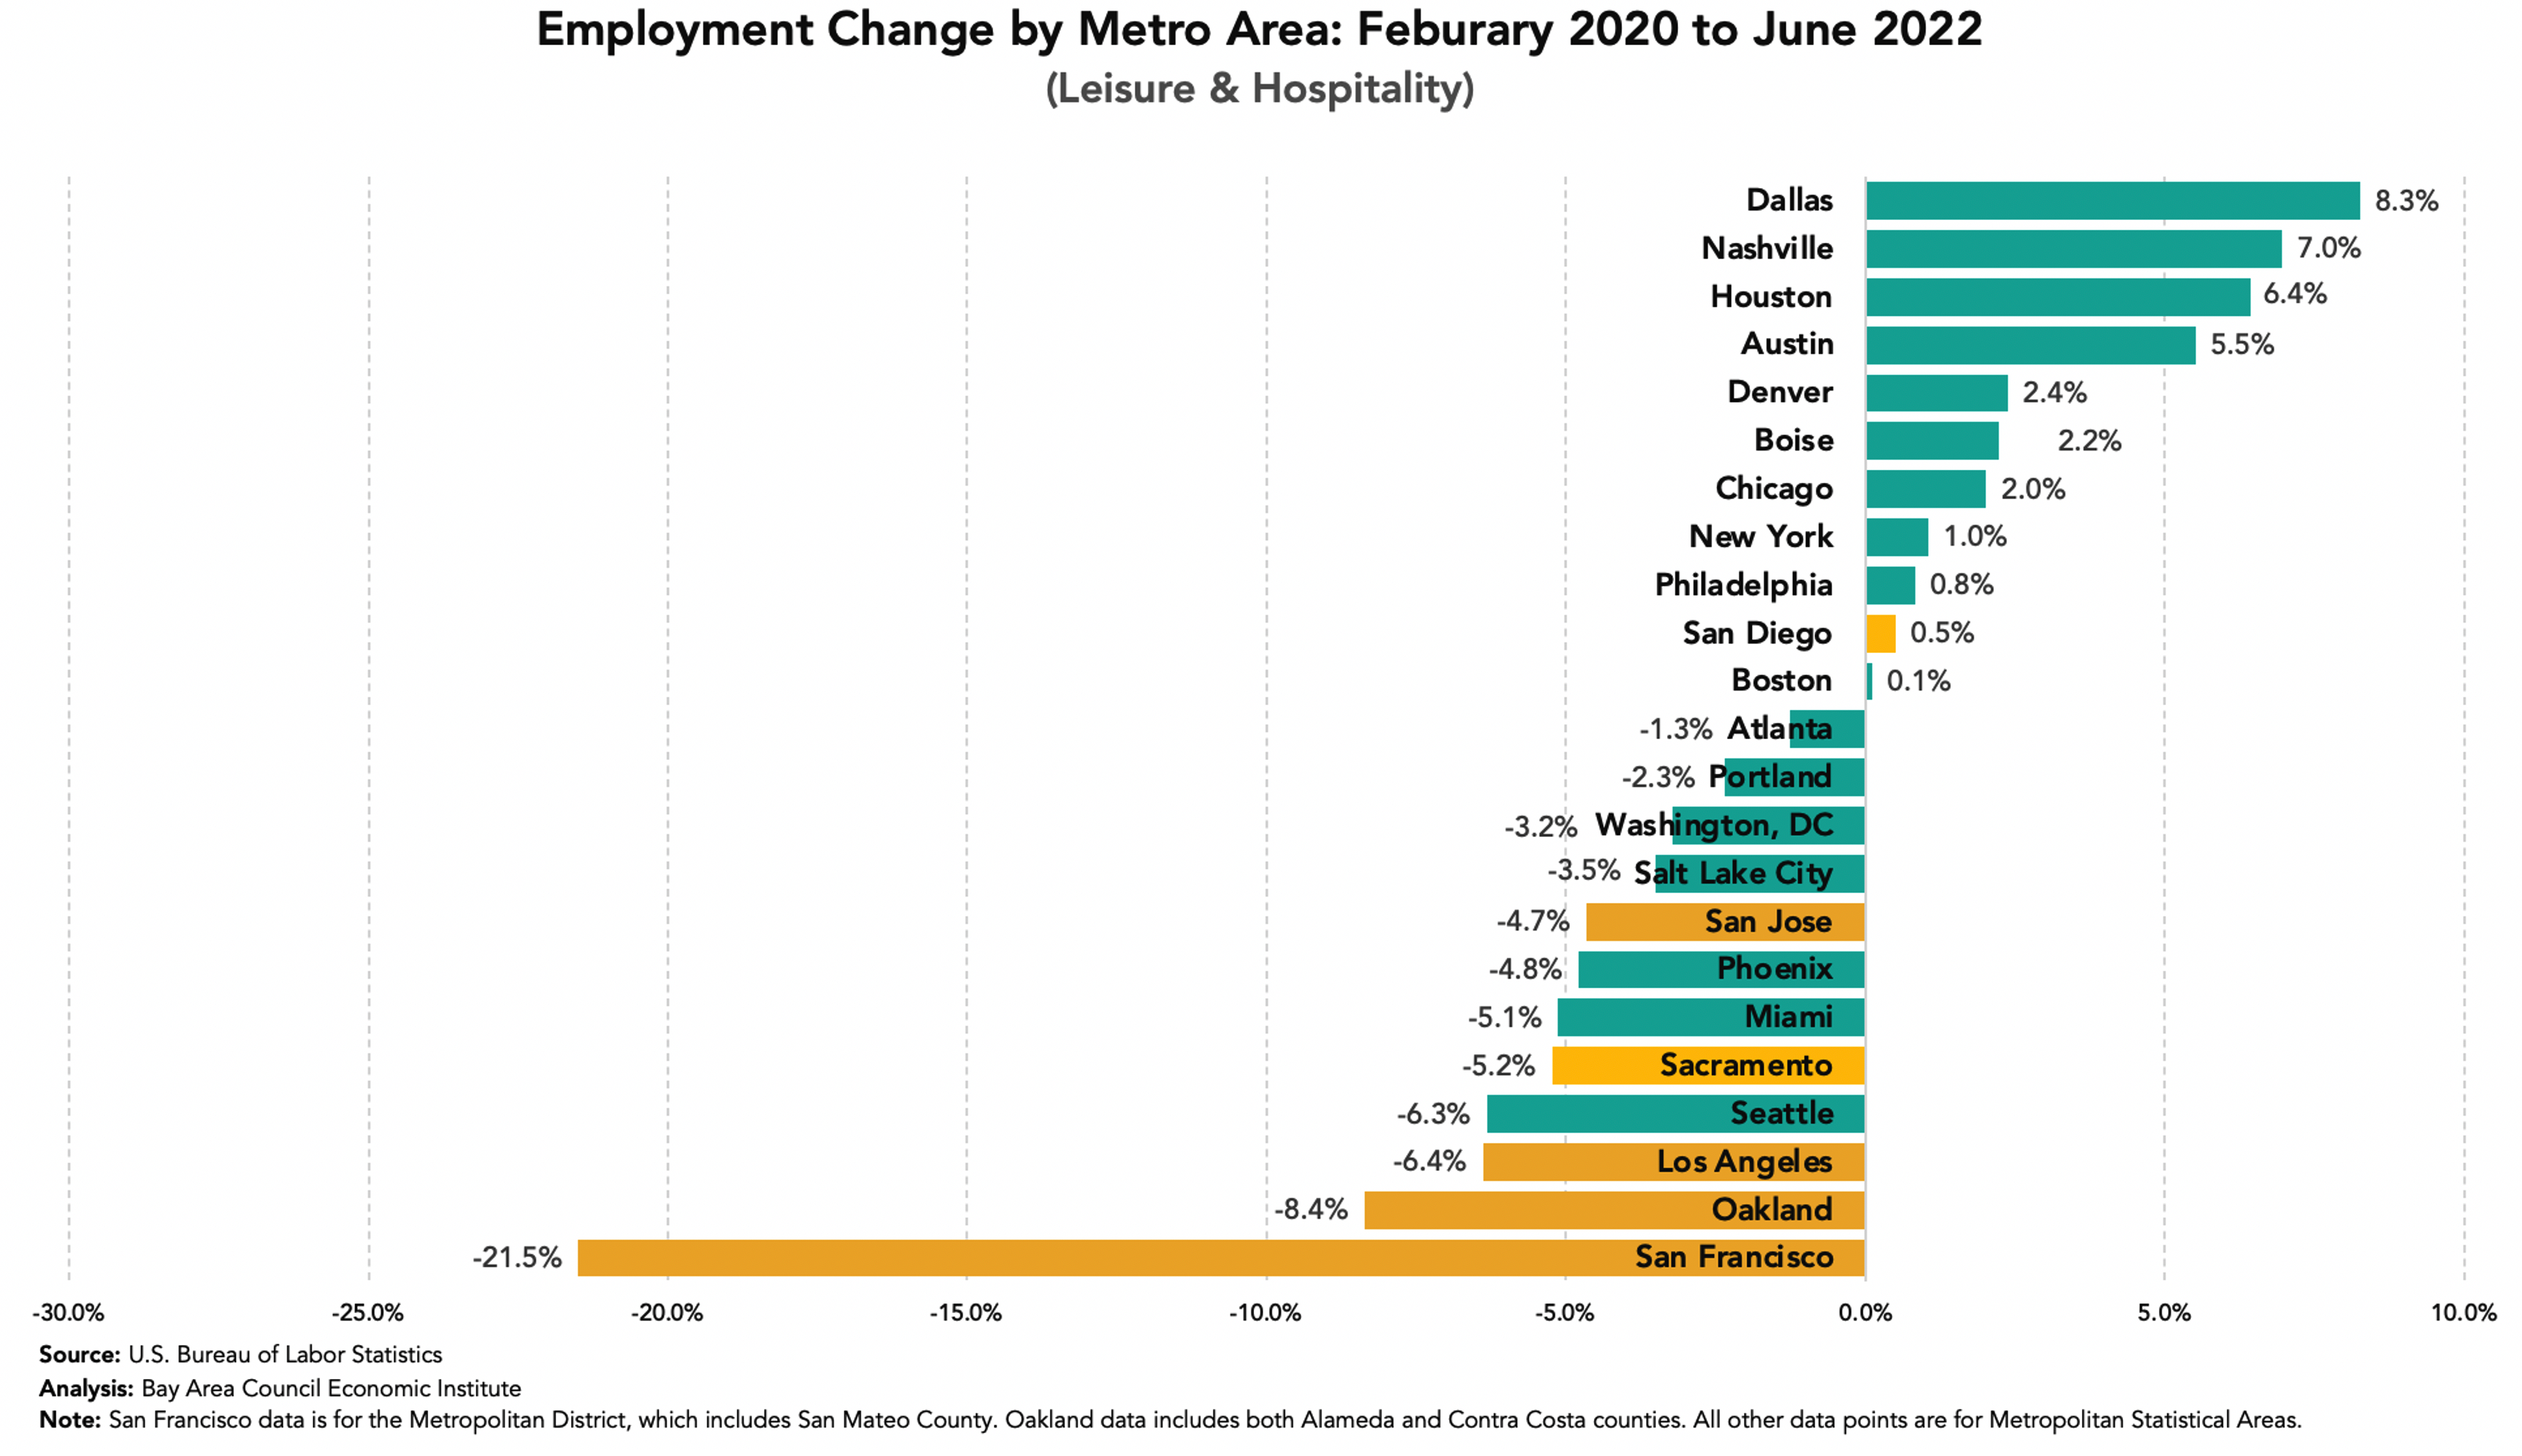
Key sectors return, and one of the lowest unemployment rates in the nation
If not for the deficit of leisure and hospitality jobs, San Francisco would be in the middle of the pack in terms of the economic recovery, and, almost completely recovered. Recent gains in key sectors have moved the city ahead of many of its largest peers, including New York, Los Angeles, and Boston. These gains have also given San Francisco one of the lowest unemployment rates in the nation – the city’s unemployment rate for June was just 2.1 percent, up from a revised 1.8 percent in May, one of the lowest unemployment rates ever recorded in the region. Next week’s Bay Watch will examine the nuanced reasons for the city’s extraordinarily low unemployment rate, but for now, it’s still an impressive milestone.
If not for the deficit of leisure and hospitality jobs, San Francisco would be in the middle of the pack
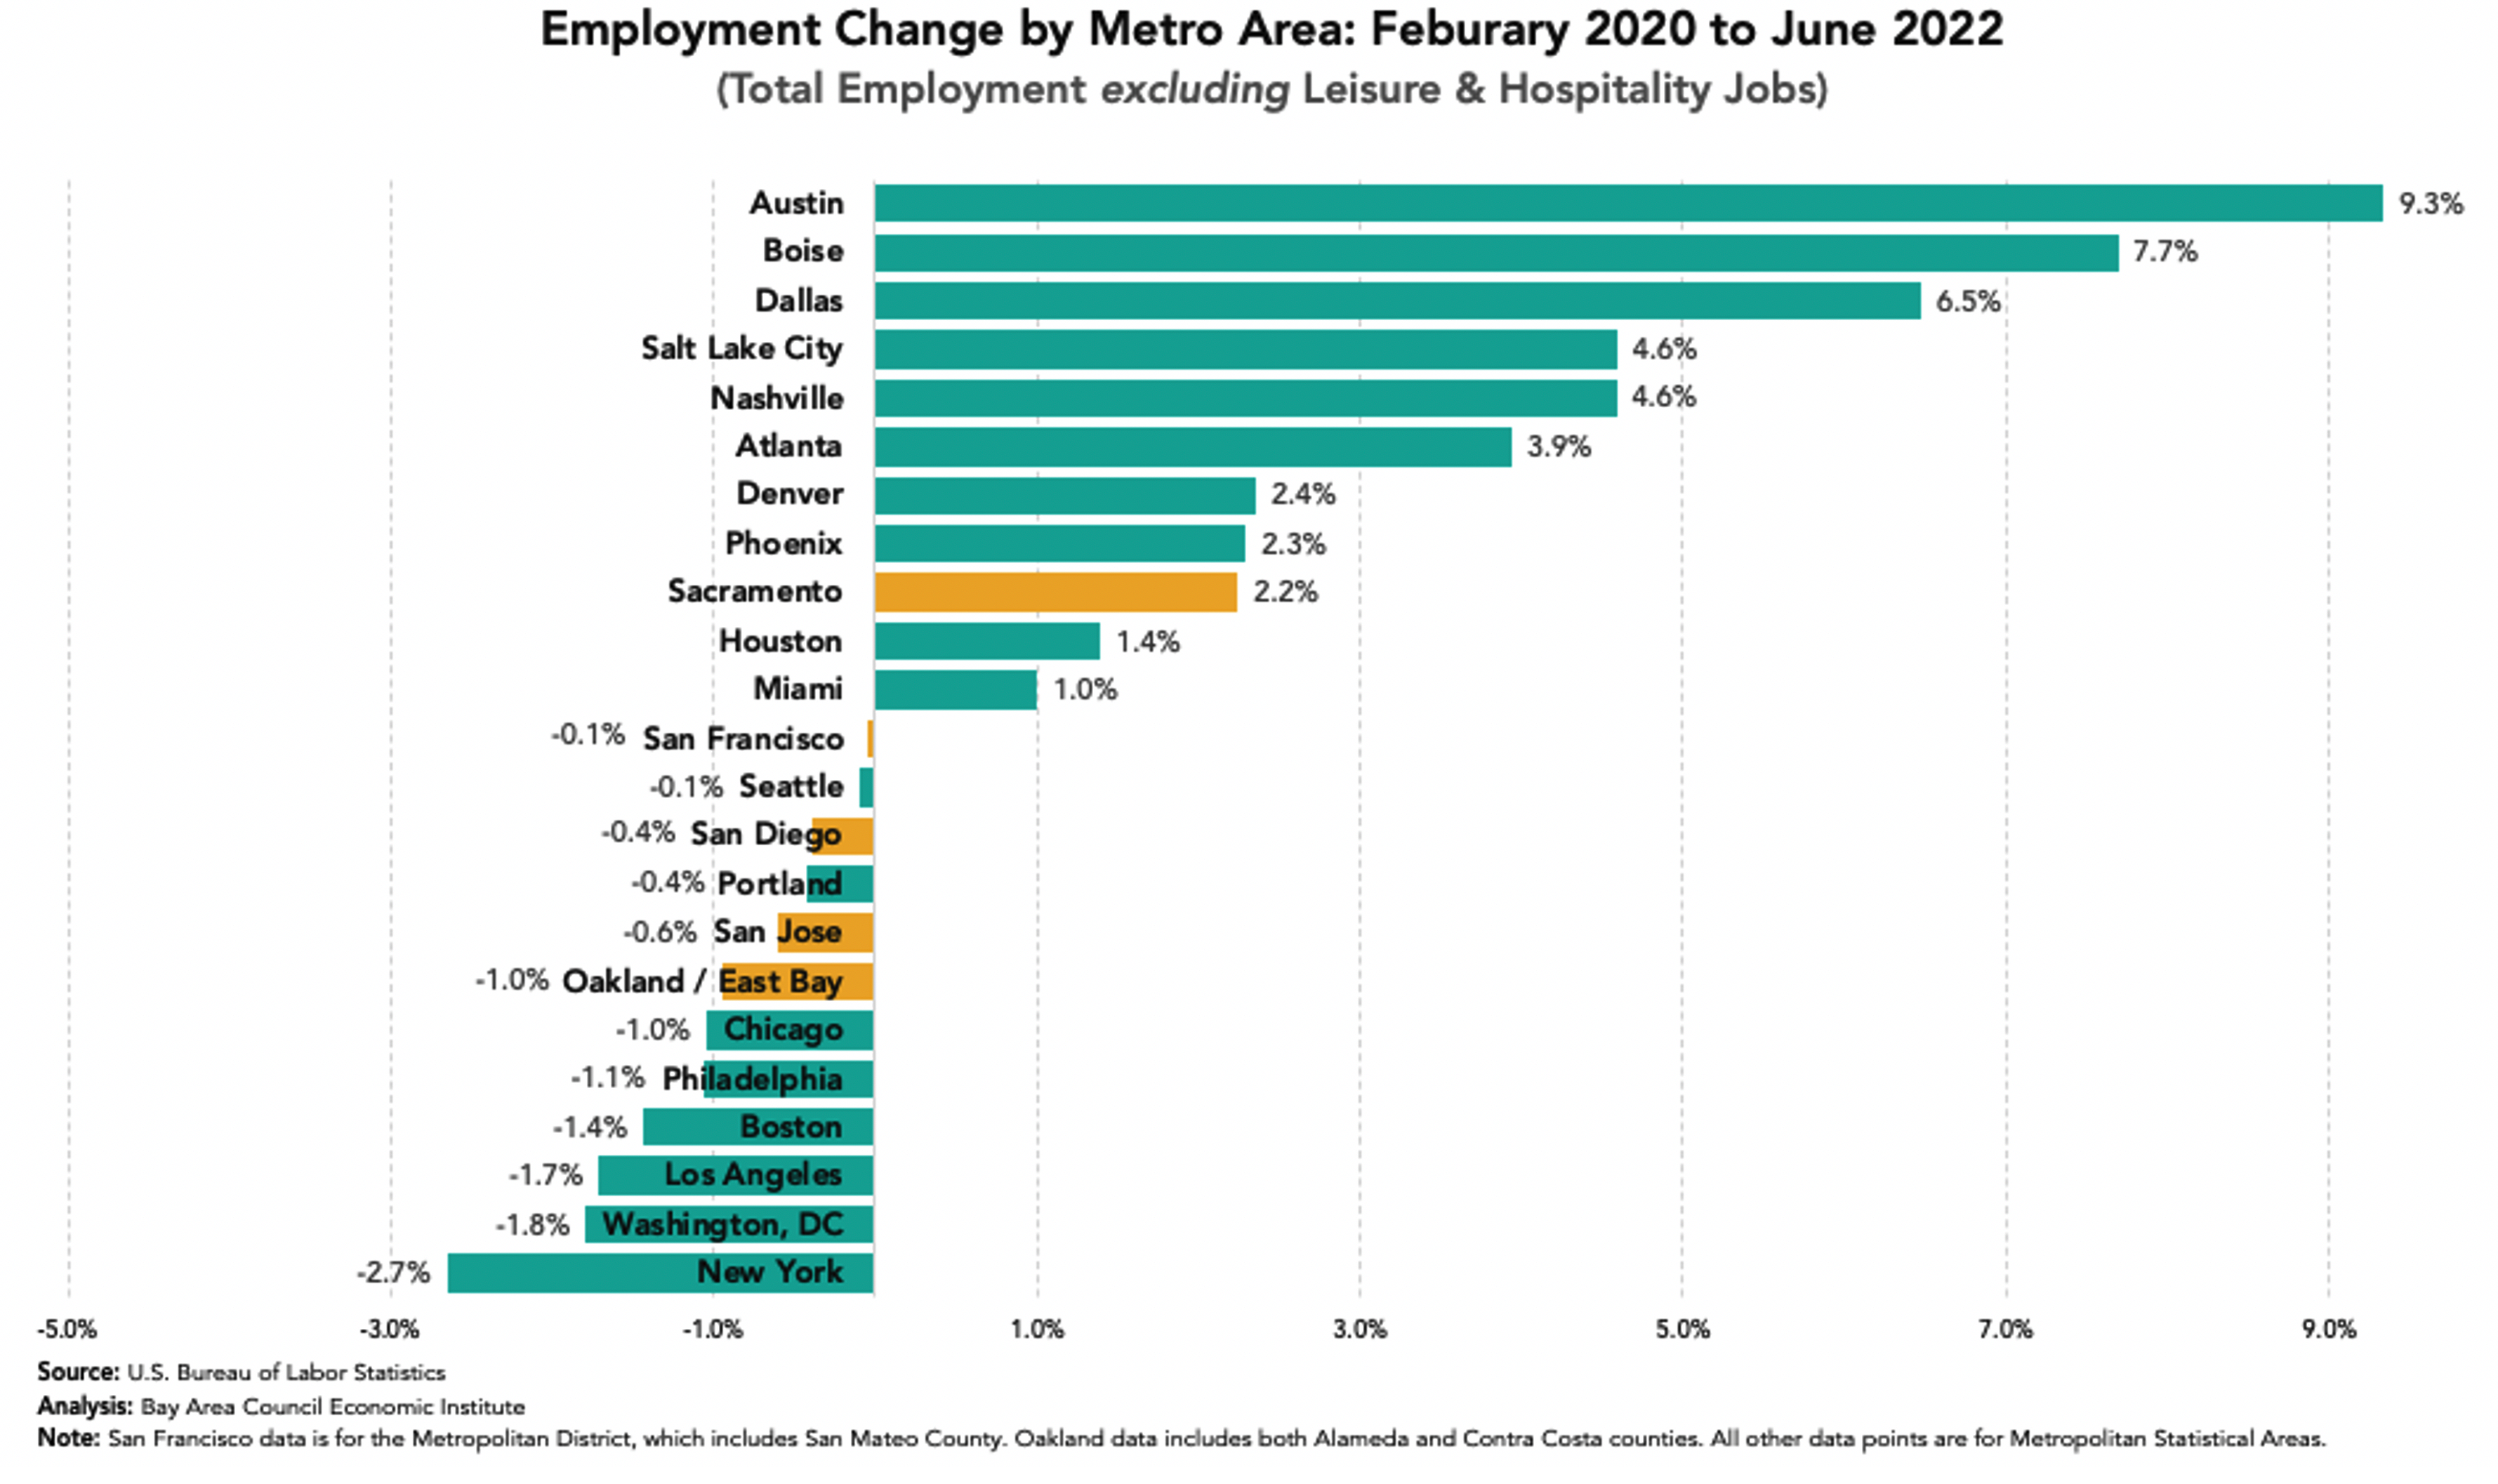
San Francisco cannot rely on bringing back the same office workers that once commuted to its central business district to fortify its service sector: over 65% of employers in the region say that in 6 months, they expect their workforce to come into the workplace 3 days or less (19% ultimately expecting their workforce to be fully remote). Instead, to revitalize downtown, the city must adopt creative strategies such as new residential construction, reformed zoning codes, reinvigorated nightlife and events, among other innovative solutions.
Bay Watch: A Weekly Look into the Bay Area Economy
August 2, 2022
Last week, Silicon Valley venture capital titan Andreessen Horowitz announced that it was taking its headquarters to the cloud. While it would retain its Menlo Park presence, the firm announced new offices in Miami, New York City, and Santa Monica.
It was the latest in a litany of corporate announcements by Bay Area companies that are expanding elsewhere, down-sizing office footprints in the region, or moving to a fully remote workplace. However, the announcement by Andreessen Horowitz may have even bigger ramifications for the Bay Area.
For decades now, the Bay Area – and Silicon Valley in particular – has been the epicenter of venture capital investment. The investors themselves are concentrated here, and much of their investment capital flowed to a Bay Area-based startup. That proximity allowed for easy exchange of information between companies and investors, and it provided a network effect that made Silicon Valley a magnet for entrepreneurs from across the globe. Those entrepreneurs started companies that are now some of the region’s largest private employers in the tech industry.
But with venture capital increasingly moving to the cloud, does that foreshadow an end to the region’s stranglehold on the venture capital industry and the risk capital that has injected so much economic growth into the Bay Area and Silicon Valley?
In this first installment of our weekly Bay Watch, we take a look at the numbers to dive deeper into the venture capital industry.
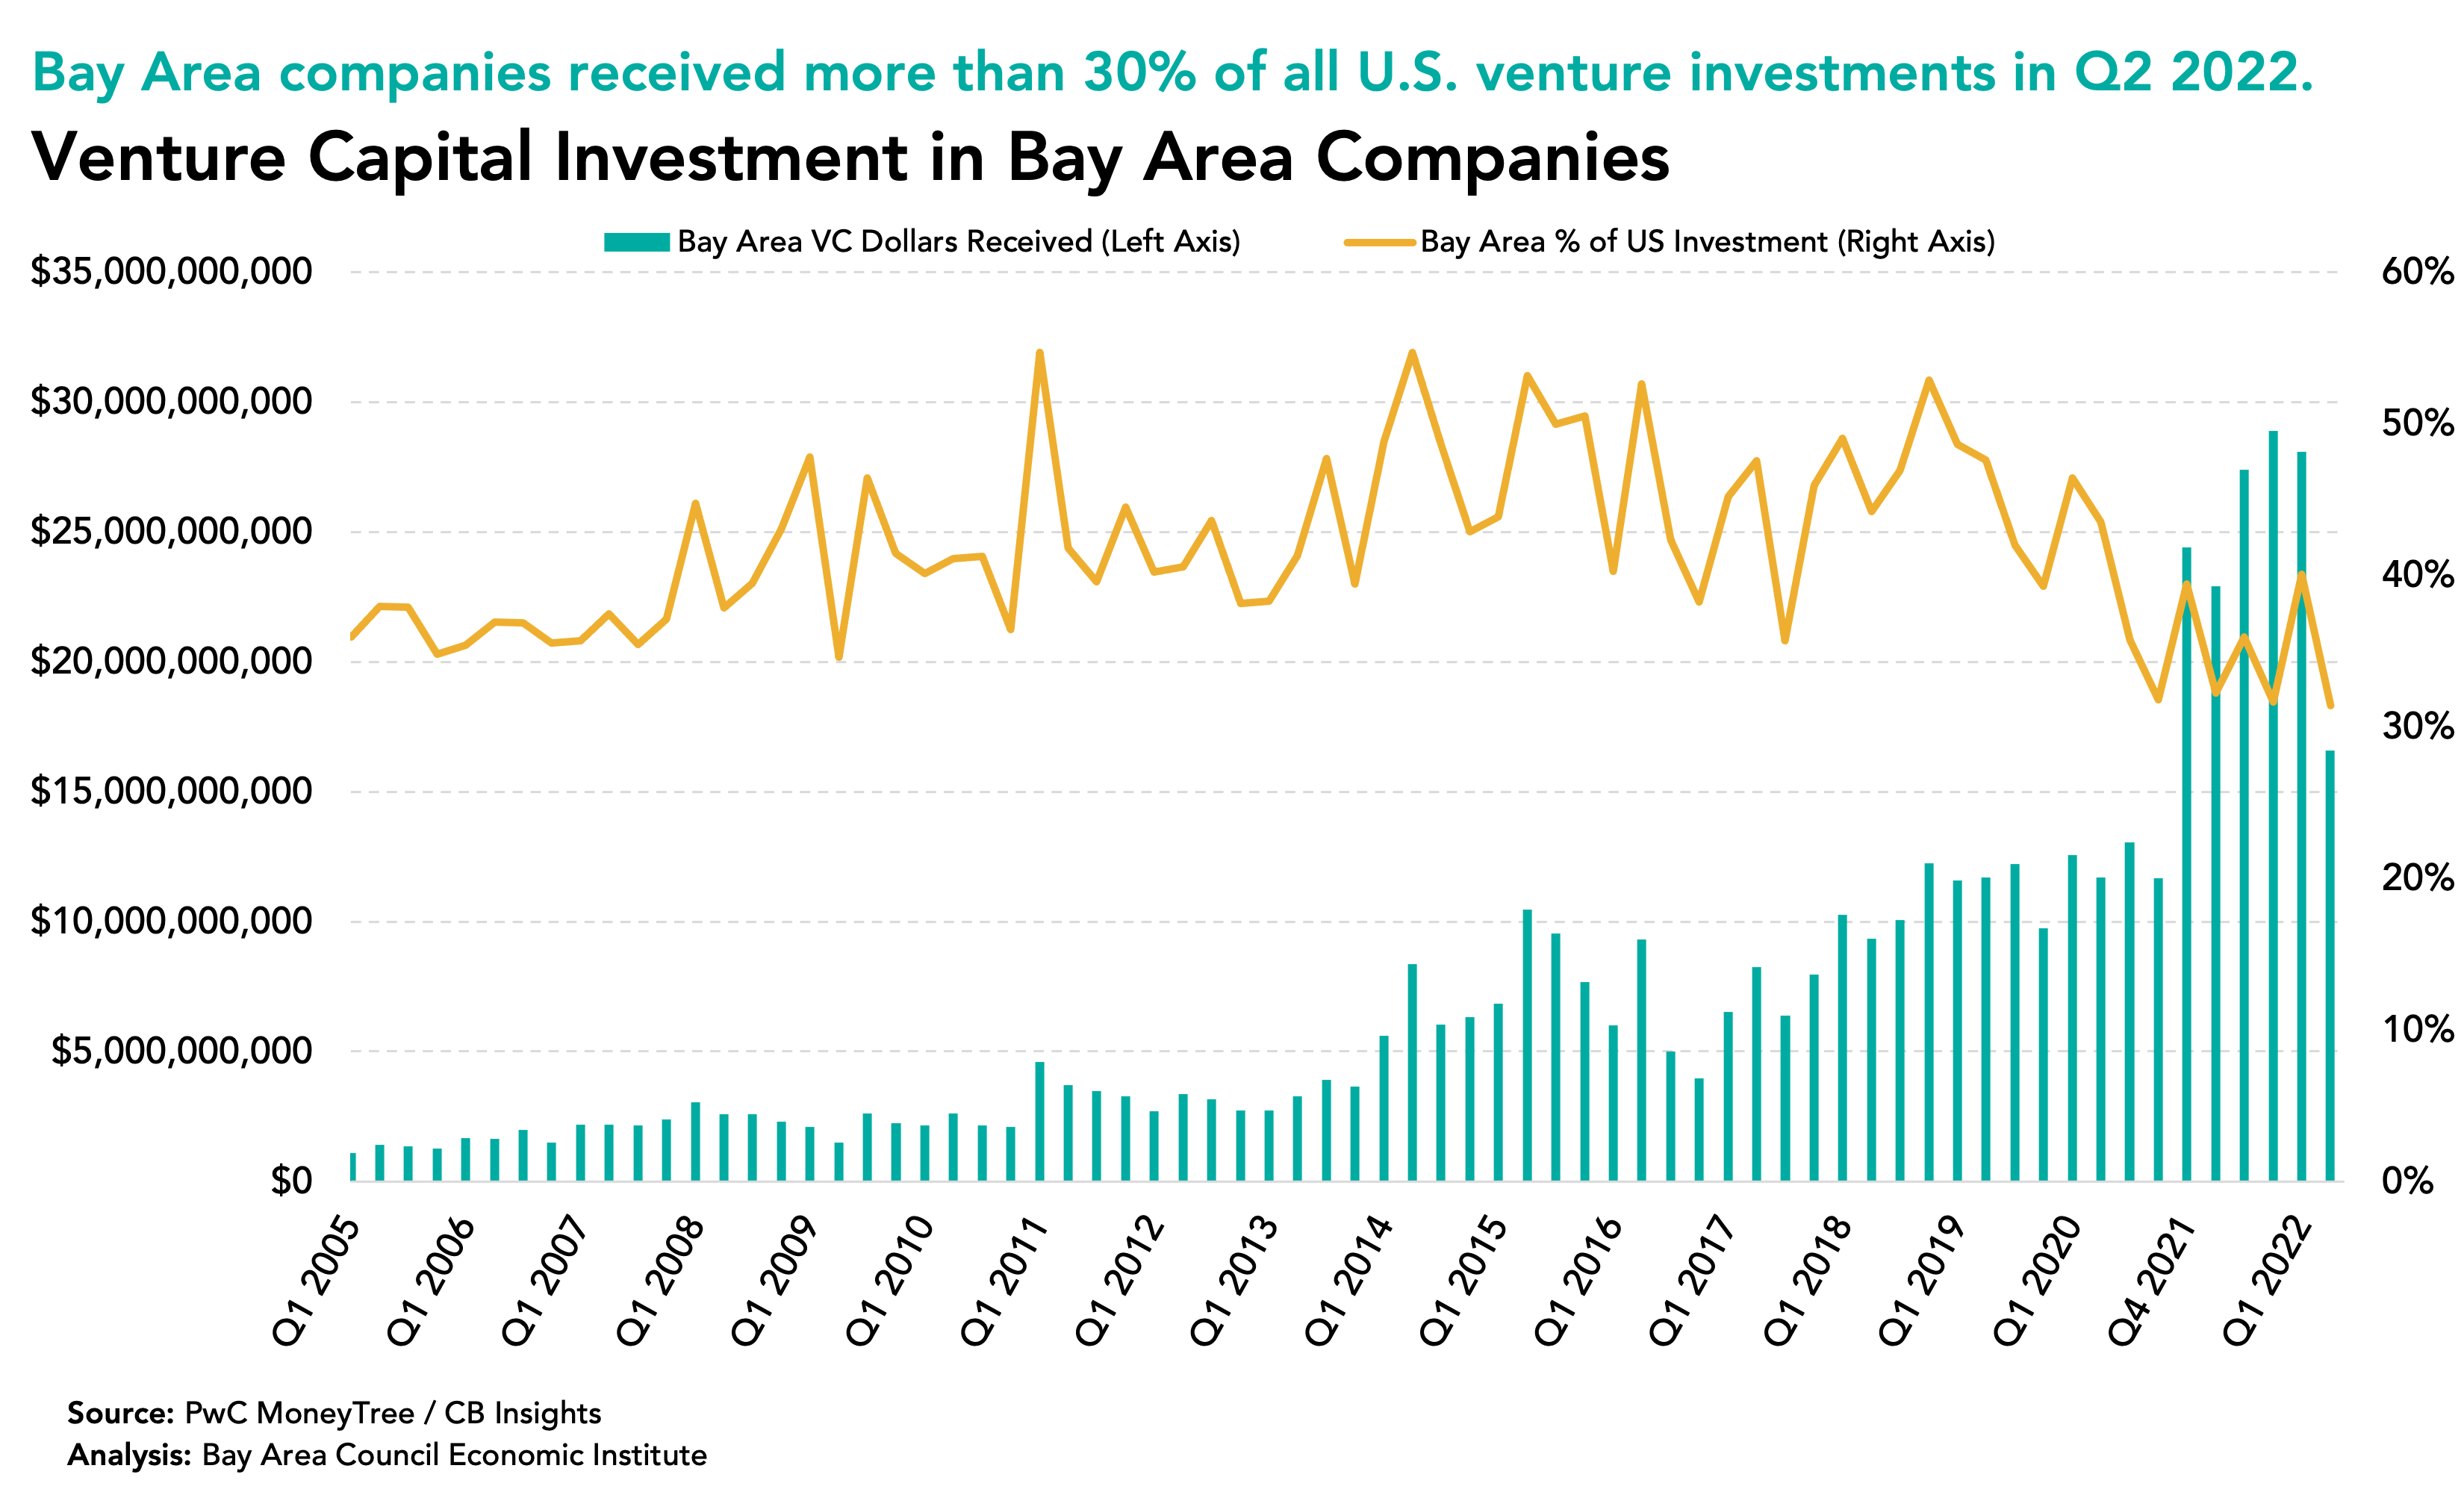
Chill out, man:
Bay Area companies received over $100 billion in venture capital investment during 2021, according to CB Insights data. That figure has 11 zeros, and it represents more than one-third of all venture capital investments made in the U.S. during the year.
The Bay Area is still far and away the leader in venture capital dollars received. The next closest competitor, New York, received just over $50 billion in venture investment during 2021. On a per capita basis, the Bay Area’s share of the venture capital market is even more impressive. Yes, the region’s dominance has been eroded in the last two years, but $100 billion is a massive number that will drive a new wave of tech dominance in the Bay Area.
It never made sense that nearly half of all great ideas for new companies were located in the Bay Area. Investors are rightly looking under every rock for the next multi-billion-dollar company, but significantly more bets are still being placed in Silicon Valley than in Miami, Denver, Salt Lake City, and Austin combined.
While deal activity has slowed in 2022, venture capitalists have raised nearly as much funding in the first two quarters as they did in a record 2021. When the economy returns to growth mode, venture capital will again be deployed in massive waves, and the Bay Area stands to be the biggest beneficiary.
Hold onto your butts:
One-third of all venture capital investment coming to the region is down significantly from a high of 50% during 2015. Remote work and videoconferencing have changed the game for venture capitalists. More importantly, they appear to have changed the game for entrepreneurs, who are no longer tethered to Silicon Valley’s high costs. With tech talent dispersing across the nation, venture capital dollars are sure to follow.
Venture capital is also in the midst of a correction following a record year in 2021. More than $91 billion was invested nationally in the fourth quarter of 2021. That number has dropped to just $53 billion invested nationally during the second quarter of 2022. When the industry recovers, it is less certain than ever that the bulk of its risk capital will find a home in the Bay Area. It is not one single geography that is competing with Silicon Valley; it is the cloud.