Economic Profile

The nine-county San Francisco-Silicon Valley Bay Area has been the international innovation economy’s hub since the 1970s, one of the nation’s most resilient regions for the past fifty years, and the fertile ground on which Apple, Facebook, Google, and other corporations have grown into top companies by global capitalization in just the last decade. Even though these economic success trajectories have been almost unprecedented, the Bay Area economy is still currently on the upswing, rather than having reached a peak or started a decline. Much of the growth has occurred in clusters of highly-productive industries. These have thrived due to factors such as the Bay Area’s unparalleled workforce, world-class higher education system, premier startup ecosystem, and the almost limitless opportunities created by the region’s dense concentration of venture capital that funds innovation across a broad range of established and emerging industries.

Bay Area Migration Trends

Looking Back at the Great Recession: Out-migration of Bay Area residents and what we can expect during the COVID-19 crisis

According to recent data released by the U.S. Bureau of Economic Analysisthe U.S. GDP shrunk by an annual rate of 5.0% in the first quarter of 2020 – representing the largest dip in GDP since the Great Recession. In the midst of the COVID-19 crisis, the road to economic recovery is long and complex, particularly in the Bay Area – a region already experiencing high housing costs, income inequality, and a negative net domestic migration of residents in recent years. While it is still too early to say how out-migration might play a role in a post-COVID-19 Bay Area world, out-migration data from the California Department of Finance and the American Community Survey during the Great Recession years can offer a representation of how residents in the region may be impacted by the current recessionwhile also revealing demographical information about what residents are most prone to leave the region. 

The last twelve years of data on Bay Area population change reveals that net domestic migration curtailed considerably during the Great Recession years, dropping again in the negatives between 2015 and 2019. Compared to recent years, population change during the Great Recession also reflects the incremental decline in net international migration, particularly after 2008, where net international migration stabilized or did not begin to increase again until 2014. Despite this decline, the strong presence of net international migration throughout these twelve years does reinforce the notion that the region has continued to attract diverse talent from across globe, particularly to its innovation and technology hubs. There has been a steady decline  

This backward-looking view of Bay Area population change can also indicate the region’s future. In the years following and during the COVID-19 pandemic, net international migration is likely to continue to fall, while negative net domestic migration may increase further as residents look to more affordable regions to live in. 

So, what can we learn about residents that left the Bay Area during the Great Recession? The following analysis uses American Community Survey data from 2008 to 2011, capturing the eighteen-month period in which the U.S. was in the Great Recession; the data represents individuals that moved during the previous year. This dataset also represents residents as each head of a household, rather than all individuals in a given household, including children. The data and analysis on income, educational attainment, and industry and occupations only includes residents 18 years or older that are employed. 

During the Great Recession years, a total of 672,382 residents and 322,868 households left the Bay Area, with the majority of the population and households leaving during 2008. Of the working age population (all households where the head of household is 18 years or older), the majority of households that left the region during the Great Recession were in the 25-35 age group. These 49,388 households represent 36% of the households that migrated during the Great Recession. Households that left the region varied widely across income levels, with the two highest income groups with households that migrated during the Great Recession being the $25,000-$50,000 and $100,000-$200,000 income groups. 

Overall, 23% of households that left the region had either a household income between $25,000 and $50,000, or a household income between $100,000 and $200,000. The juxtaposition between these two income groups perhaps tell different stories as to why individuals left the region during the recession and may elude to how residents with high and low incomes may be impacted migration during and in the aftermath of the COVID-19-generated recession. 

A majority of Bay Area residents that left during the Great Recession were white (52.6%)By contrast, 22.3% residents that left during these years were Asian, 8.6% were Latinx and 6% were Black. 

Compared to the demographics of the Bay Area during the Great Recession years, a significantly smaller proportion of Latinx residents left the region (8.6%) than were a proportion of the regional population (22.9%). This may in part be due to larger families living together in a household, as well as a portion of these residents being undocumented and not wishing to/being able to leave the region for fear of deportation. 

Lastly, workers that left the region were employed in a variety of industries. 4,643 workers previously held roles in Computer and Mathematical occupations, while on the other hand, more than 8,000 workers held a variety of Sales jobs, particularly as cashiers and retail salespersons. This, again, speaks to the income and occupation diversity of the residents that left the region. 

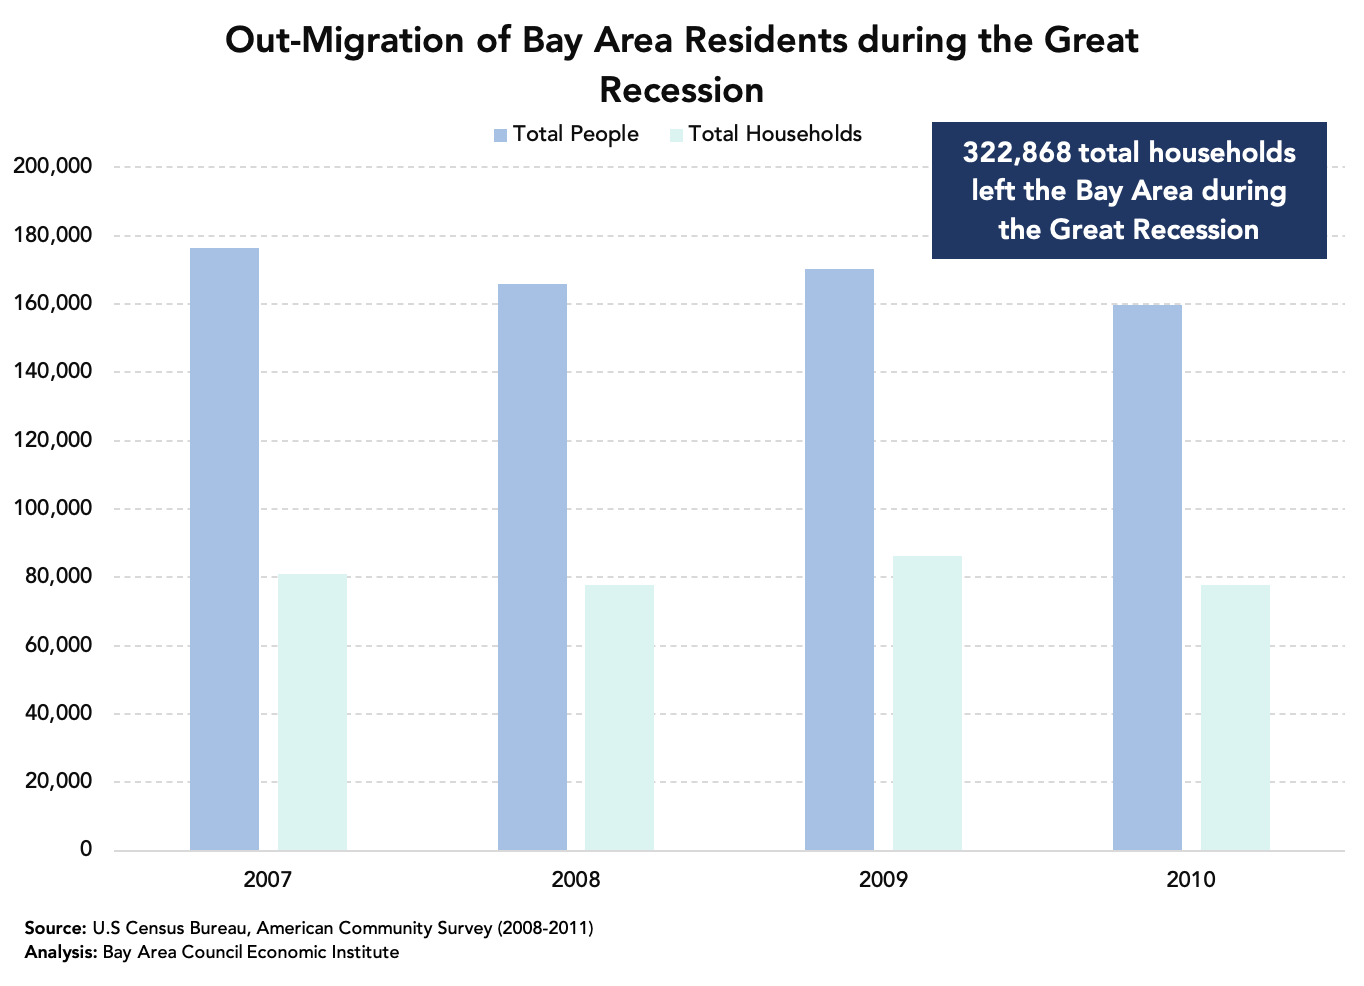
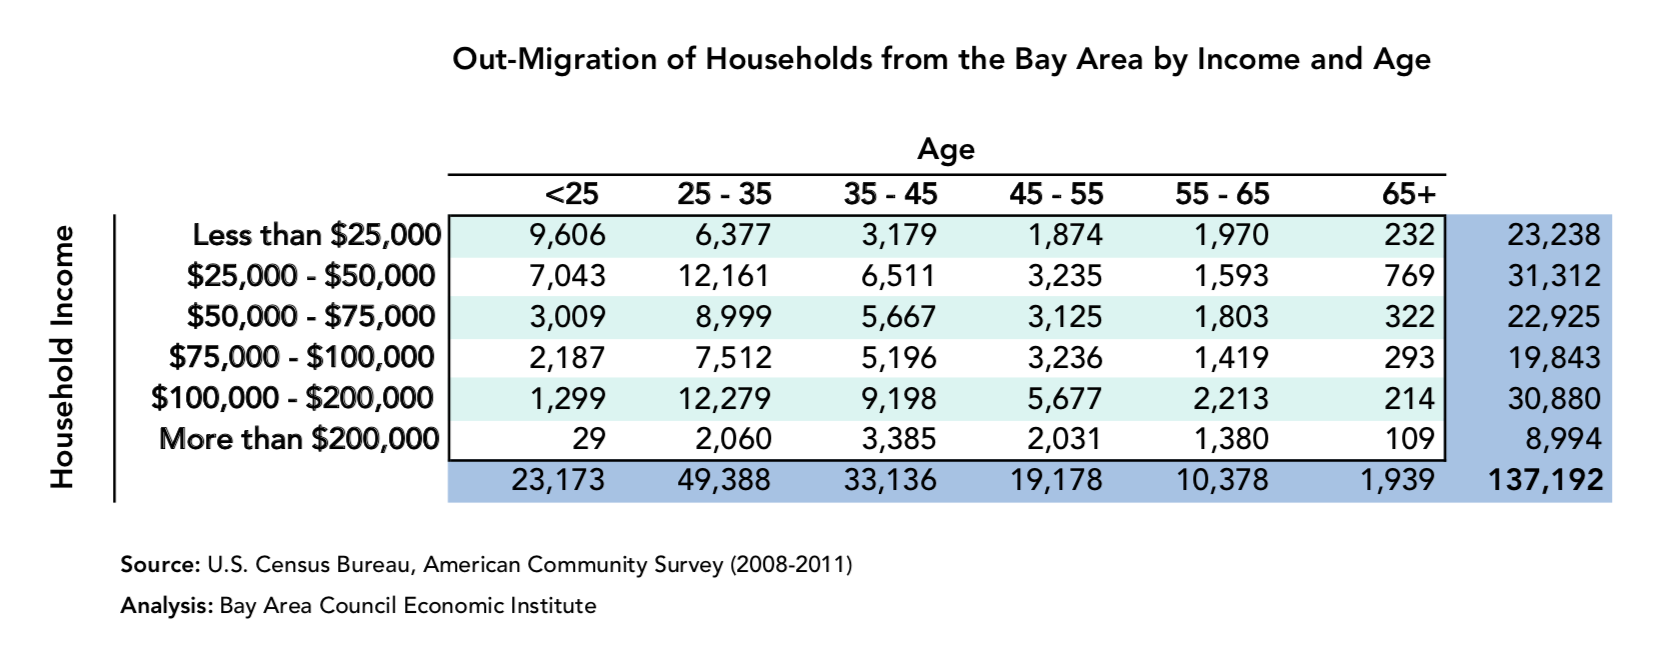
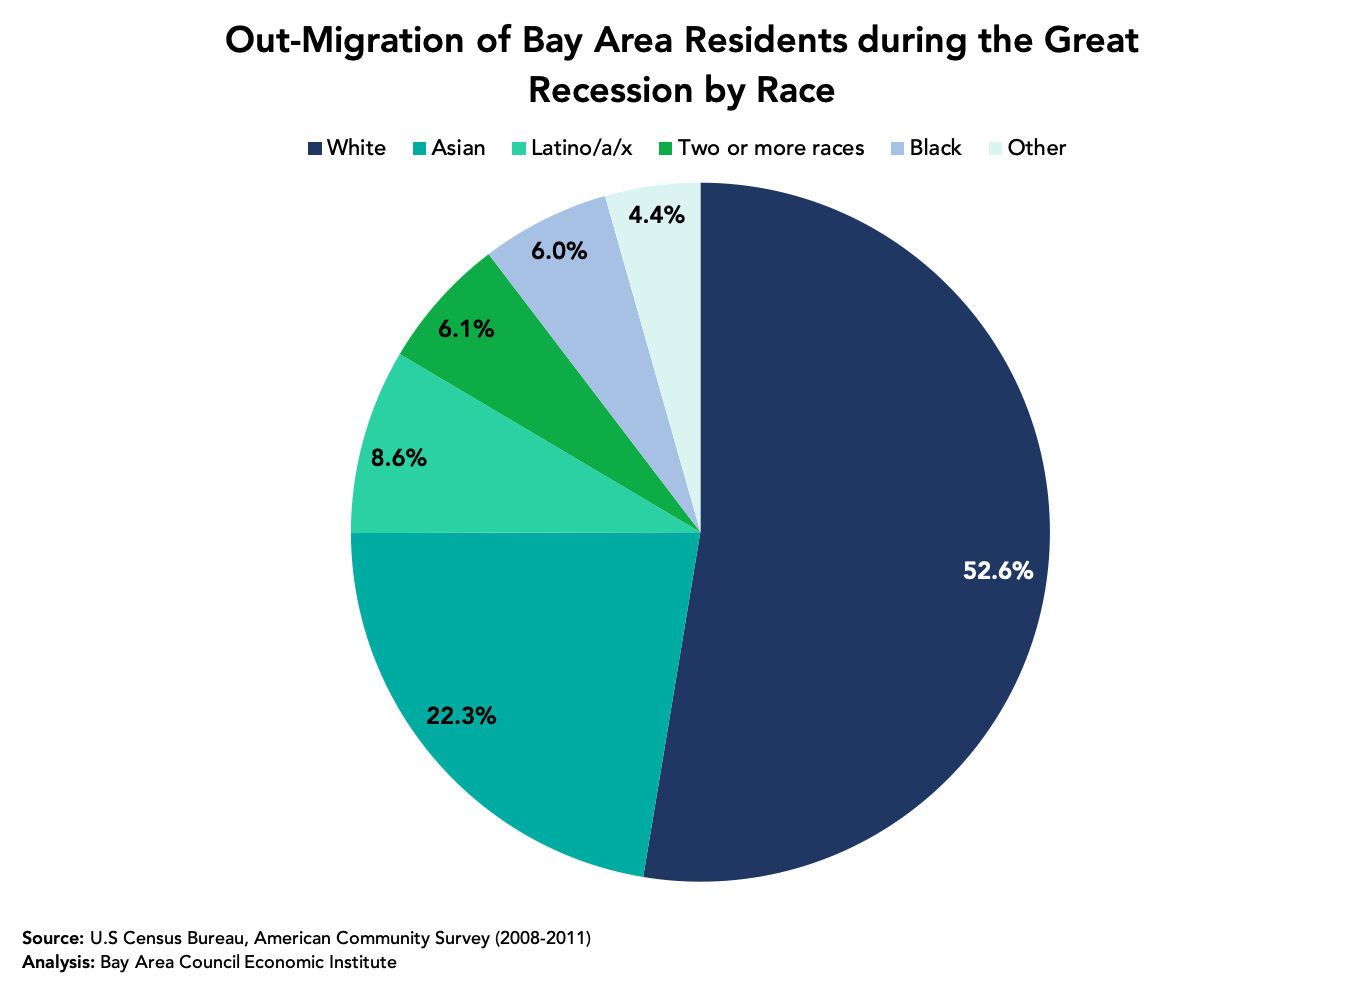
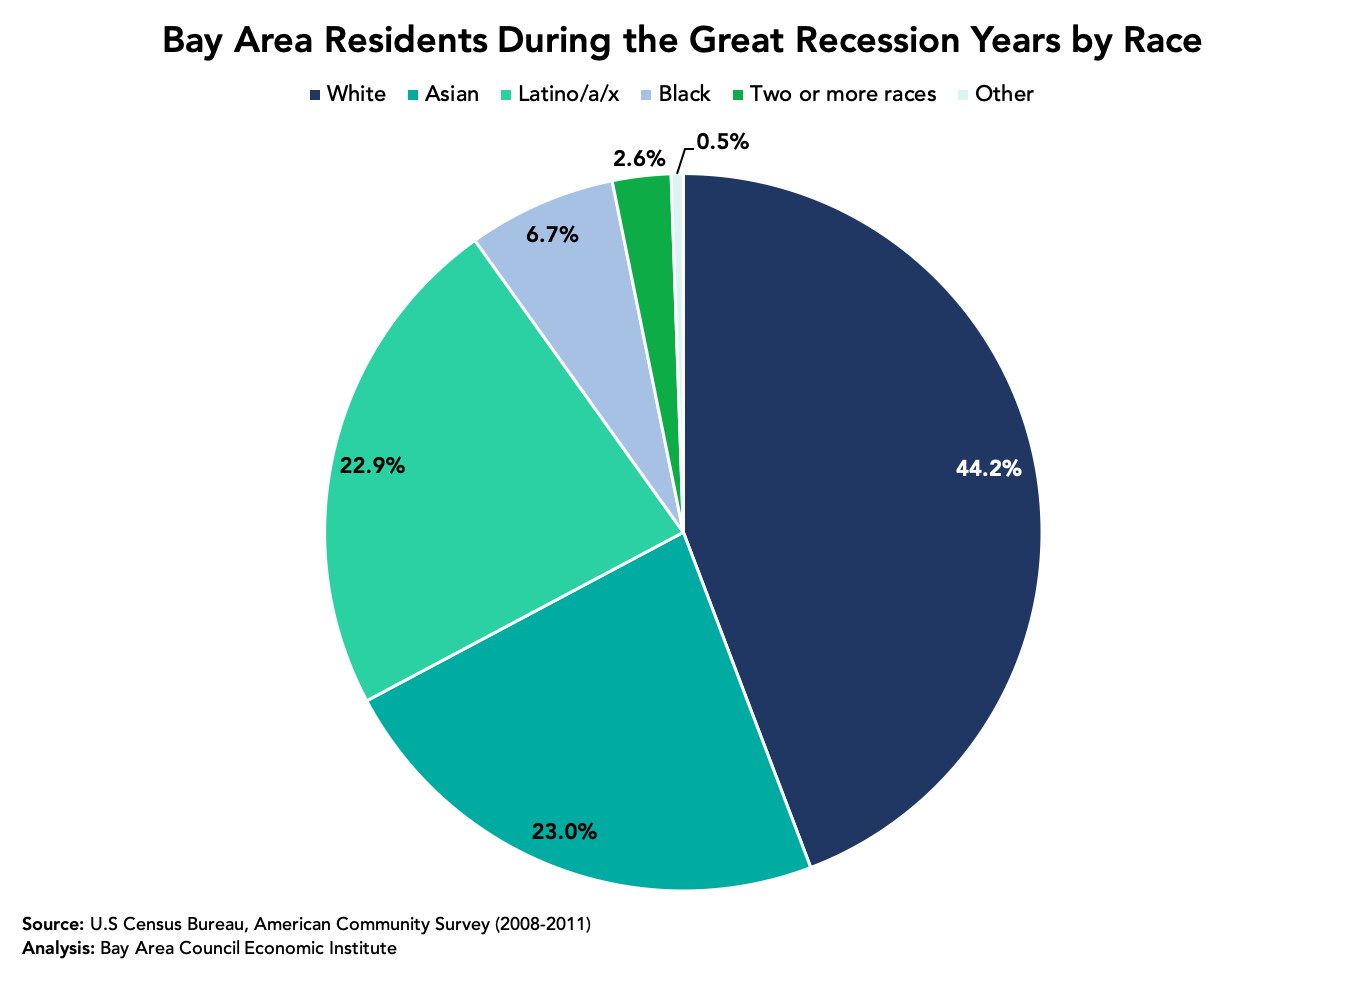
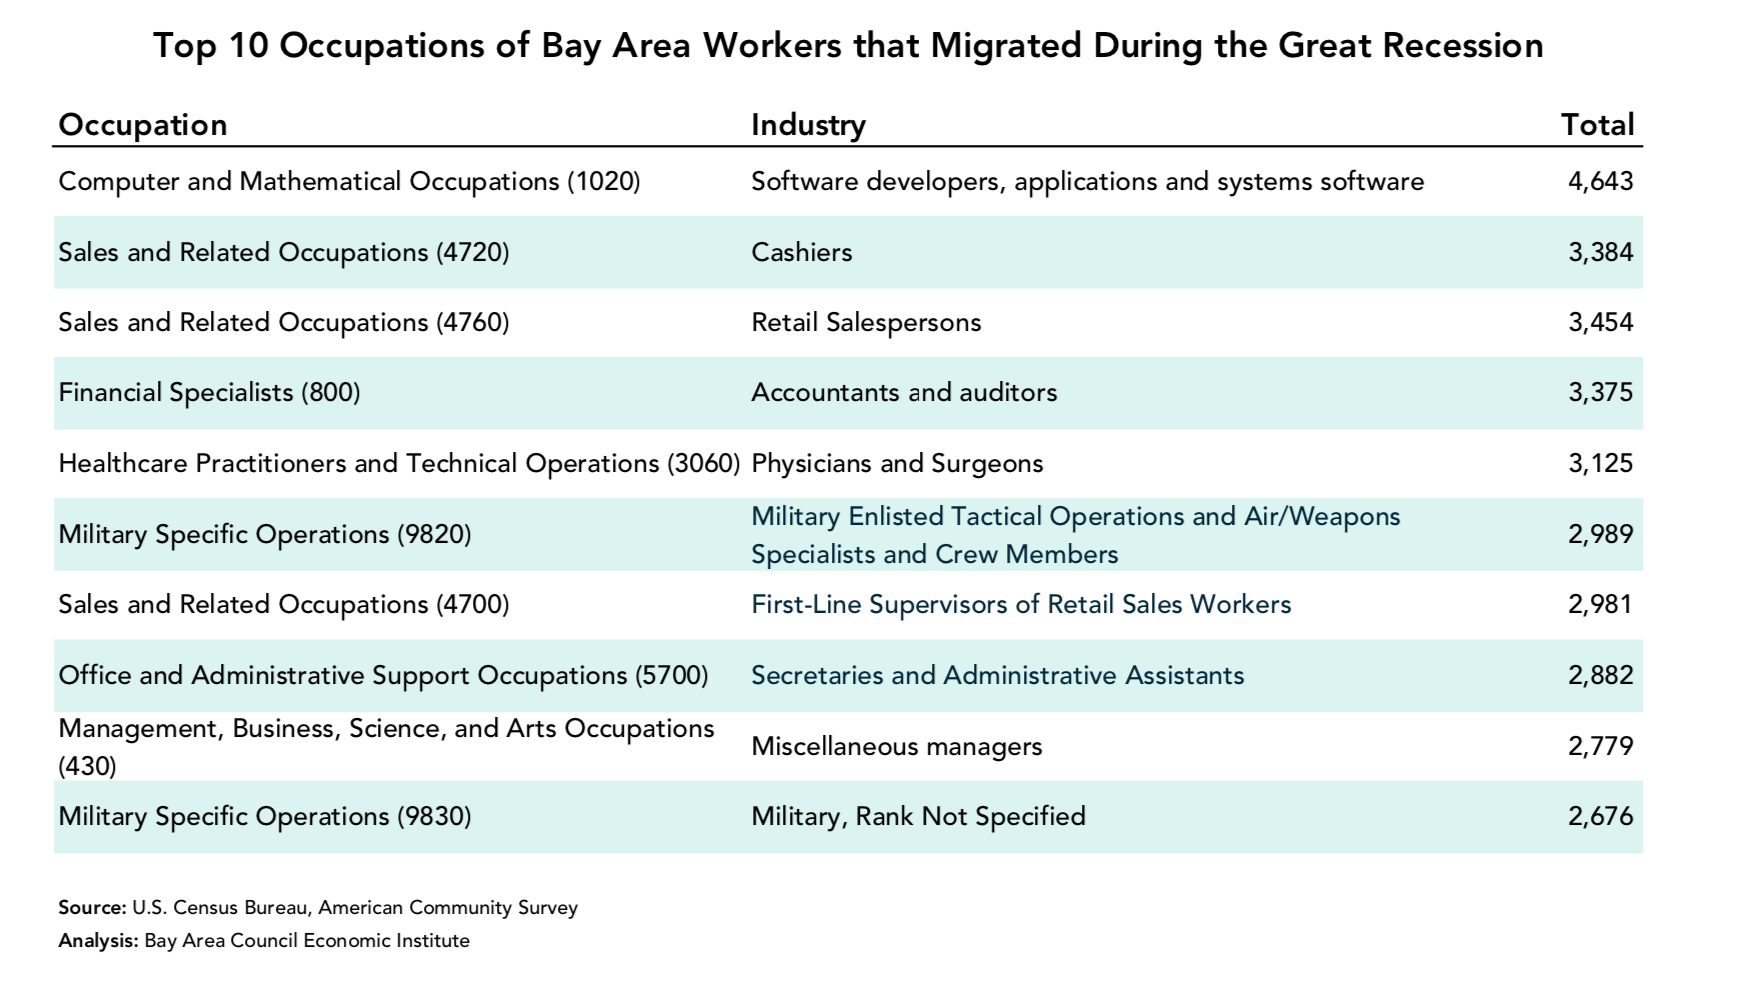
In many ways, regional out-migration data from the Great Recession demonstrates that those most severely affected by the recession ­­– perhaps to the point of relocating – were predominately white, younger residents, many of which held service-sector jobs. At the income level, groups with both high and low household incomes were affected, some perhaps choosing to leave, while others financially forced to. Some of this is already beginning to show itself in our current crisis today: 

According to the U.S. Department of Labor, many new unemployment claims were due to job losses in the accommodation, arts, entertainment, retail trade, food services, and social assistance industries; 

McKinsey & Company’s latest research on jobs shows that up to a third of U.S. jobs are vulnerable to reduced hours, furloughs, or layoffs, with the highest vulnerability found for jobs in the Accommodation and food services industry; and 

Pew Research Center’s latest analysis finds that young people make up 24% of the population of people working in industries most at risk of unemployment. Half of all workers ages 16-24 are employed by service sector jobs. 

Lorem ipsum dolor sit amet, consectetur adipiscing elit. Ut elit tellus, luctus nec ullamcorper mattis, pulvinar dapibus leo.