The Trump administration’s cuts to federal science funding threaten the U.S.’s innovation pipeline, which relies heavily on federally supported research at universities and labs. In this article in the Silicon Valley Business Journal, Dr. Jeff Welser, Chairman of the Bay Area Science and Innovation Consortium (BASIC), and Sean Randolph, Senior Director of the Institute, provide insight into how science and technology will be greatly impacted as a result of these new federal policies.
The Trump administration’s cuts to federal science funding threaten the U.S.’s innovation pipeline, which relies heavily on federally supported research at universities and labs. In this article in the Silicon Valley Business Journal, Dr. Jeff Welser, Chairman of the Bay Area Science and Innovation Consortium (BASIC), and Sean Randolph, Senior Director of the Institute, provide insight into how science and technology will be greatly impacted as a result of these new federal policies.
Recent political and economic decisions, particularly tariffs, have strained relationships with allies like Canada, Mexico, Australia, and European countries, causing diplomatic fallout and economic uncertainty. In this article on Medium.com, Sean Randolph, Senior Director of the Institute, reflects on the declining strength of U.S. global alliances and emphasizes the long-term impacts of dismantling institutions and relationships.
AI is fueling economic recovery in the Bay Area. Chinese AI startup DeepSeek’s open-source R1 model has raised concerns about AI investment, but its energy-efficient and low-cost innovations could accelerate AI adoption. In this San Francisco Business Times article, Sean Randolph, Senior Director of the Institute, highlights how AI’s growing impact across industries, combined with California’s emphasis on workforce training and innovation, will help the region maintain its leadership in the sector.
The Biden’s administration’s support for electric vehicles (EV’s), including tax incentives and funding for charging infrastructure, is being rolled back. In this article in the Silicon Valley Business Journal, Sean Randolph, Senior Director of the Institute, discusses the potential negative impact of the current overhaul of U.S. government policies on the competitiveness of the U.S. electrical vehicle industry.
As a new year begins the San Francisco/Silicon Valley Bay Area’s economy remains consistent with patterns over 2023 and 2022: a mixed story of slow progress in addressing underlying structural challenges, combined with resurgent innovation at the research and business levels. In this article in the Times of India, Sean Randolph, Senior Director of the Institute, details high-level takeaways for the future of the Bay Area’s economy as the regions continues to recover from the pandemic.
The Trump presidency will reshape the United States relationship with the rest of the world. Changes from the current administration will be abrupt, with a long list of campaign promises revolving around ending the war in Ukraine, immigration reform, tariffs, and much more. In this article in the Silicon Valley Business Journal, Sean Randolph, Senior Director of the Institute, puts aside the strategic issues and details early takeaways on the economic side of the incumbent administration.
The worldwide shift of production is fully underway as companies with global operations diversify their sourcing and work to manage risk. A trend for several years, this has become a flow. A less hospitable environment in China and tensions in US-China relations are a driver, but so is the need to reduce dependence on any one country (a problem laid bare by China’s pandemic shutdowns) and a desire to bring production closer to home. In this article in the Silicon Valley Business Journal, Sean Randolph, Senior Director of the Institute, details the three prime destinations for production for the U.S. which include India, Mexico, and Southeast Asia.
As Mexico’s strategic importance to the U.S. grows, its newly elected president, Claudia Sheinbaum, has an opportunity to deepen the economic relationship and with-it prosperity in both countries. In this article in the Silicon Valley Business Journal, Sean Randolph, Senior Director of the Institute, details the vision and what the future can hold between the two nations and the greater North America.
The Asian Pacific Economic Cooperation (APEC) conference was a pivotal event for the Bay Area and San Francisco. With the City in the world spotlight for the first time since the founding of the United Nations in 1945, San Francisco was given the prime opportunity to showcase its strengths and change the doom-loop media narrative. At APEC’s Biden-Xi summit President Xi hailed “the San Francisco Vision” as a reset in the relationship. In this article in the Silicon Valley Business Journal, Sean Randolph, Senior Director of the Institute, describes the vision and what the future can hold between the two nations.
The Asian Pacific Economic Cooperation (APEC) conference that recently concluded was a pivotal event for the Bay Area and San Francisco. With the City in the world spotlight for the first time since the founding of the United Nations in 1945, San Francisco was given the prime opportunity to showcase its strengths and change the doom-loop media narrative. In this article in the Silicon Valley Business Journal, Sean Randolph, Senior Director of the Institute, discusses how the APEC conference all played out.
The significance of India technology innovation and capacity has been growing tremendously, with Silicon Valley at the heart of that change. In this video, Sean Randolph, Senior Director of the Institute, recorded this program with the India Dialog program at Stanford, sponsored by the India Institute of Competitiveness and Stanford’s US-Asia Technology Management Center to discuss the connections of the Bay Area with India.
September 20, 2023
With the recent collapse of Silicon Valley Bank, most would say that the bank is dead and gone, however, SVB is very much alive and open for business. In this article in the Silicon Valley Business Journal, Sean Randolph, Senior Director of the Institute, discusses the changes and ongoing operations at SVB, which is good news for the Silicon Valley and the Bay Area.
June’s meeting between U.S. President Biden and India’s Prime Minister Modi advanced the U.S.-India connection to a new level. While the relationship falls short of an actual alliance and India and the U.S. may often differ, the alignment of national interests continues to deepen. In this article in the Times of India, Sean Randolph, Senior Director of the Institute, discusses the scope and breadth of cooperative agreements, mostly centered around technology, which has played an increasingly important role in the relationship
Europe and the United States are allies, collaborators — and competitors. Today, it is increasingly important that Europe and the United States look beyond competition to align their policies and capabilities around shared strategic goals. In this article in the SF Business Times, Sean Randolph, Senior Director of the Institute, examines these connections and details why Europe and the U.S. don’t see eye-to-eye on technology regulation, which is ultimately hurting both
India’s economic ties to the San Francisco/Silicon Bay Area are continuing to grow, led by the dramatic acceleration of India’s digital economy, the maturing and growth of its startup environment and the deepening geostrategic alignment between India and the U.S. In this article in the Silicon Valley Business Journal, Sean Randolph, Senior Director of the Institute, examines these connections and one of the greatest economic opportunities of the next decade.
India’s economic ties to the San Francisco/Silicon Bay Area are continuing to grow, led by reform and growth in India, Silicon Valley’s global reach, and geostrategic alignment between India and the US. These ties have been building for some time. What’s new, however, is the acceleration. In this article in the SF Business Times, Sean Randolph, Senior Director of the Institute, examines these connections and the broad range of opportunities in fintech, edtech, pharmaceuticals, healthtech, renewable energy, electrical vehicles, semiconductors, smart infrastructure, and space.
As part of the United States’ 2023 Asia-Pacific Economic Cooperation (APEC) Host Year, San Francisco will host APEC’s Economic Leaders Week and the CEO Summit in November 2023. The meetings will enable meaningful engagement on open trade and investment, resilience, economic inclusion, sustainable economic growth and digital transformation across the Asia-Pacific. In this article in the SF Business Times, Sean Randolph, Senior Director of the Institute, examines the opportunity for San Francisco to rehabilitate its global image.
U.S.-China tensions, supply chain vulnerabilities, reshoring, and other trends present a window of opportunity for North America. In this article in the SF Business Times, Sean Randolph, Senior Director of the Institute, examines the potential for North America if the U.S., Canada and Mexico can seize it.
With the City of San Francisco’s recovery lagging behind other major U.S. cities, could an innovation hub in downtown San Francisco be modeled after a Canadian city? In particular, Toronto? In this article in the SF Business Times, Jim Wunderman, President and CEO of the Bay Area, and Sean Randolph, Senior Director of the Institute, examine the possibilities and feasibilities of converting the City into an official innovation hub.
Between extended economic shutdowns to combat the COVID-19 pandemic, work-from-home policies employed by Bay Area businesses, and a sharp reduction in travel, the region’s downtown cores have experienced a hollowing out of economic activity. As the region recovers, it has become clear that the pandemic has permanently changed how and where people work, how businesses think about their location decisions, and where households choose to live. These effects appear to be most visible in expensive coastal regions, including the San Francisco Bay Area.
To evaluate and track key indicators of economic recovery in the Bay Area, the Bay Area Council Economic Institute and CBRE’s Tech Insights Center are partnering on a three-year, three-part series of interactive reports. The first part of this analysis, published below, tracks jobs, people, investment, economic activity, and affordability measured by 1) an economic index tracking recovery across the nation’s 25 largest regions, and 2) a deeper dive into our region’s economic recovery.
Regional Economic Recovery Index
To better understand how our region fared compared to peer regions, we scored metropolitan statistical areas (MSAs) on 15 different datapoints across 5 different metrics: Jobs, People, Investment, EconomicActivity, and Affordability. Twenty-five regions were selected based on the size of their 2020 regional gross domestic product (GDP), a typical measure of the size of a region’s economy. For a full list of regions and their GDPs, and a detailed list of metrics that went into the index, check out our data and methodology section.
Each region was scored by taking percentile ranks (wherein 0 is the lowest rank, 100 is the highest) of 14 different metrics. Austin scored 100 in the People category, meaning it had the highest rate of both population growth and labor force growth, the two metrics in that category. San Diego, San Jose, San Francisco, and Los Angeles all scored the lowest because they experienced the greatest population and labor force losses given their pre-pandemic levels.
Austin, Texas ranked first across the 25 regions in our study, scoring an average of 92.8 (out of 100) across the 15 metrics we evaluated. Within these metrics, it ranked first (100/100) on 10 metrics: job growth, “knowledge worker” growth, growth in job postings, growth in “computer and mathematical” job postings, population growth, labor force growth, net absorption, new housing units per capita, sales tax revenue growth, and air travel growth. These figures speak to the dramatic resilience and growth Austin, and Texas as a whole, experienced during the pandemic, while coastal cities like San Francisco and New York continue to suffer losses.
For questions about this project, please contact Abby Raisz, Research Manager at the Bay Area Council Economic Institute at araisz@bayareacouncil.org.
Check out the topic areas:
Jobs
People
Costs
Economic Activity
Investment
What’s Next
December 21, 2022
The highlights:
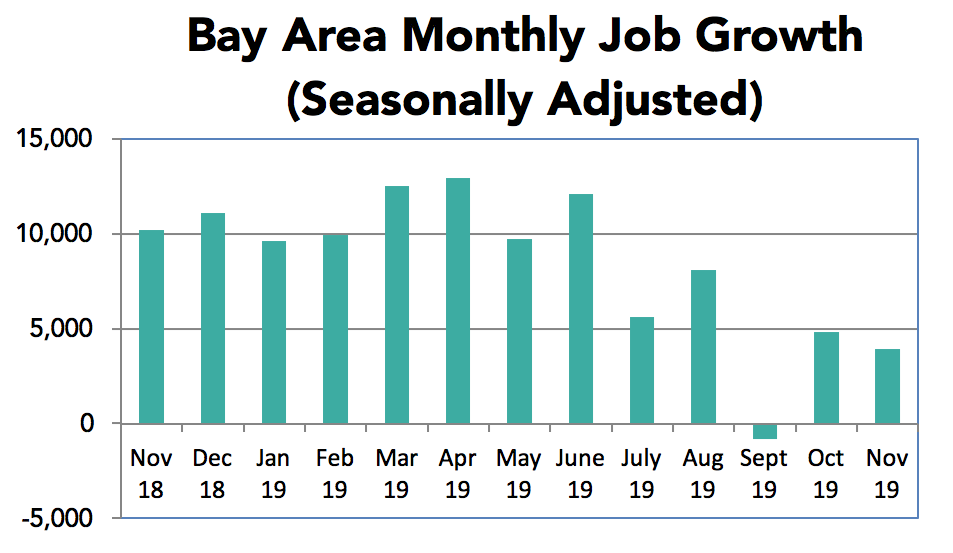
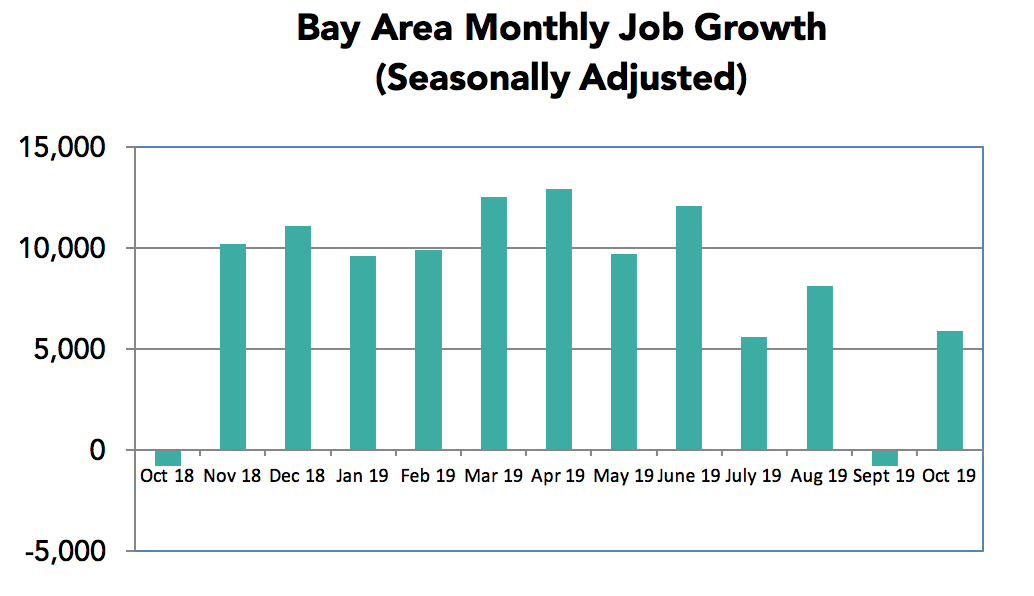
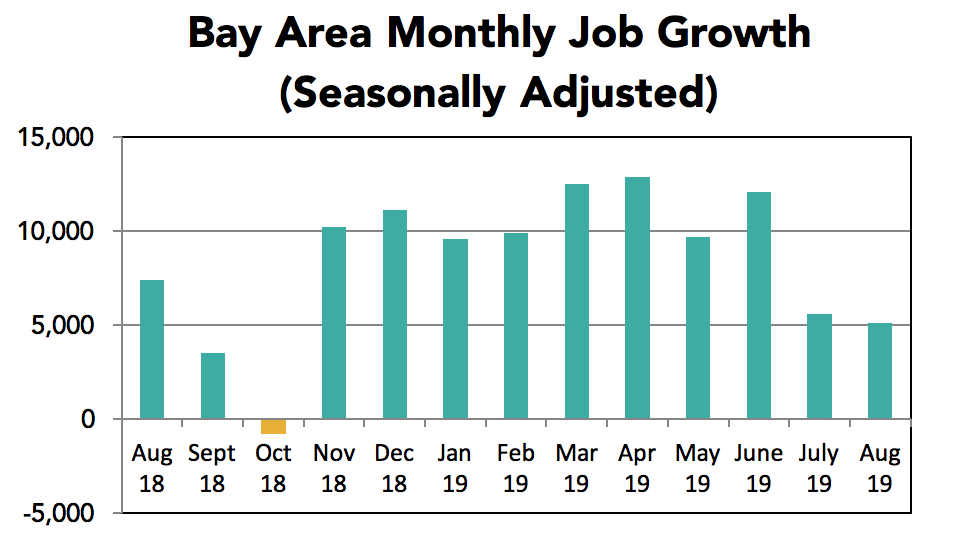
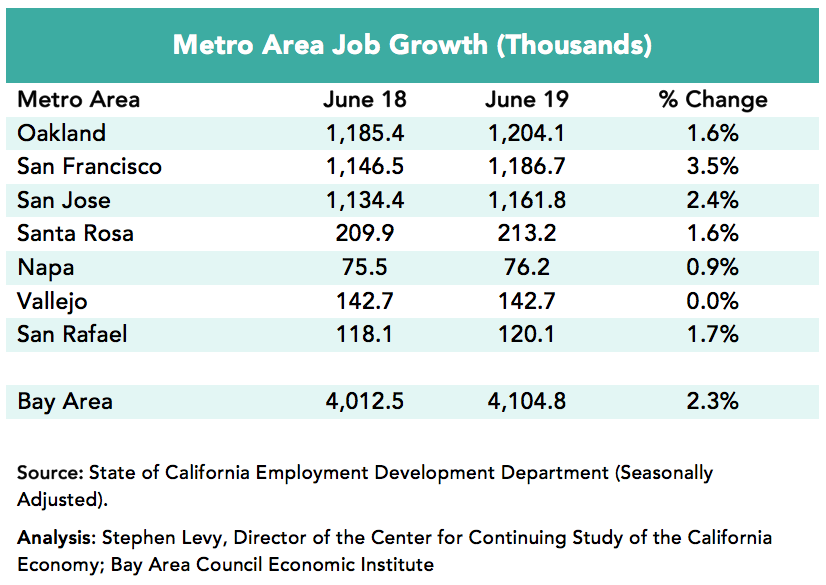
• The Bay Area added 7,400 jobs in November. The household survey, on the other hand, showed rising unemployment rates and a drop in the region’s workforce.
• Both the region and state showed conflicting trends between the jobs survey (up) and the household survey with rising unemployment and a decline in the labor force.
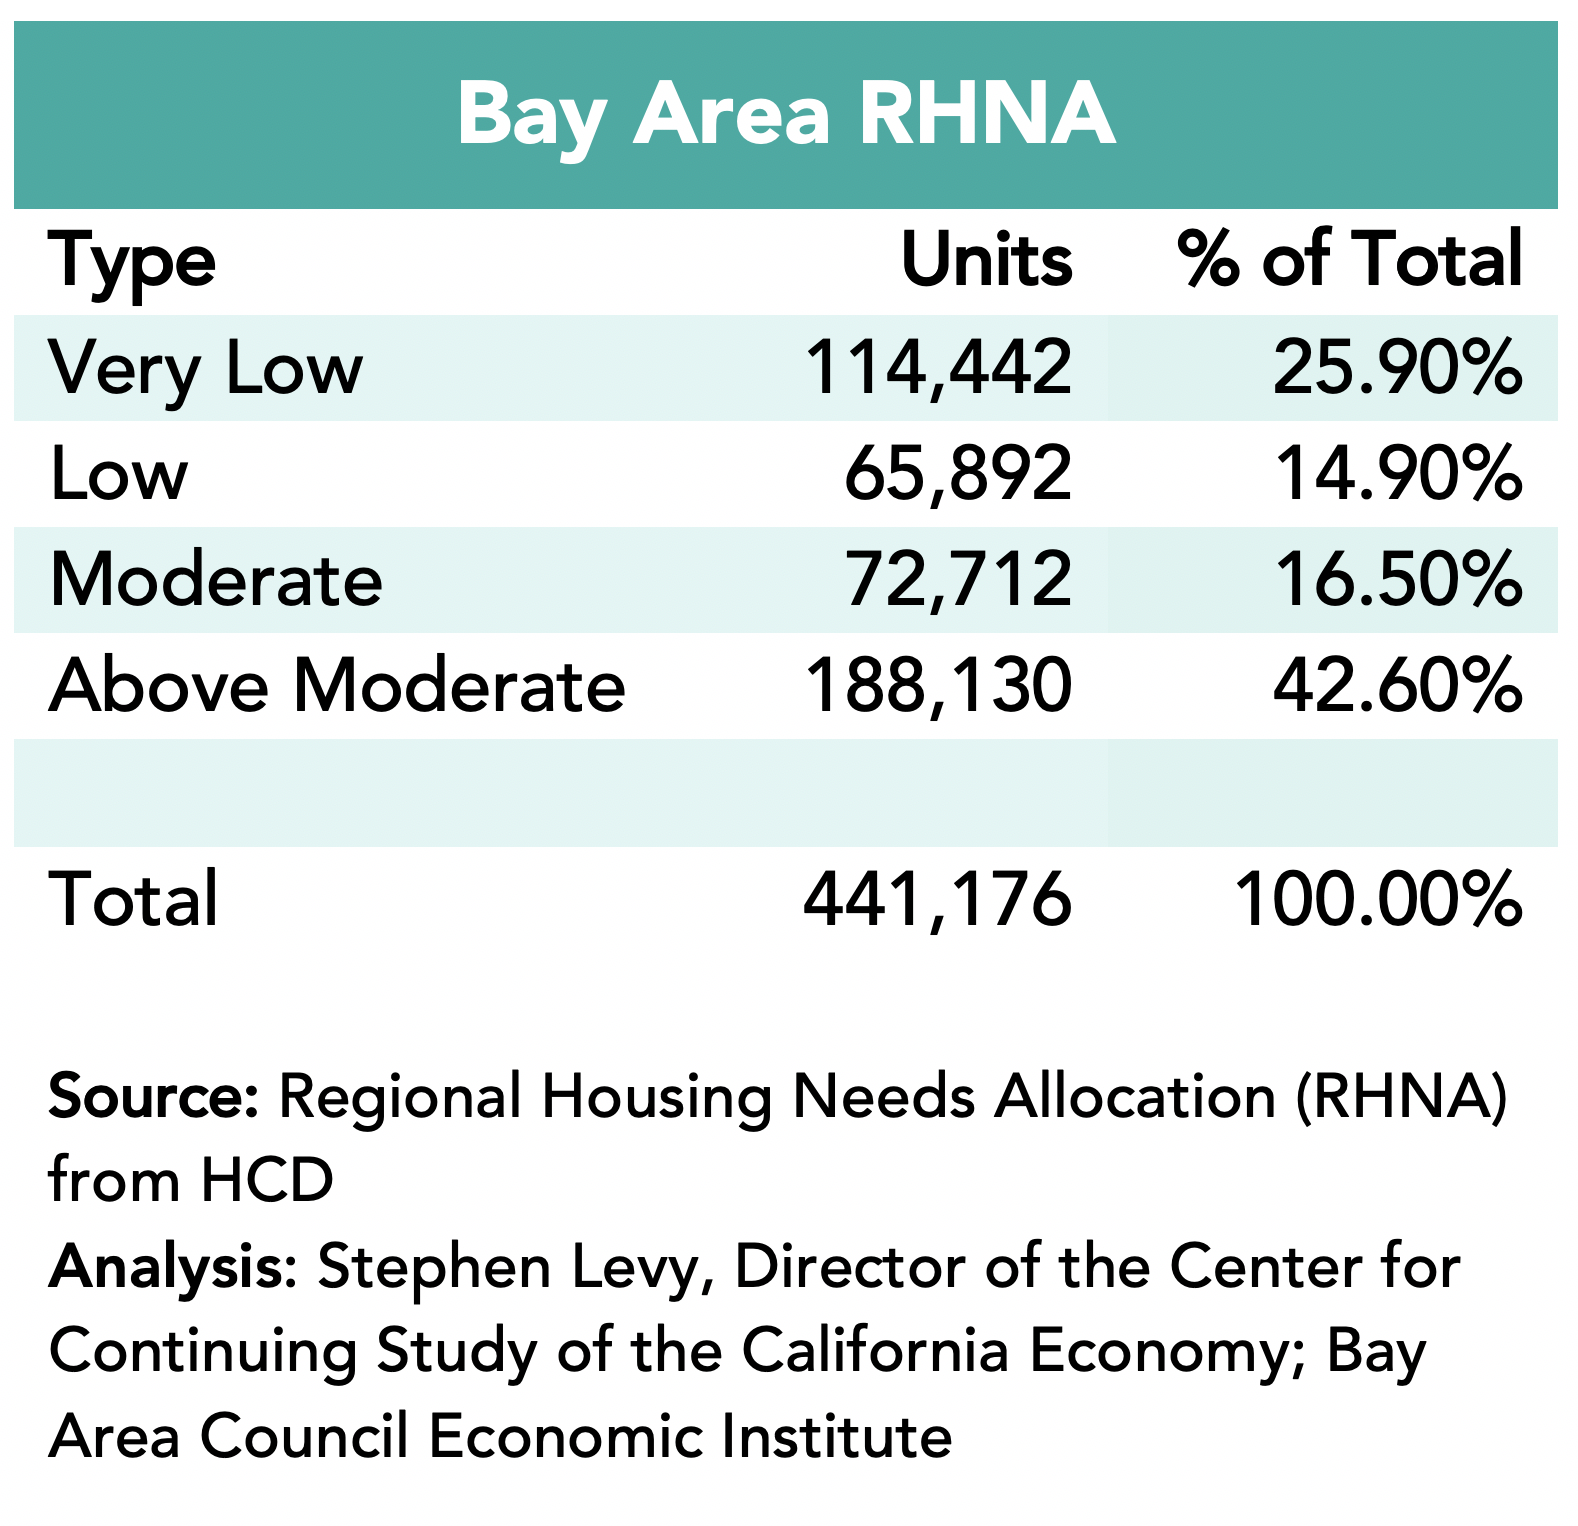
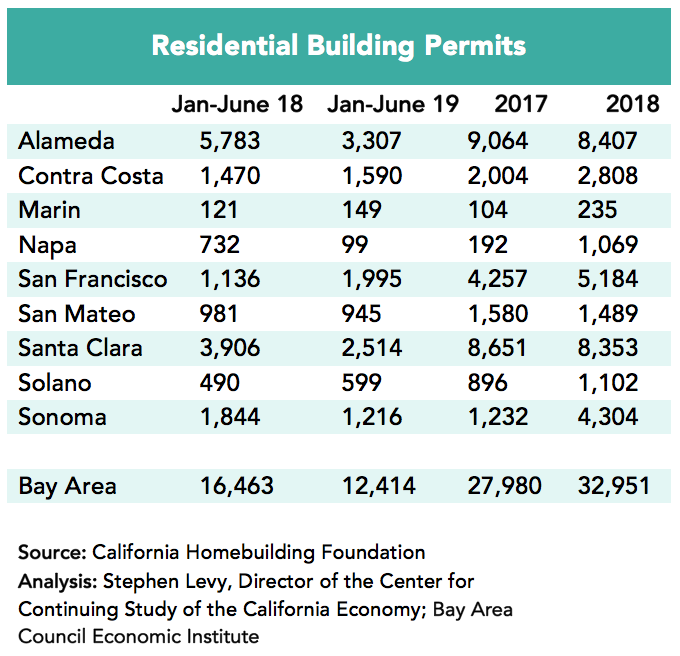
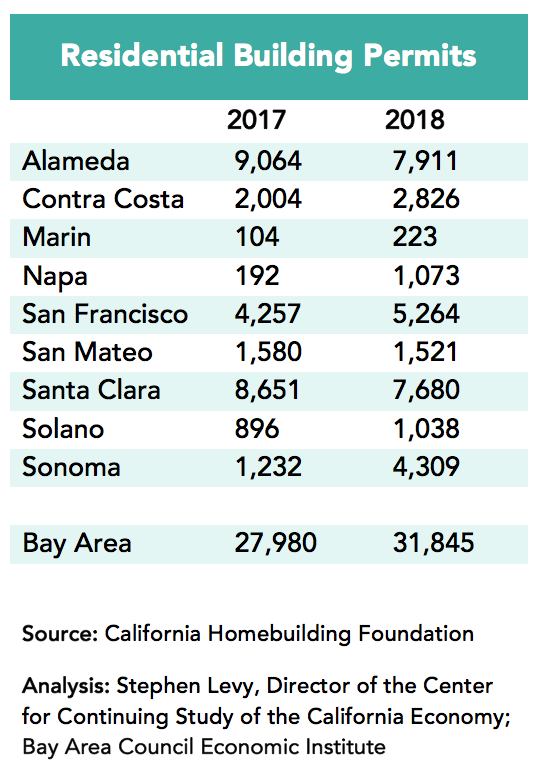
• Housing permits for the first ten months of the year surpassed both 2021 and 2019 levels though still well below the region’s new RHNA targets
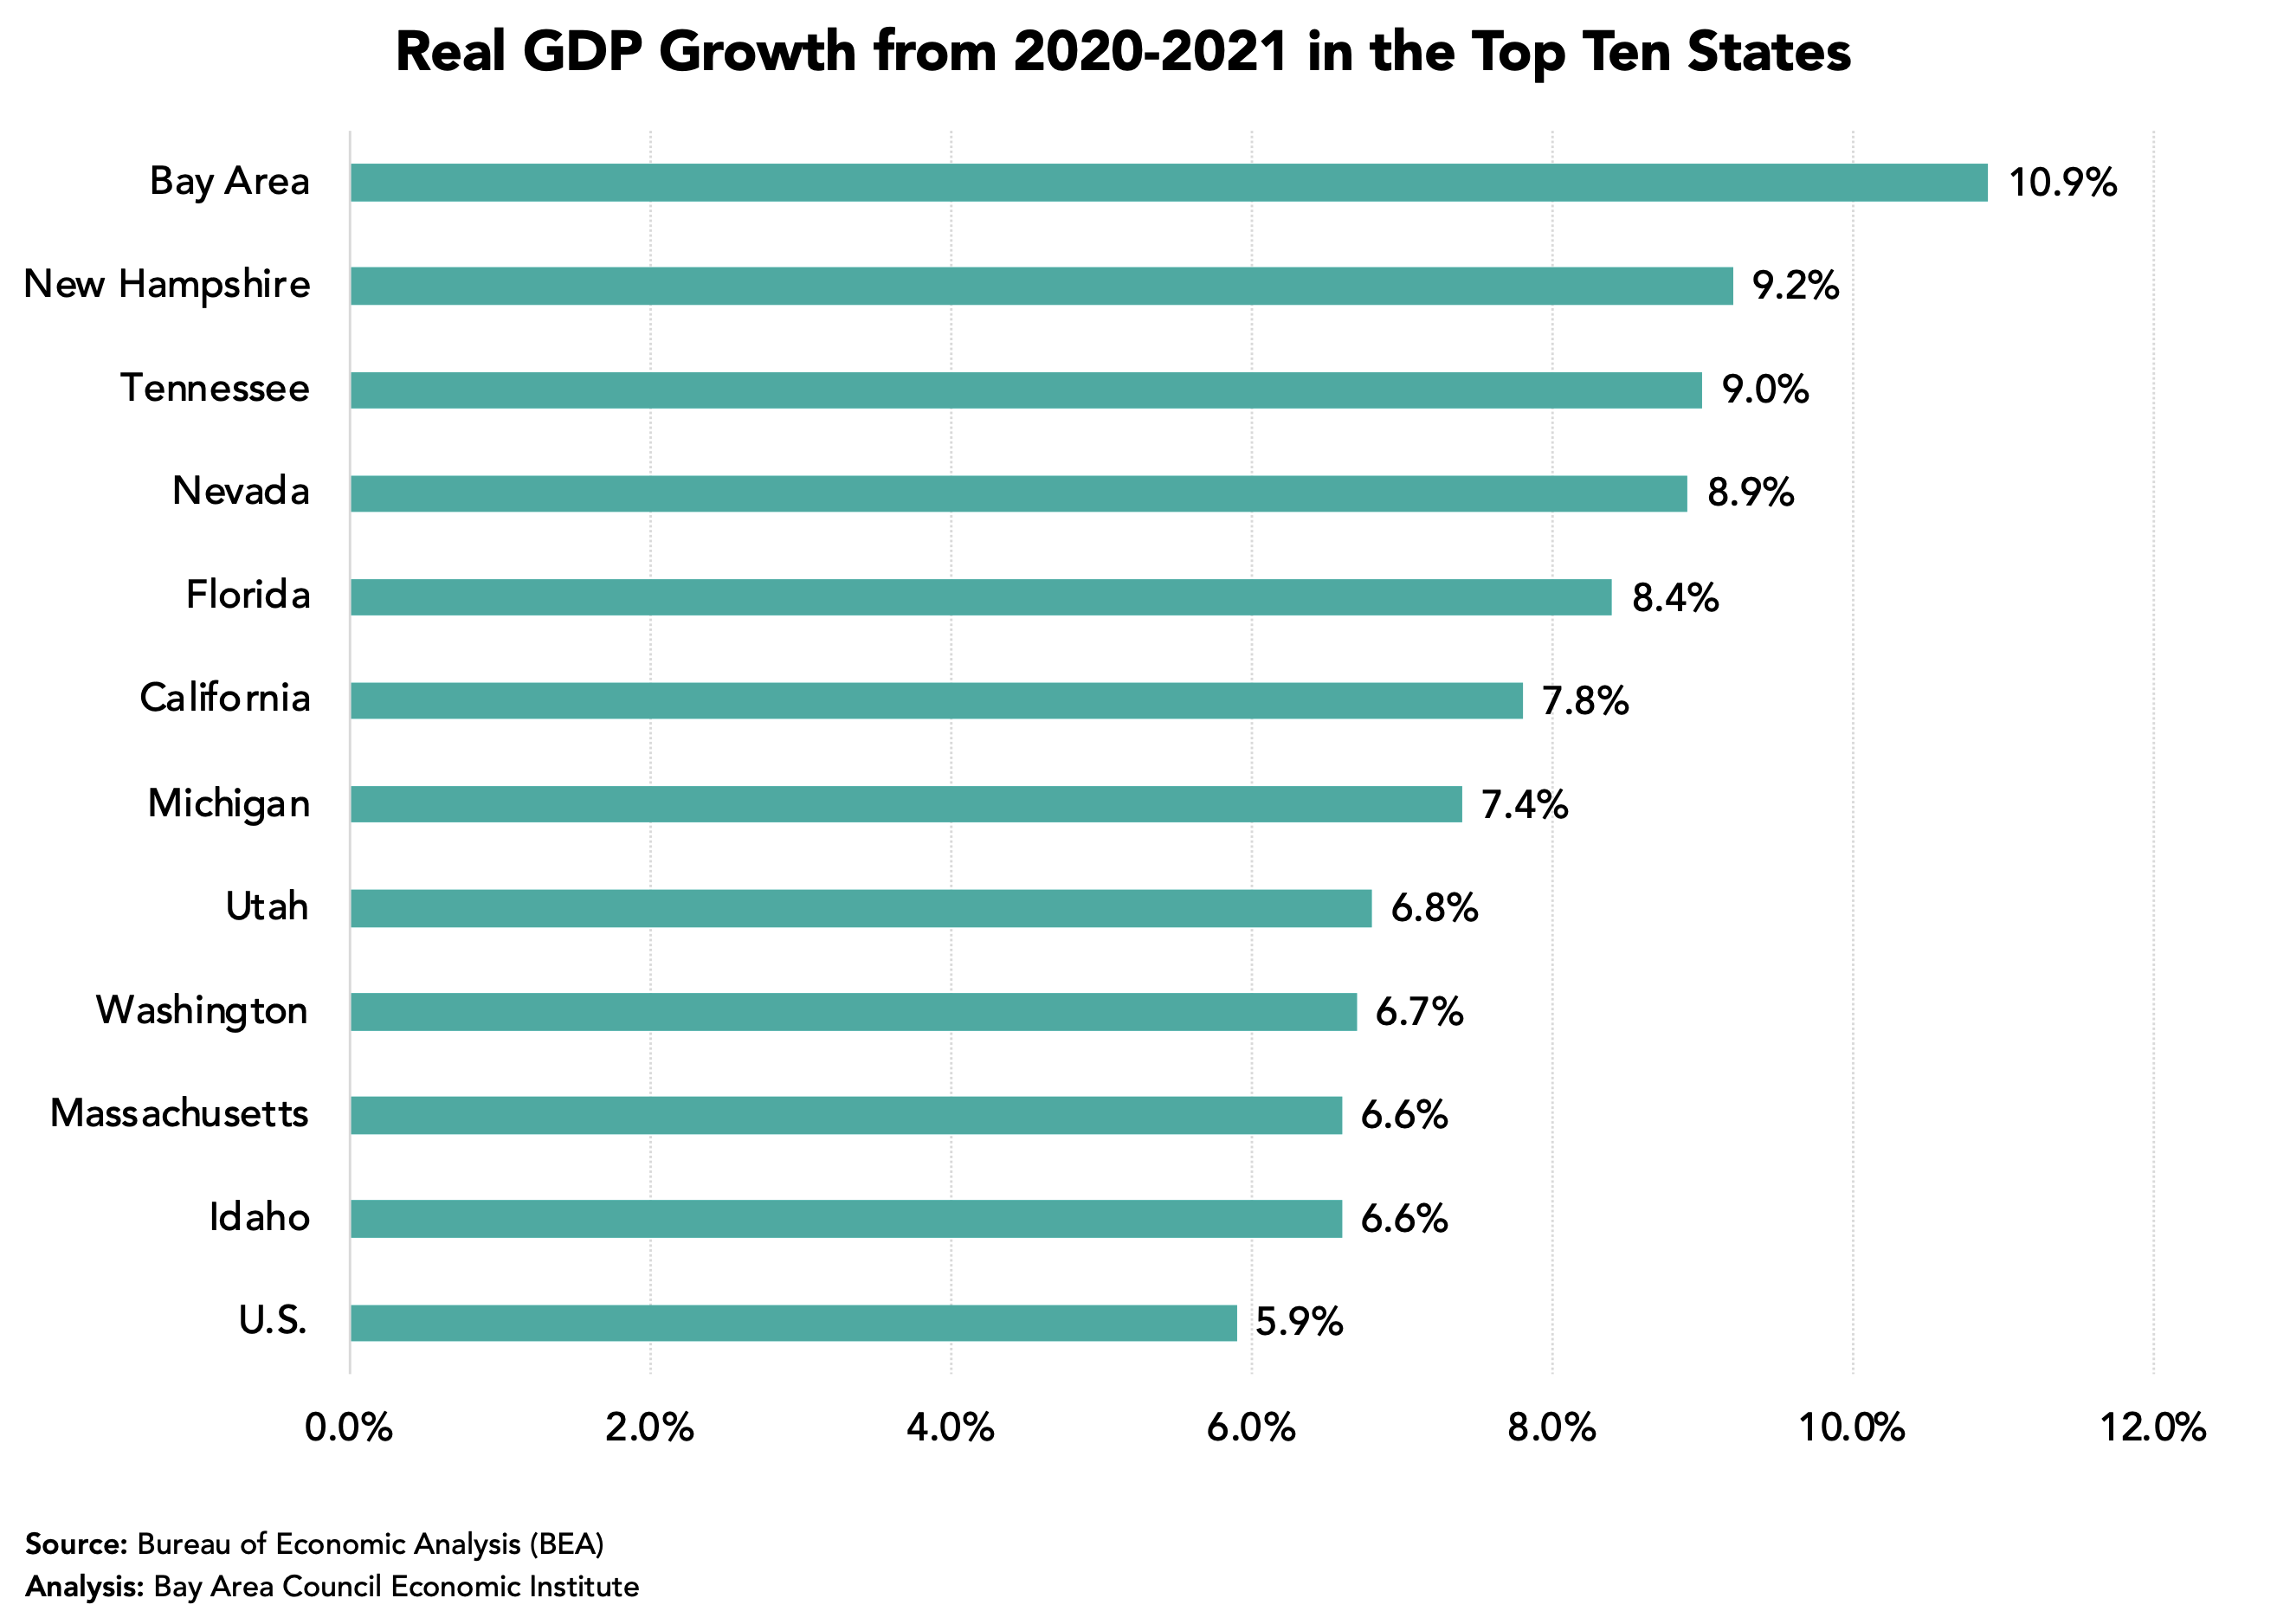
• Bay Area GDP surged in 2021 with gains throughout the region with growth faster than all states and the nation.
• The challenges of high inflation and interest rates remain as well the Bay Area challenges of housing, transportation and supporting competitiveness.
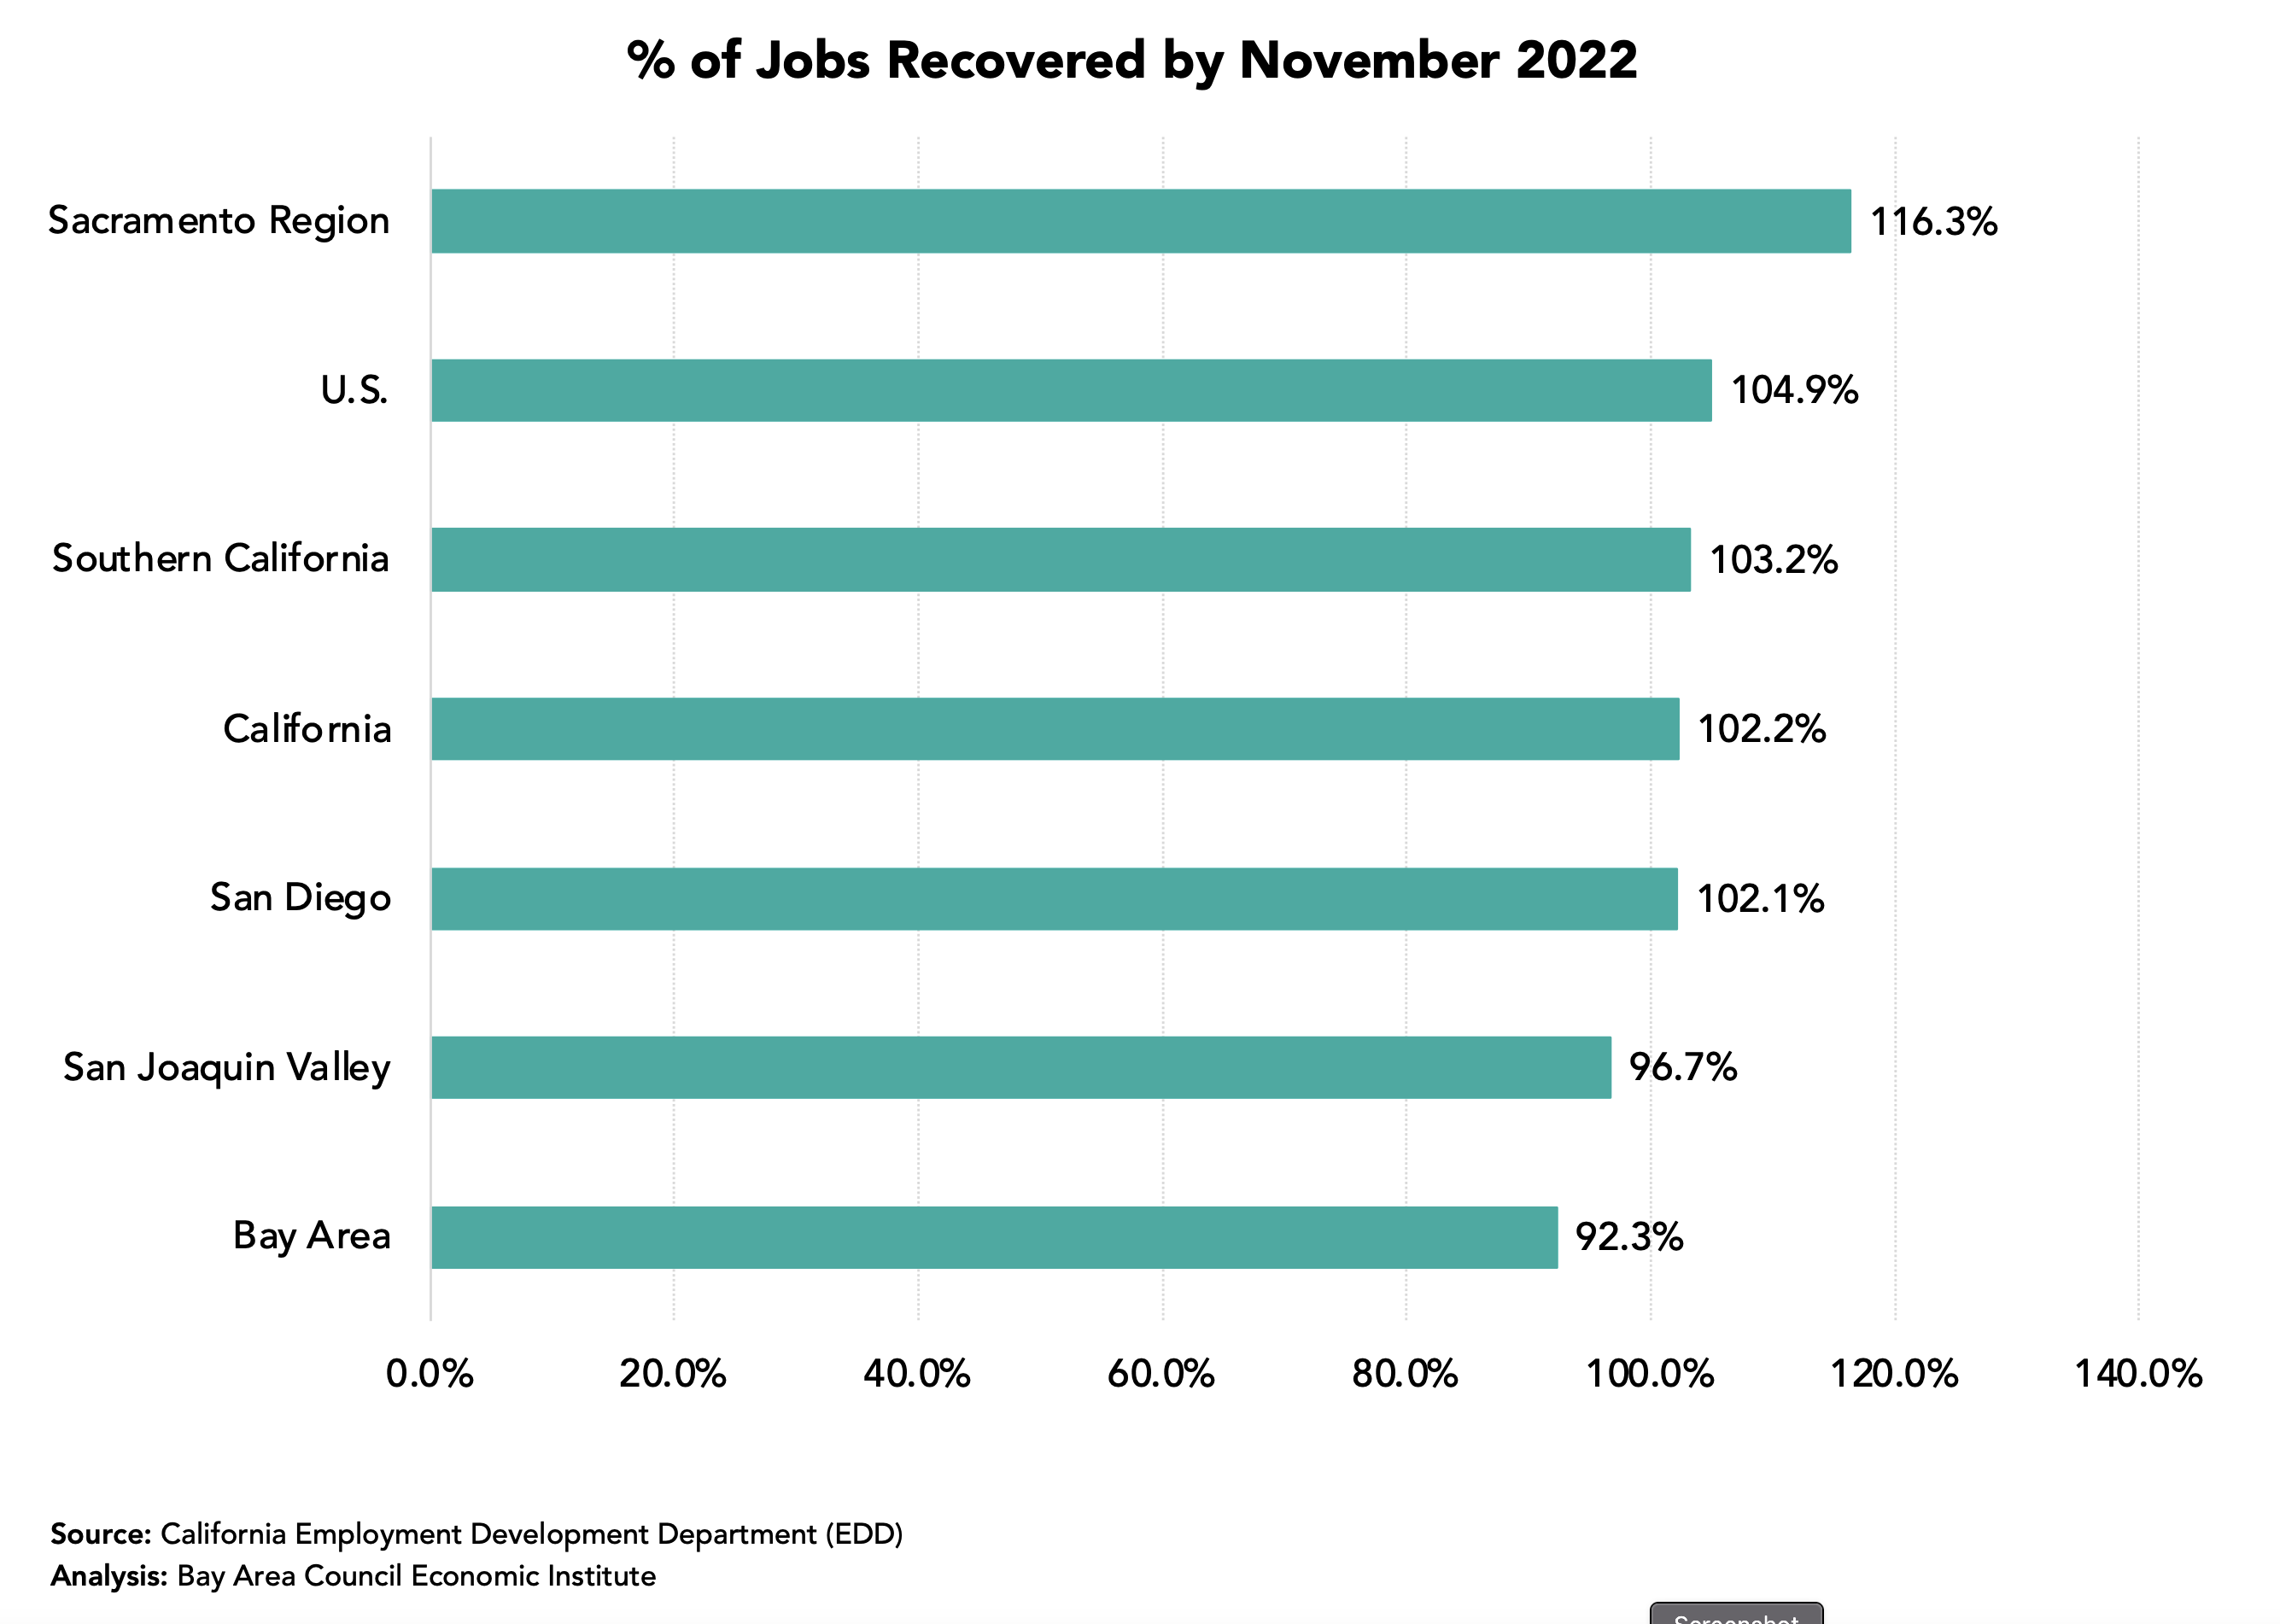
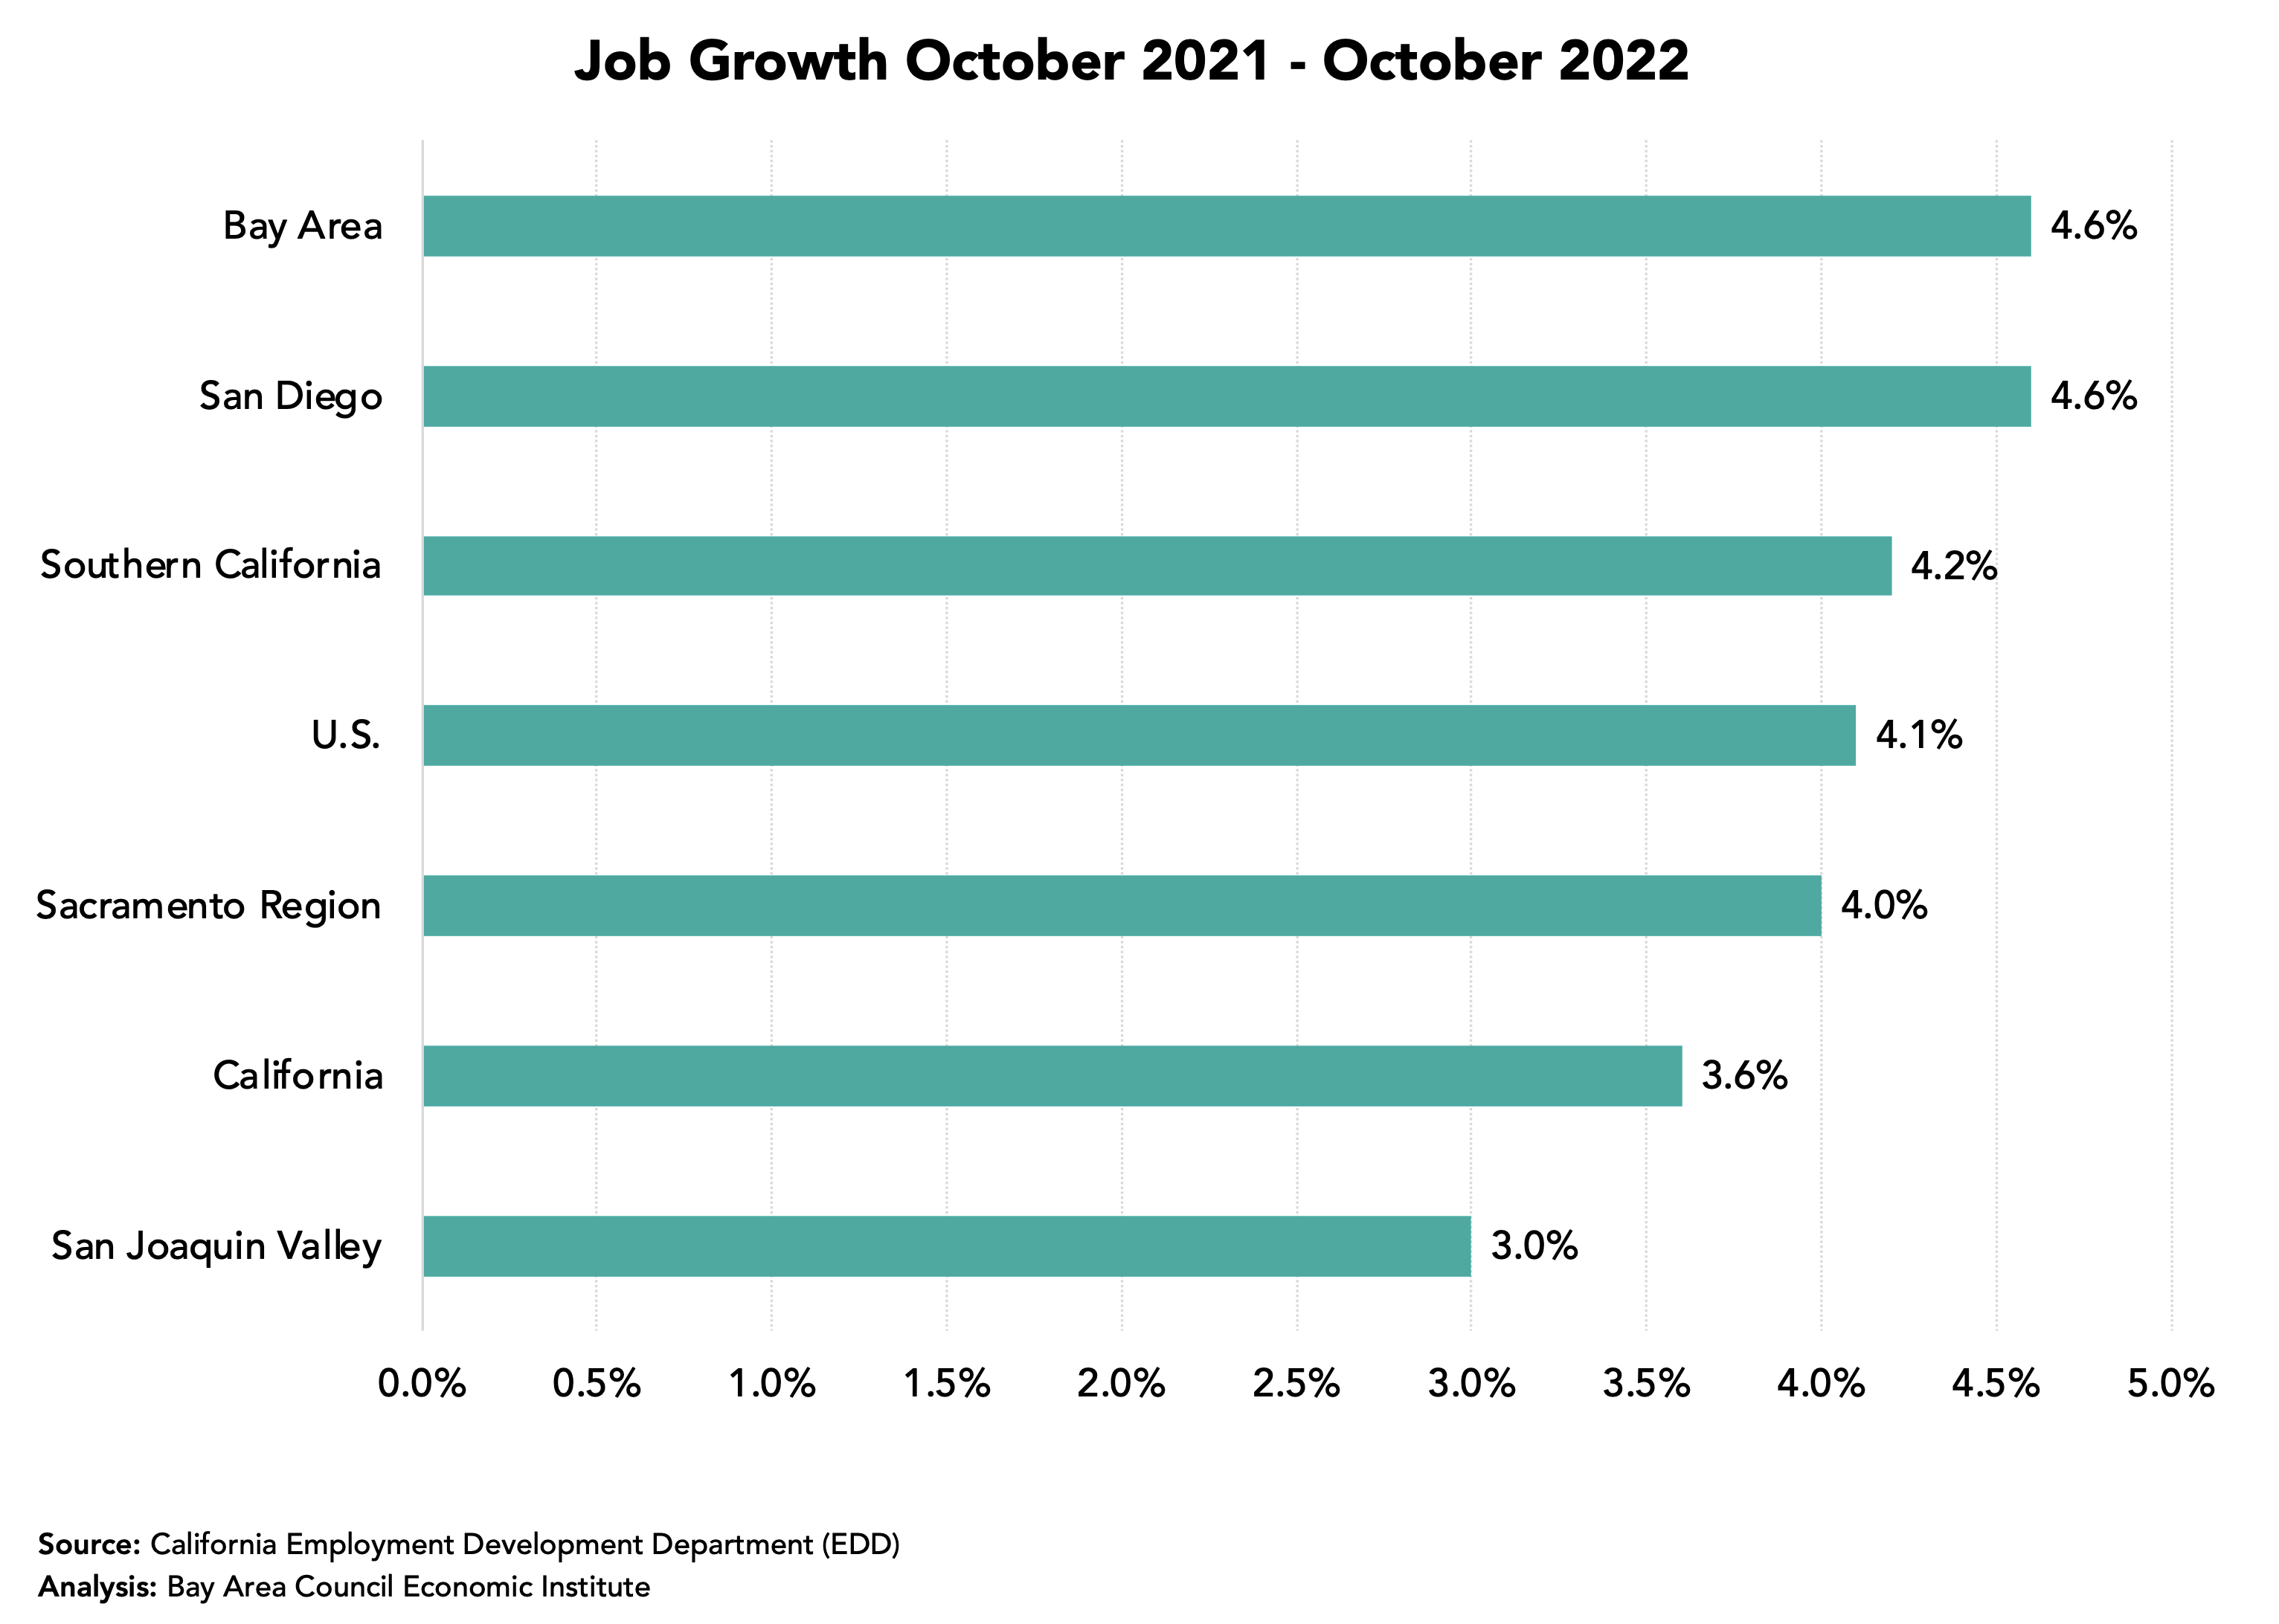
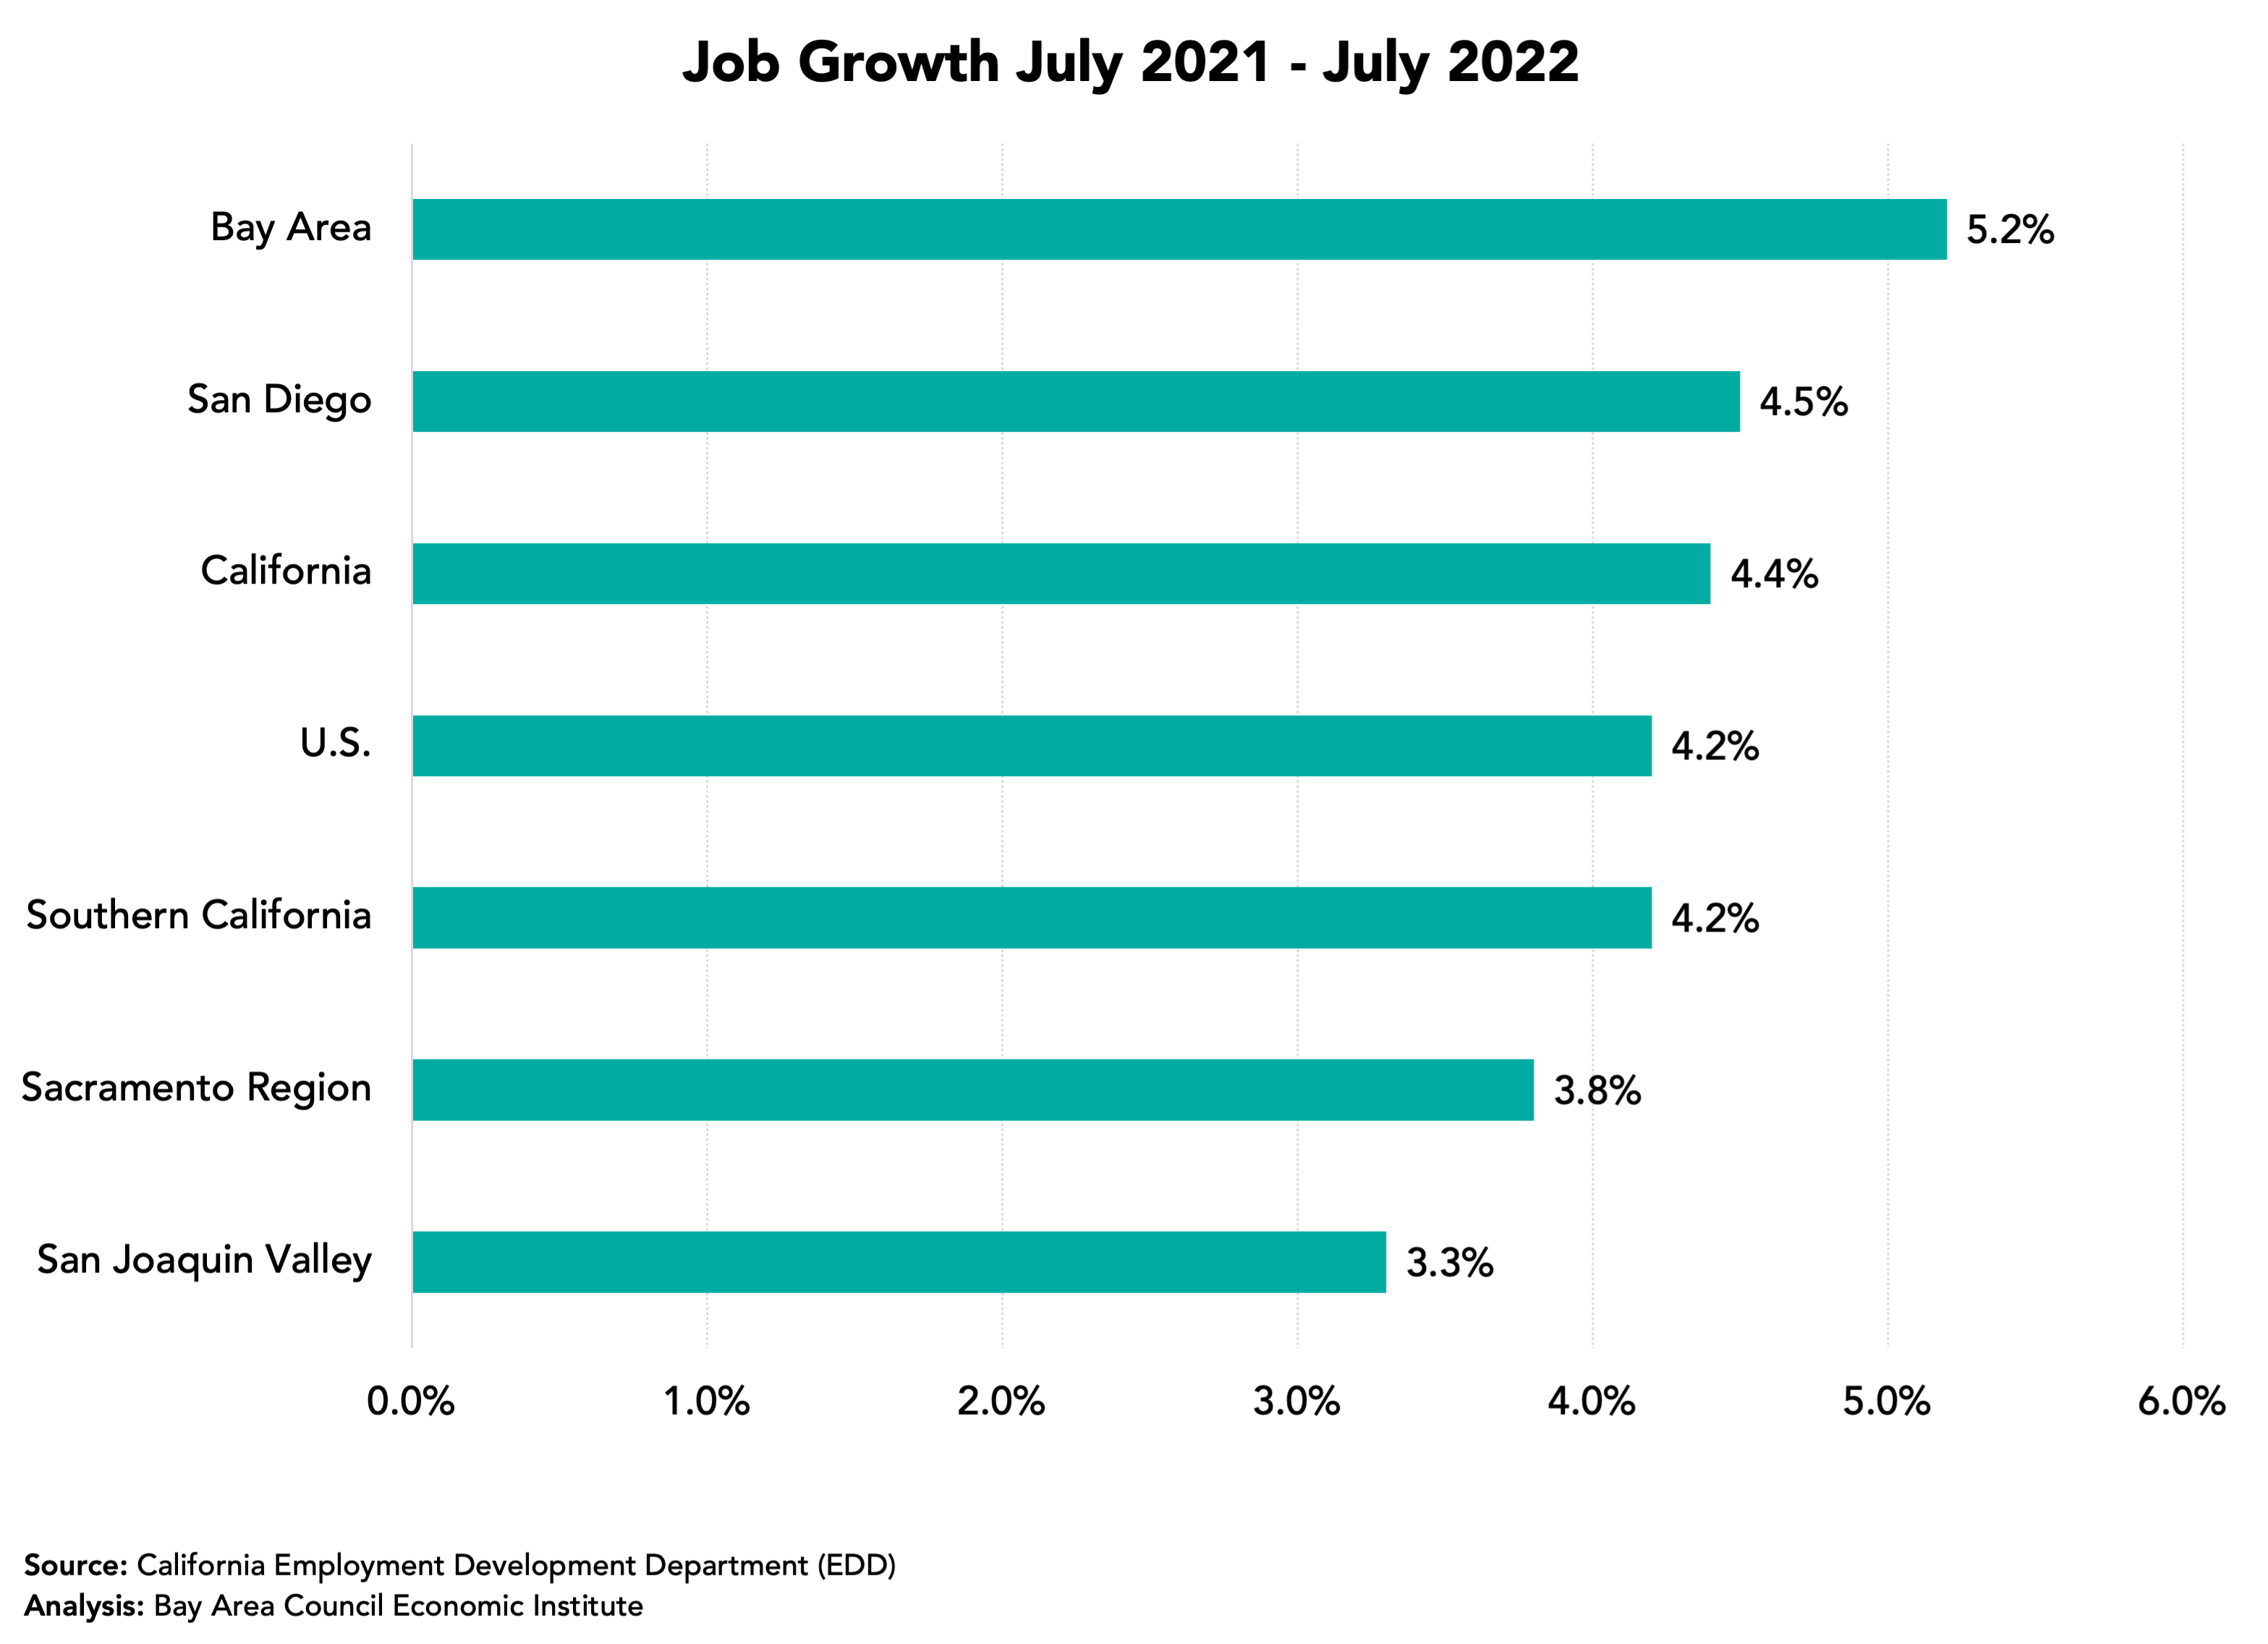
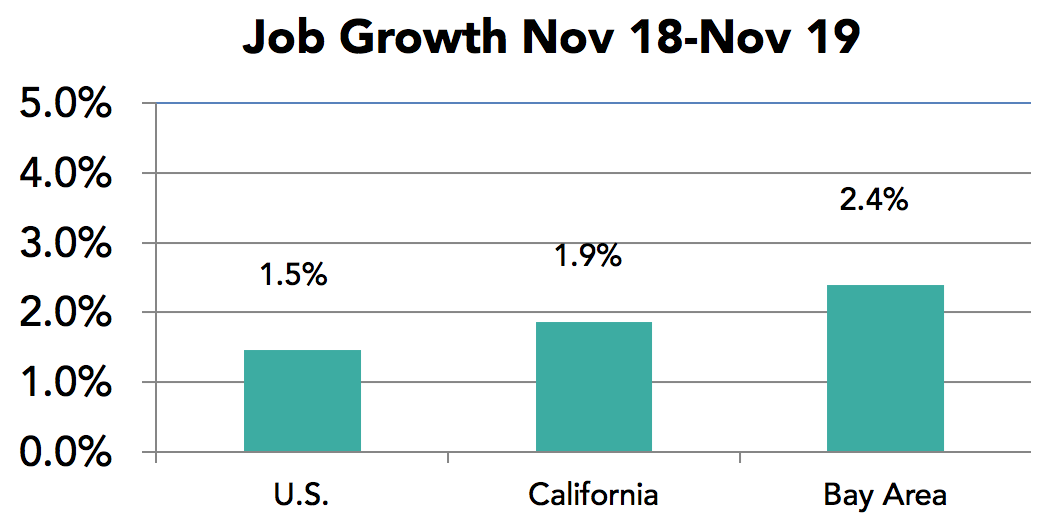
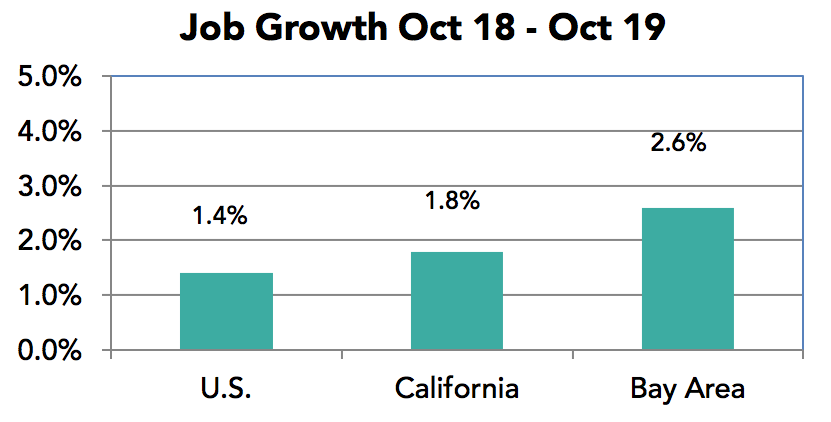
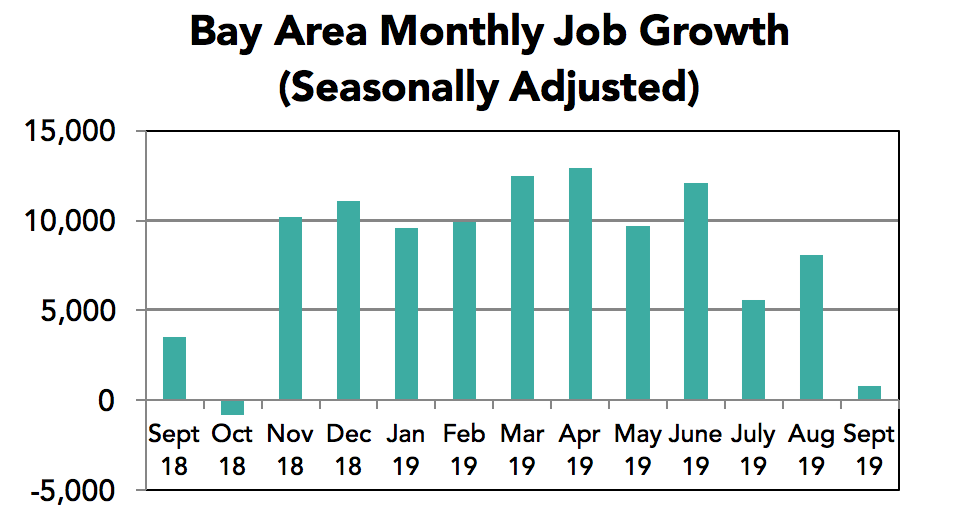
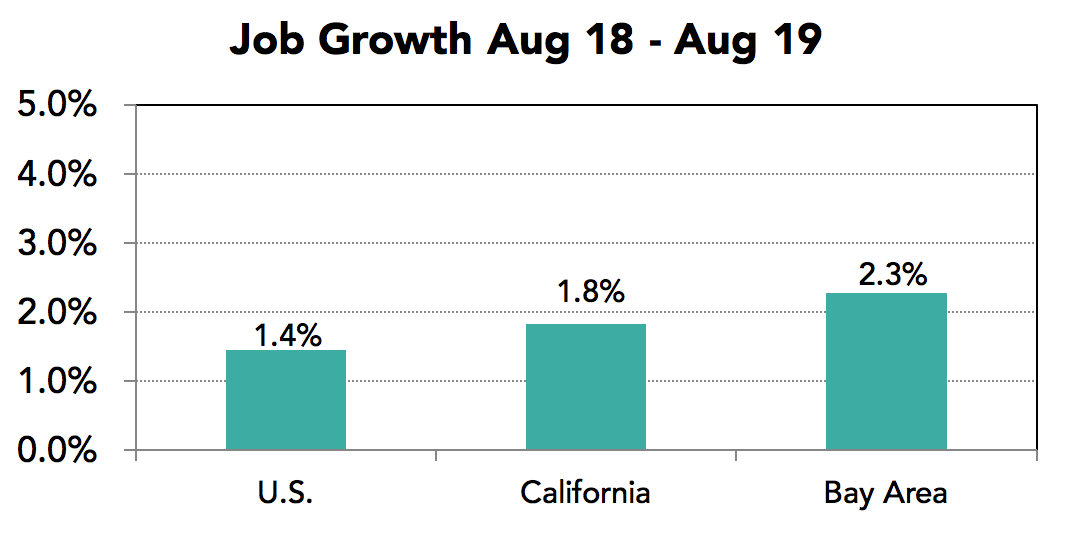
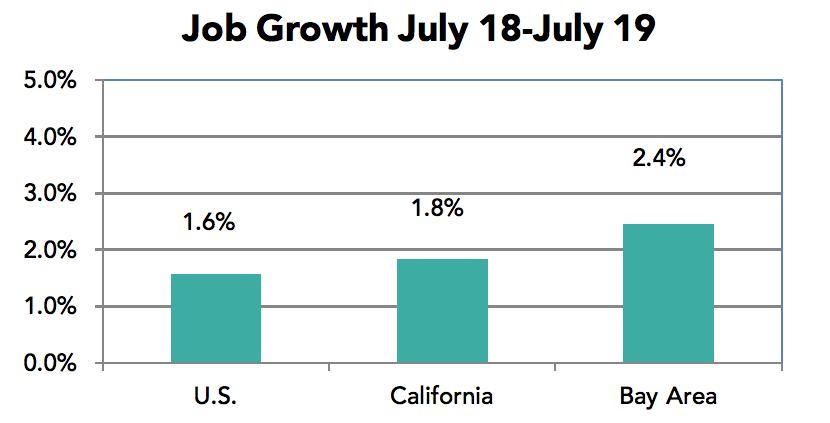
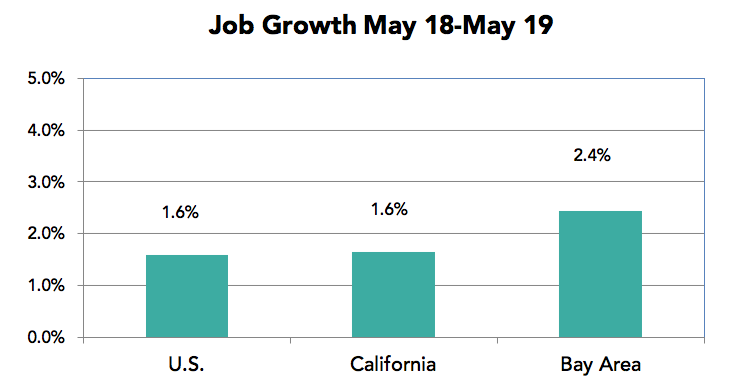
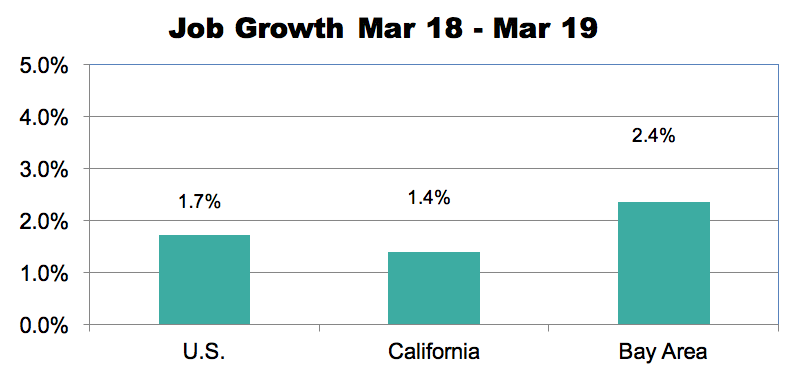
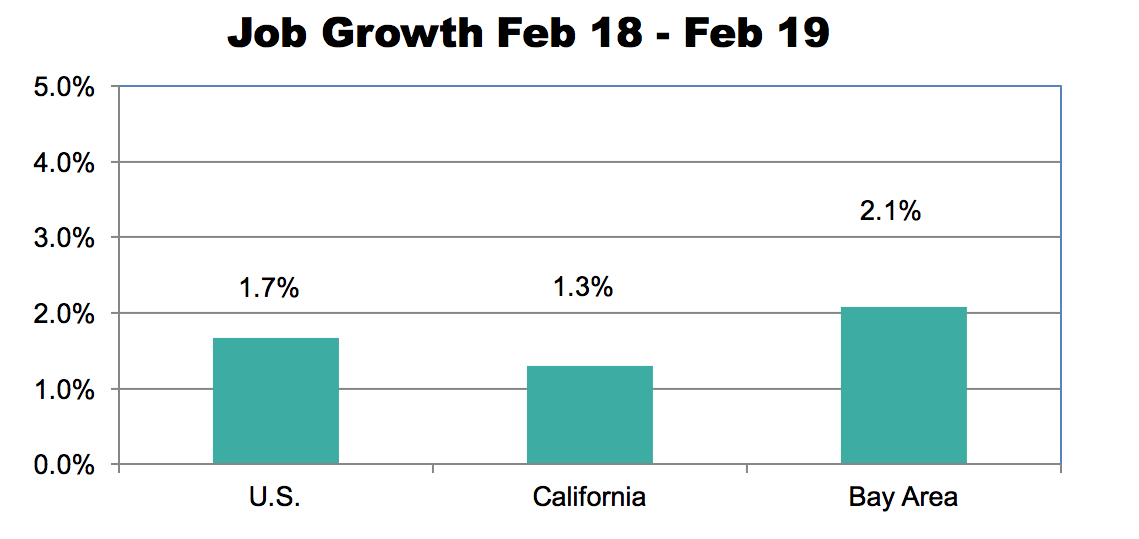
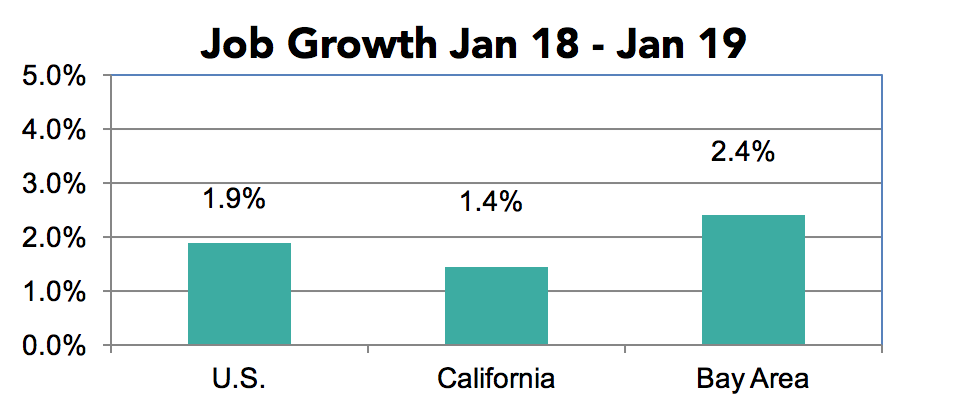
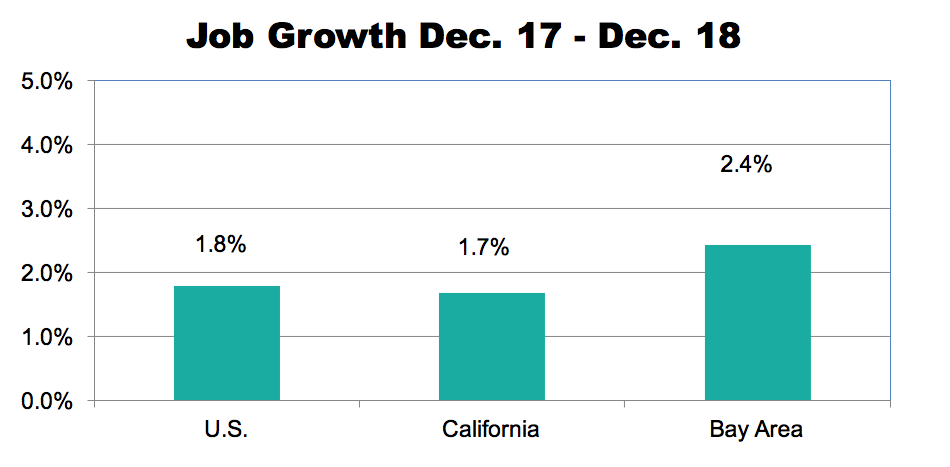
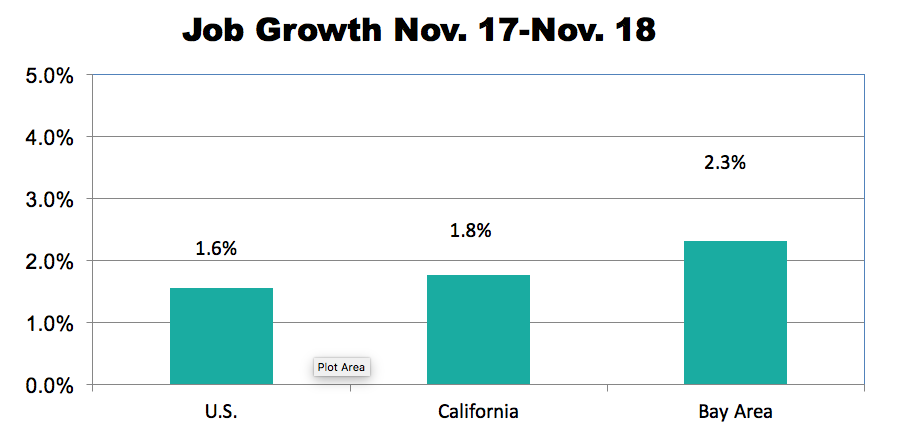
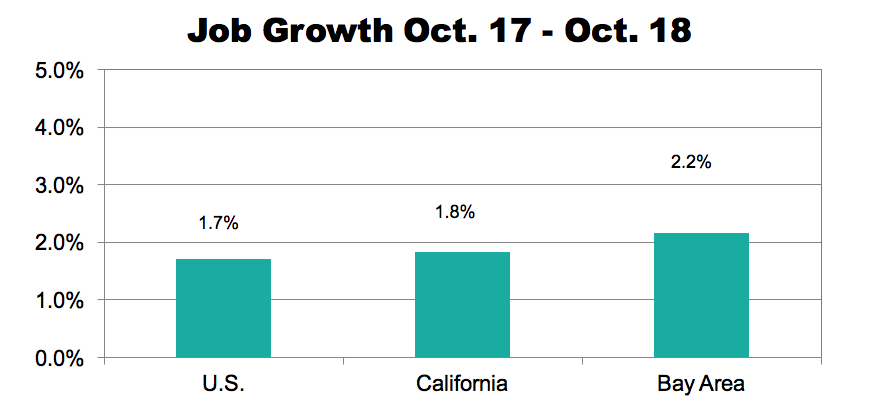
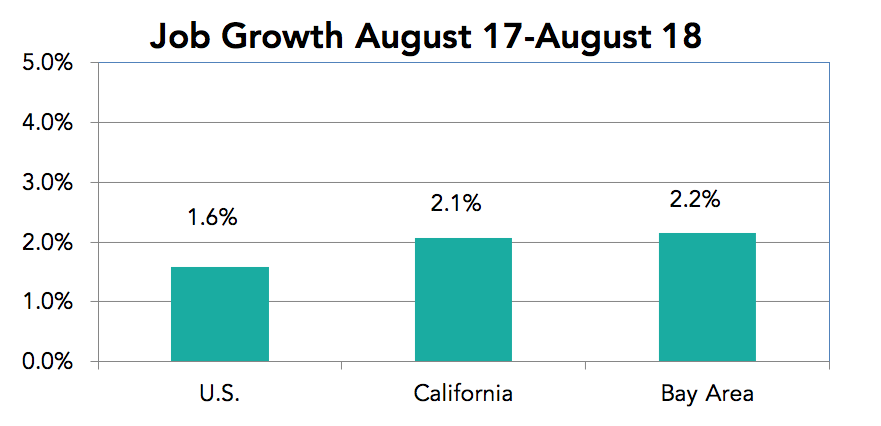
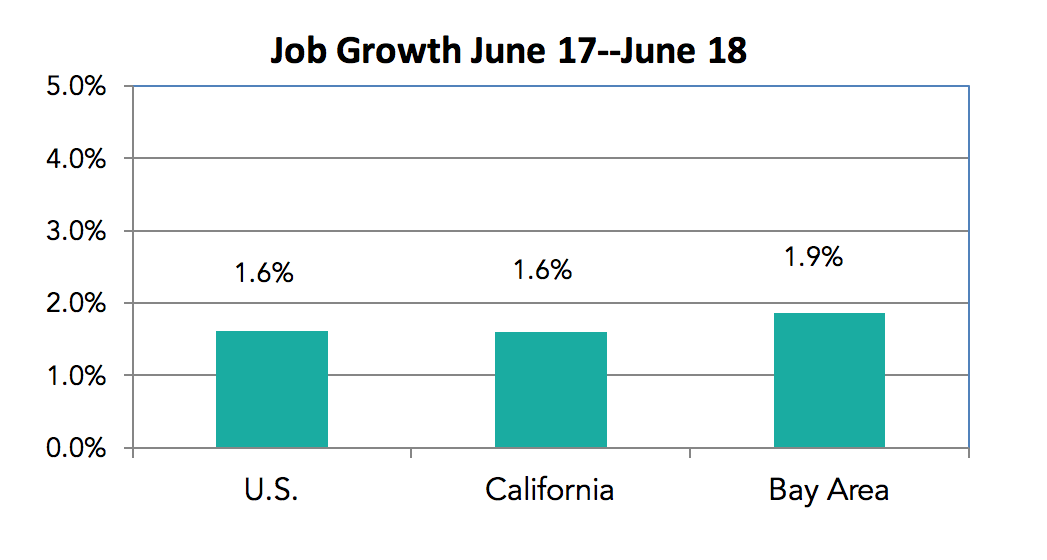
Even with the Recent Slowdown the Bay Area and State Posted Above Average Job Growth During the Past 12 Months
All regions in the state except the San Joaquin Valley outpaced the nation in job growth during the past 12 months led by the Southern California and the Bay Area followed by the Sacramento region.
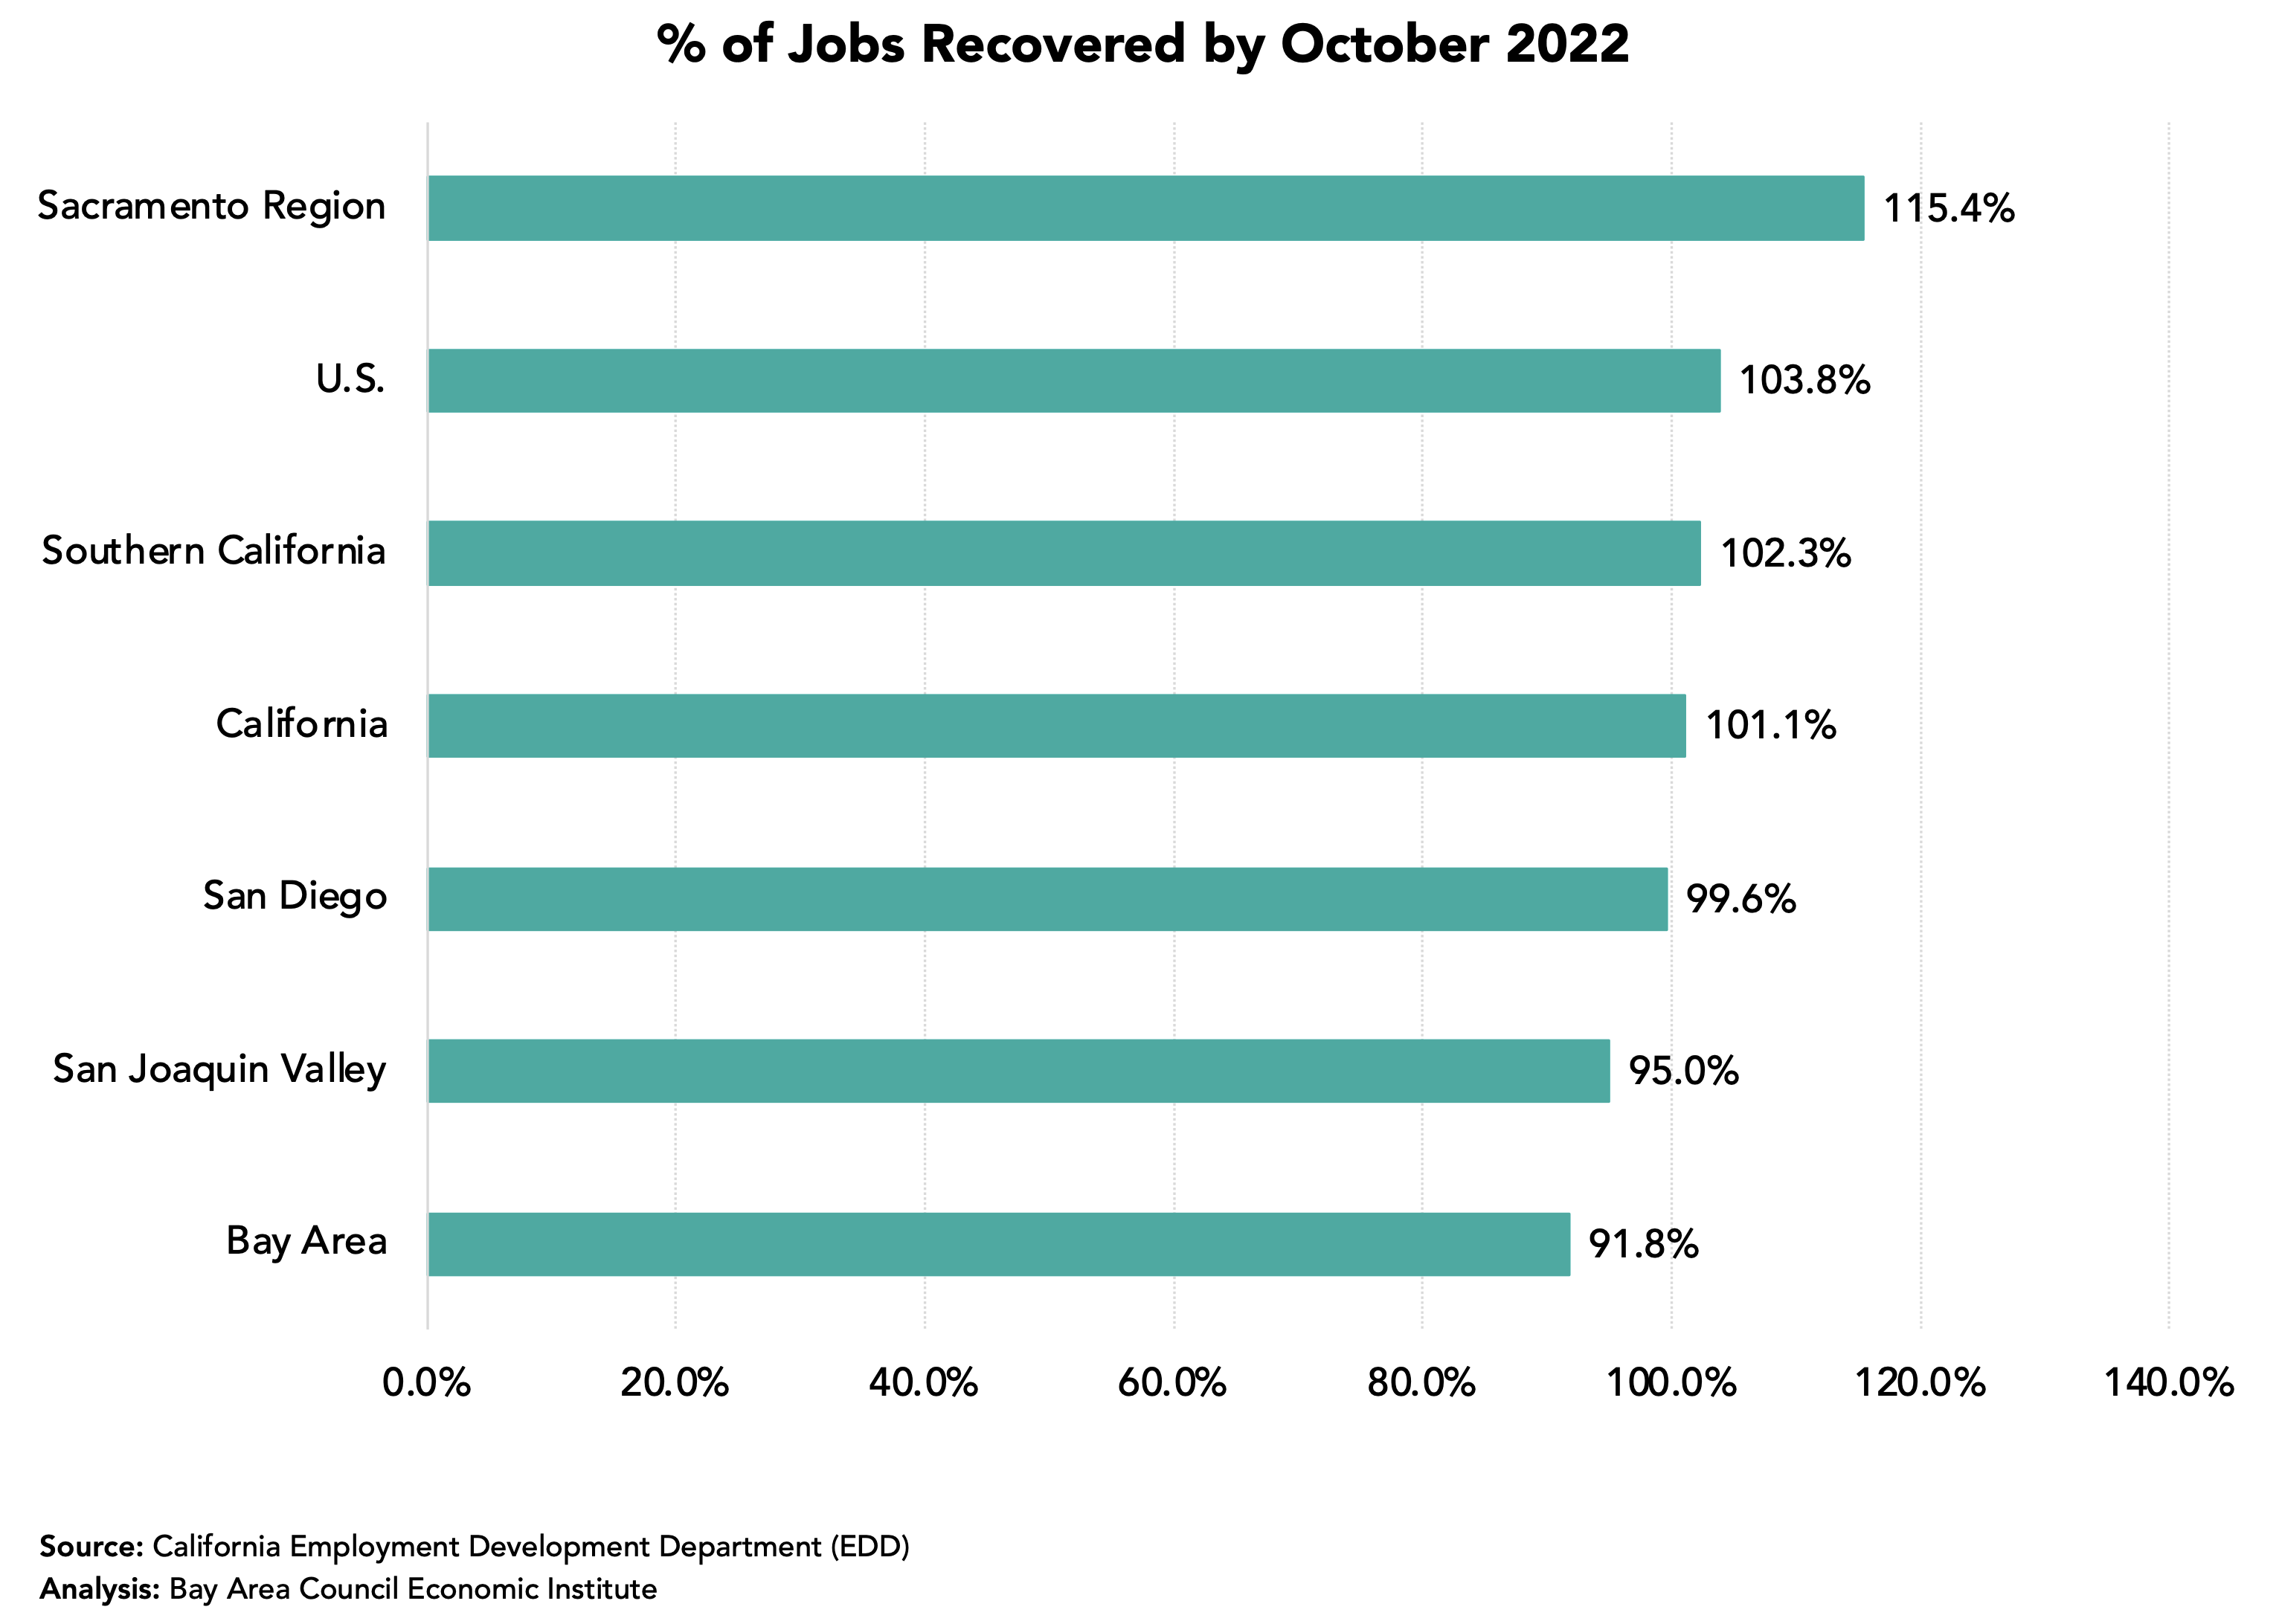
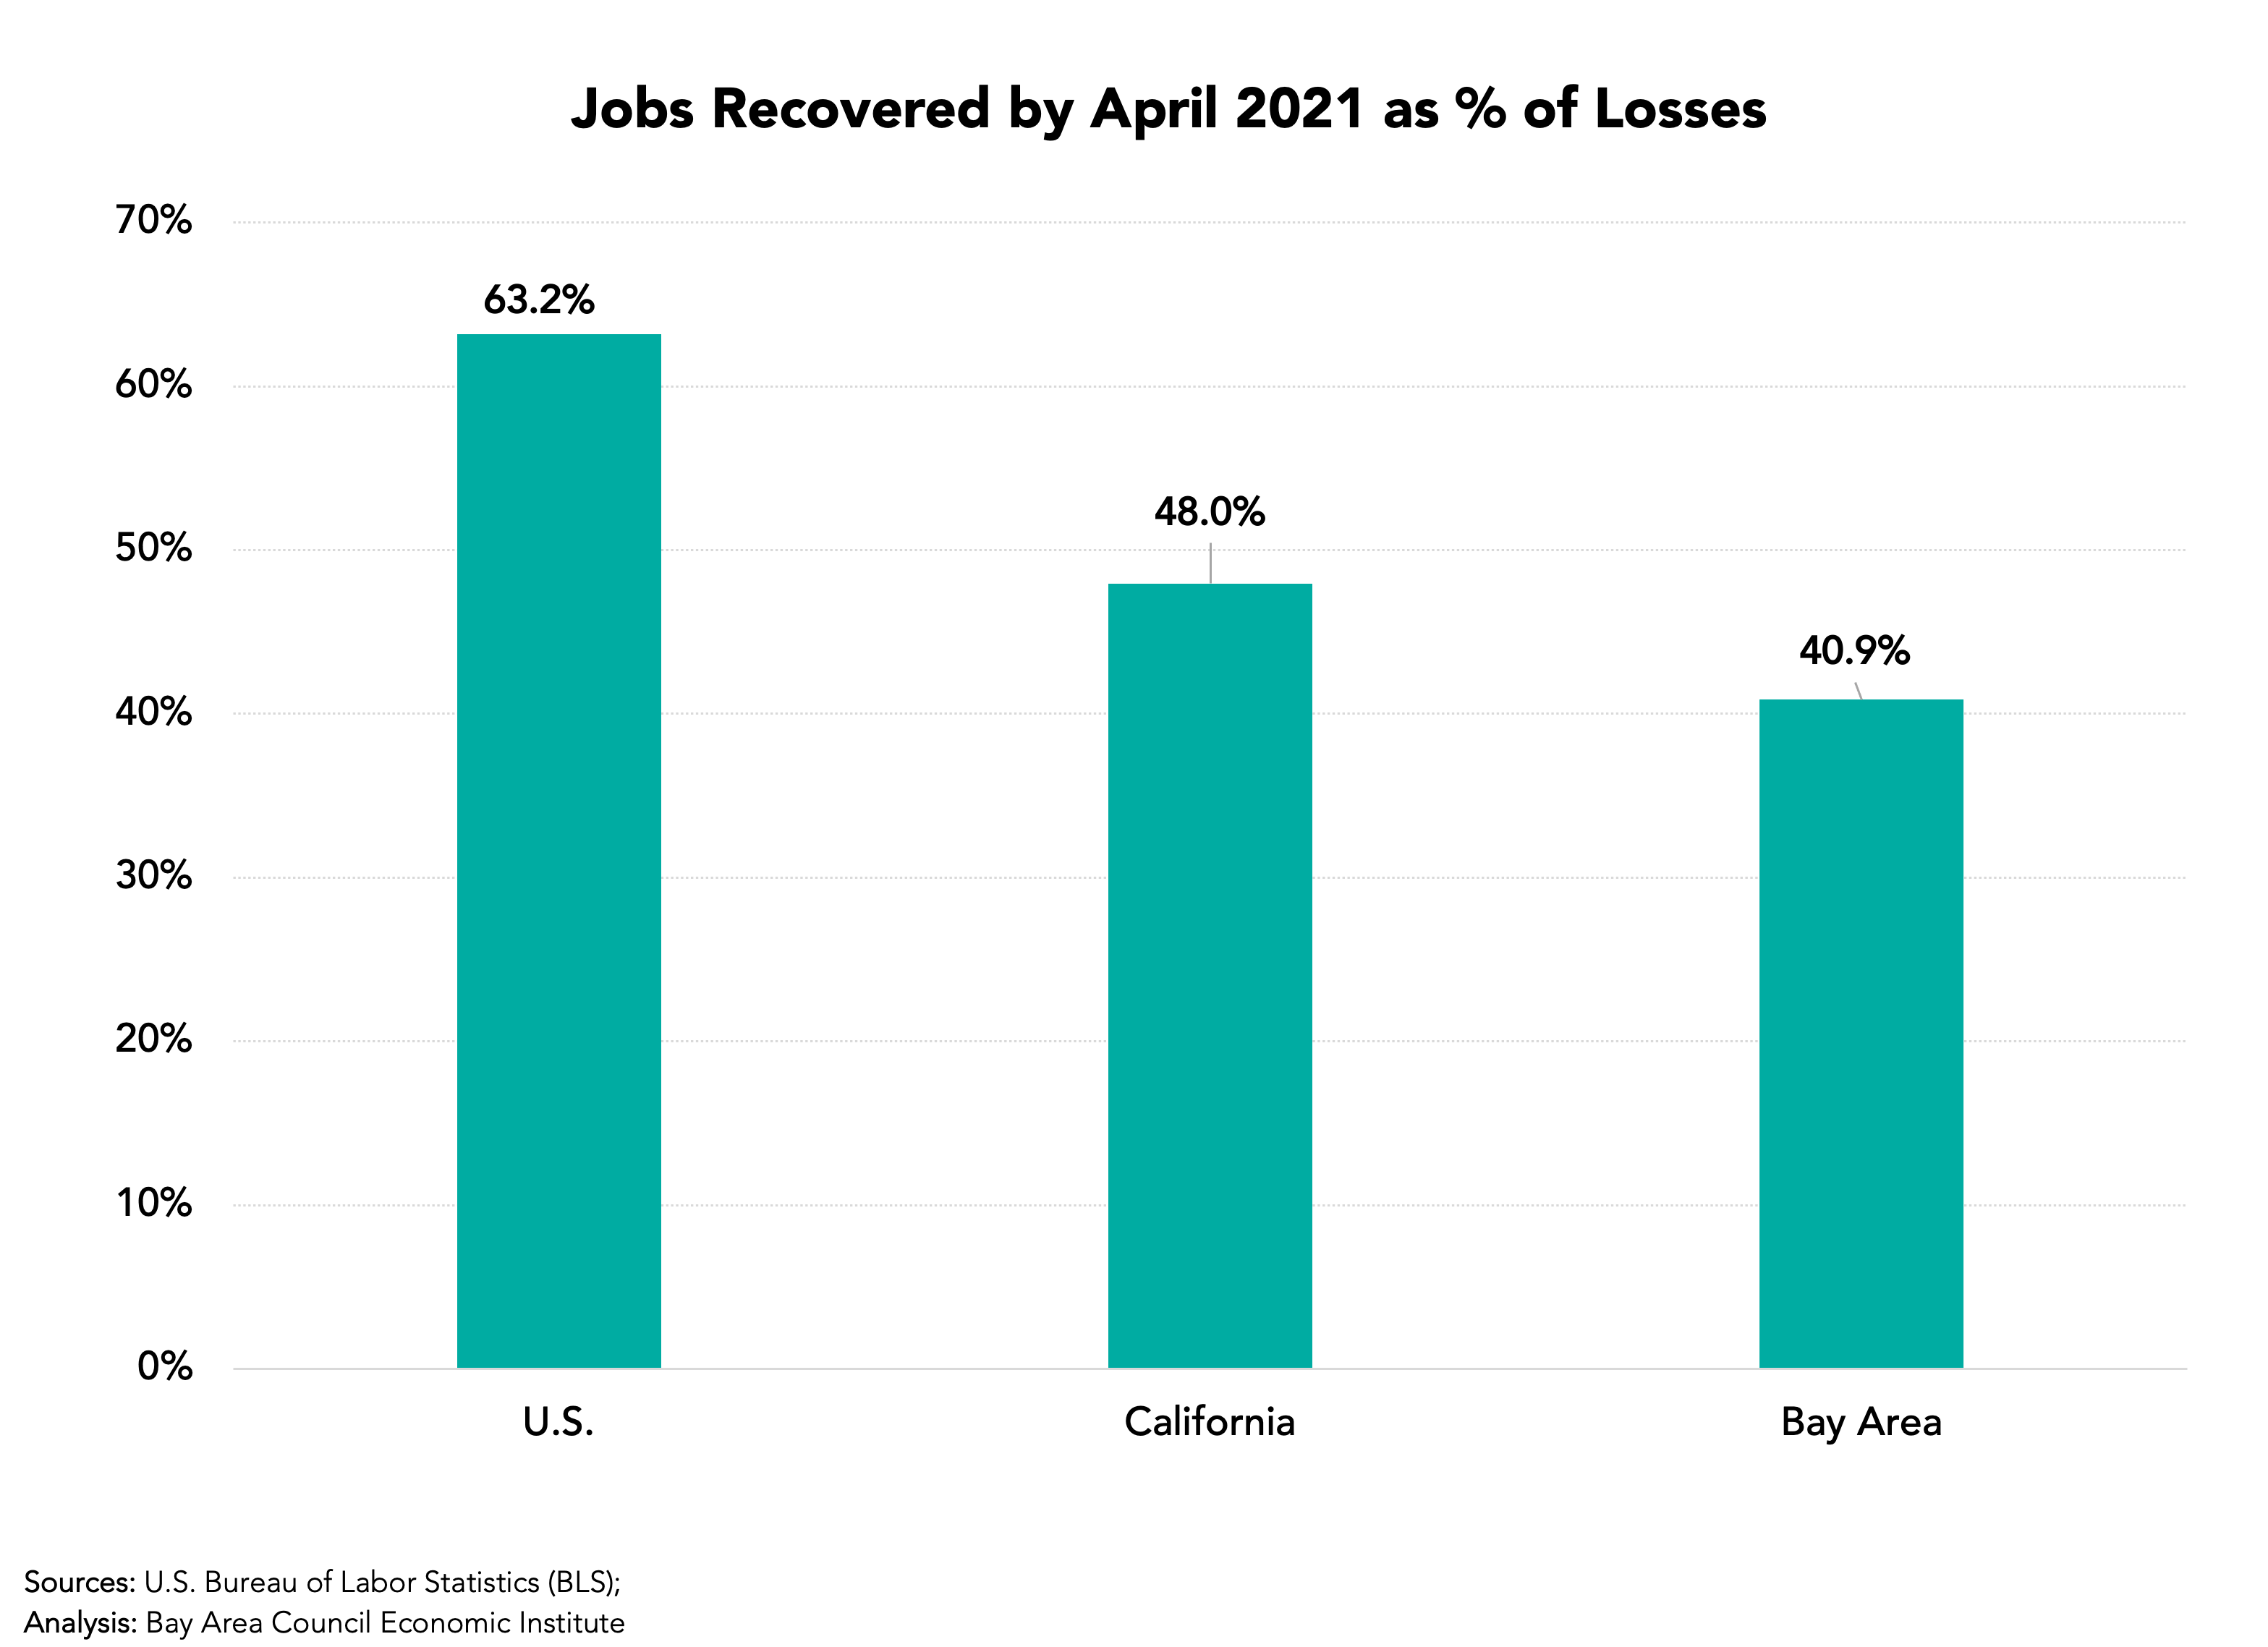
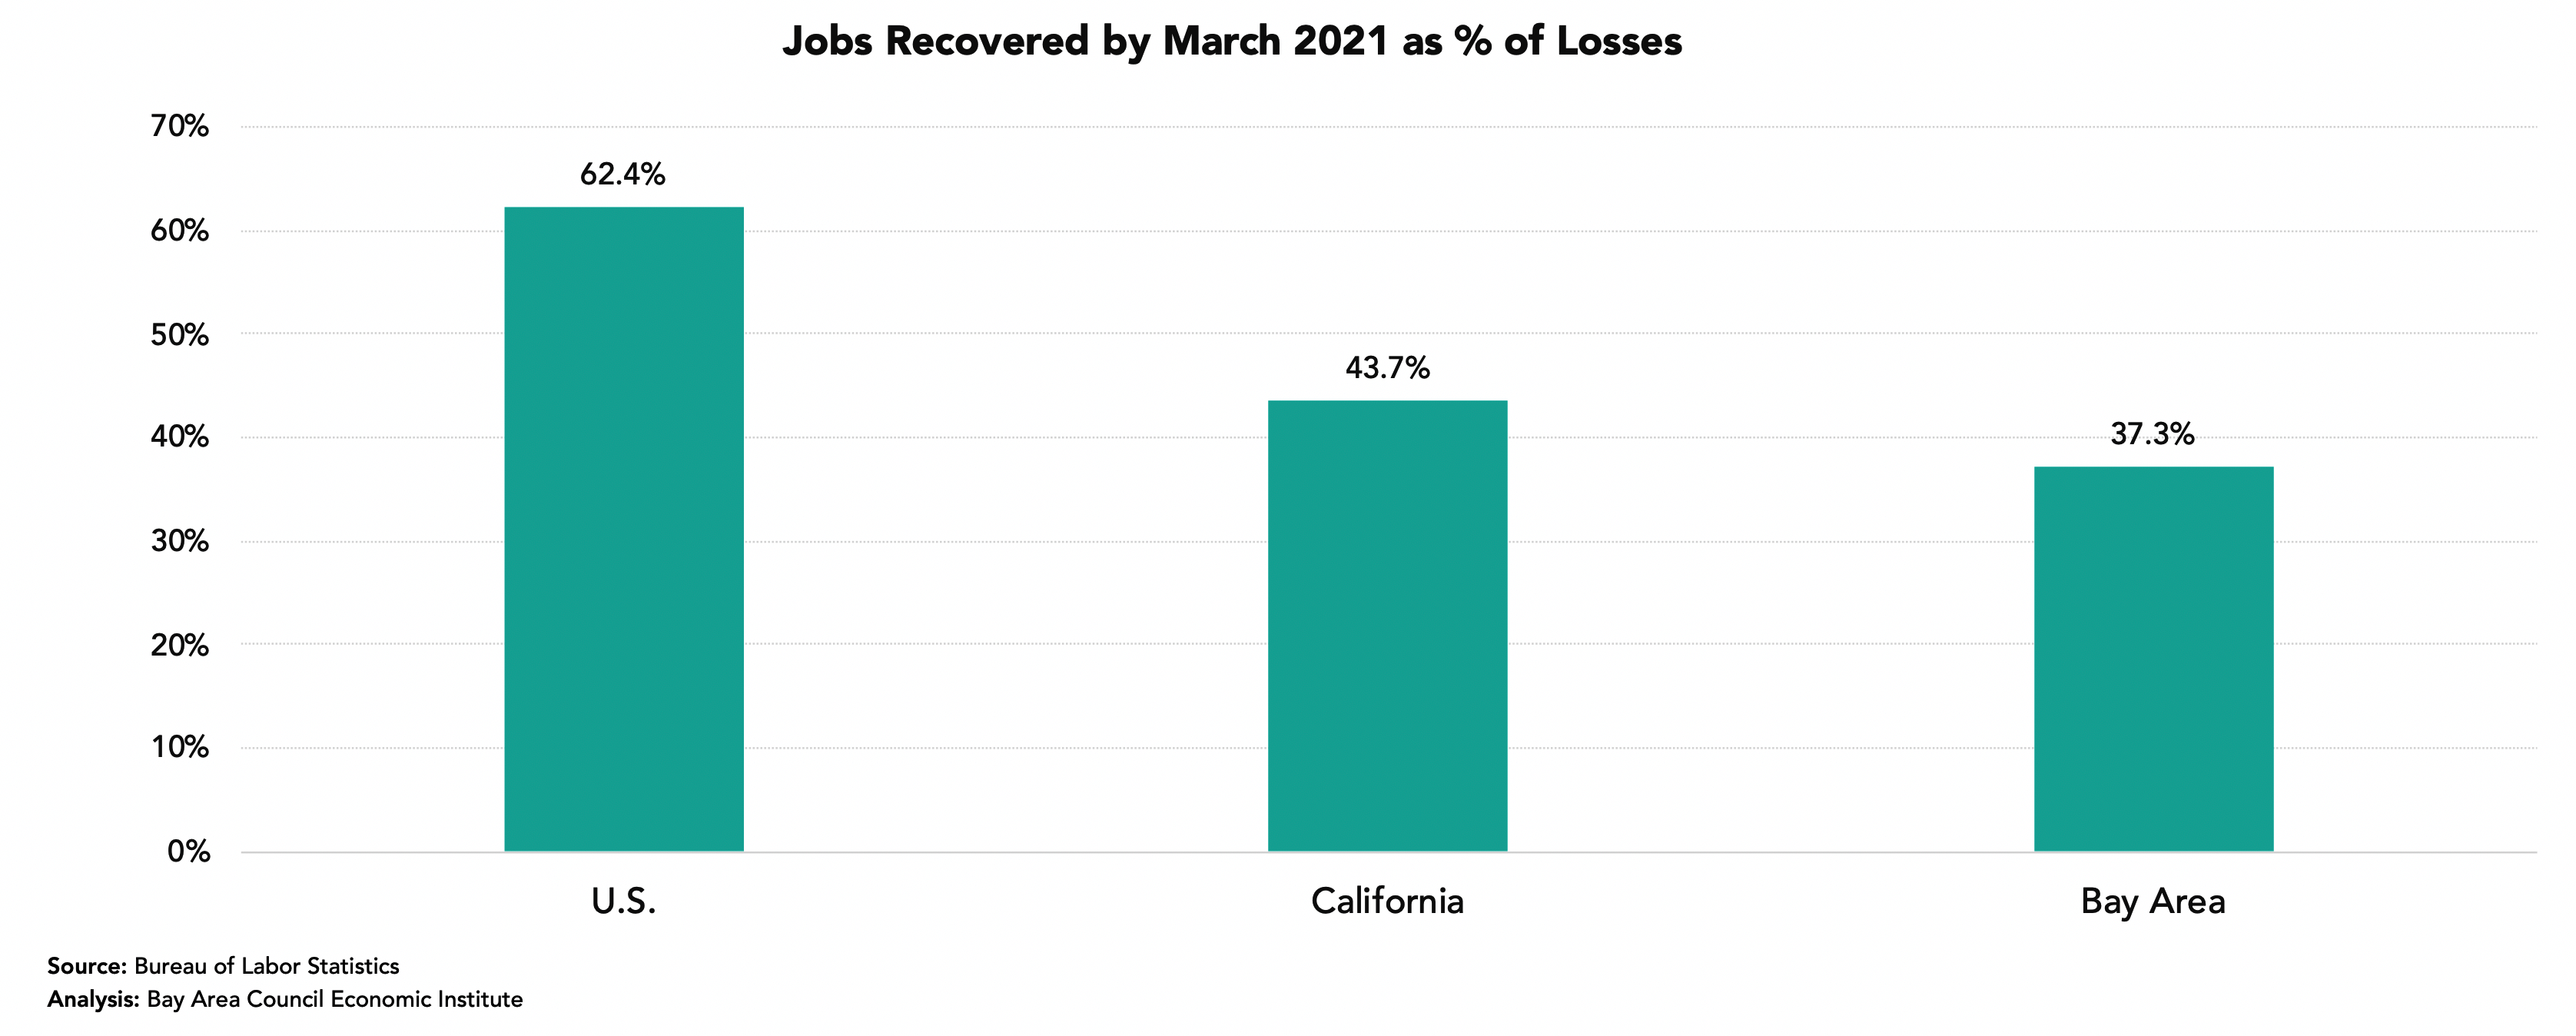
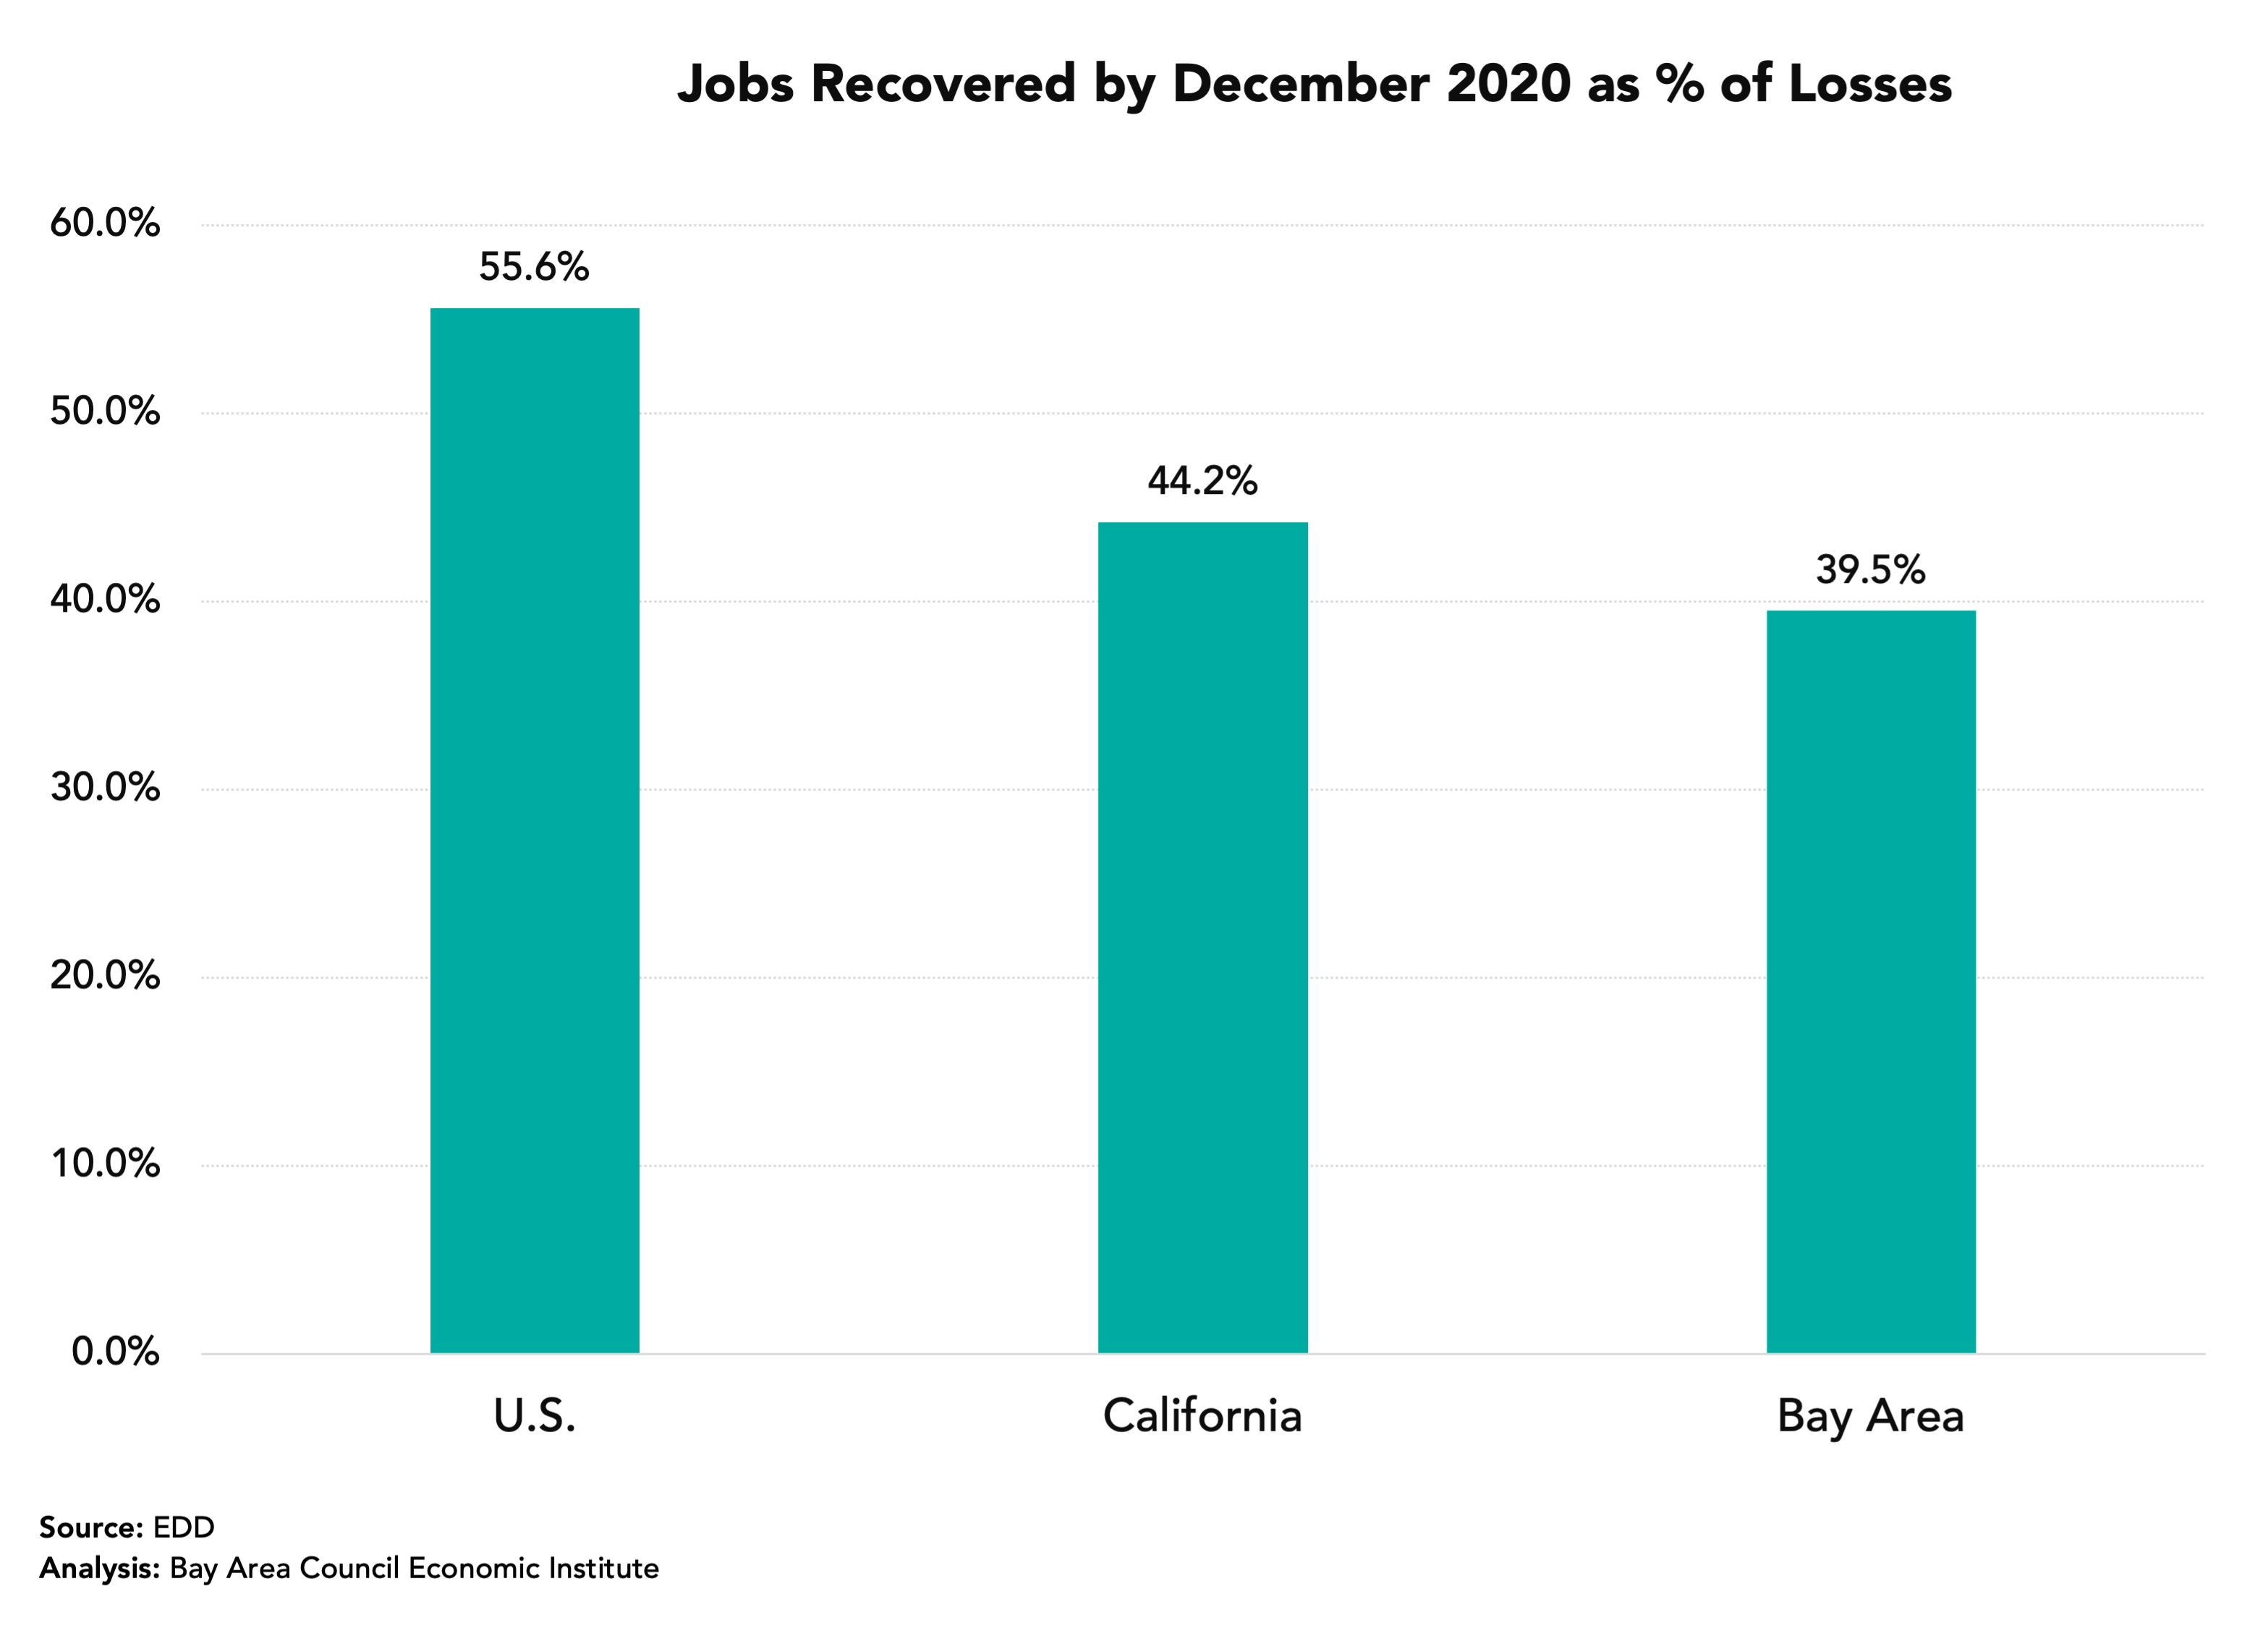
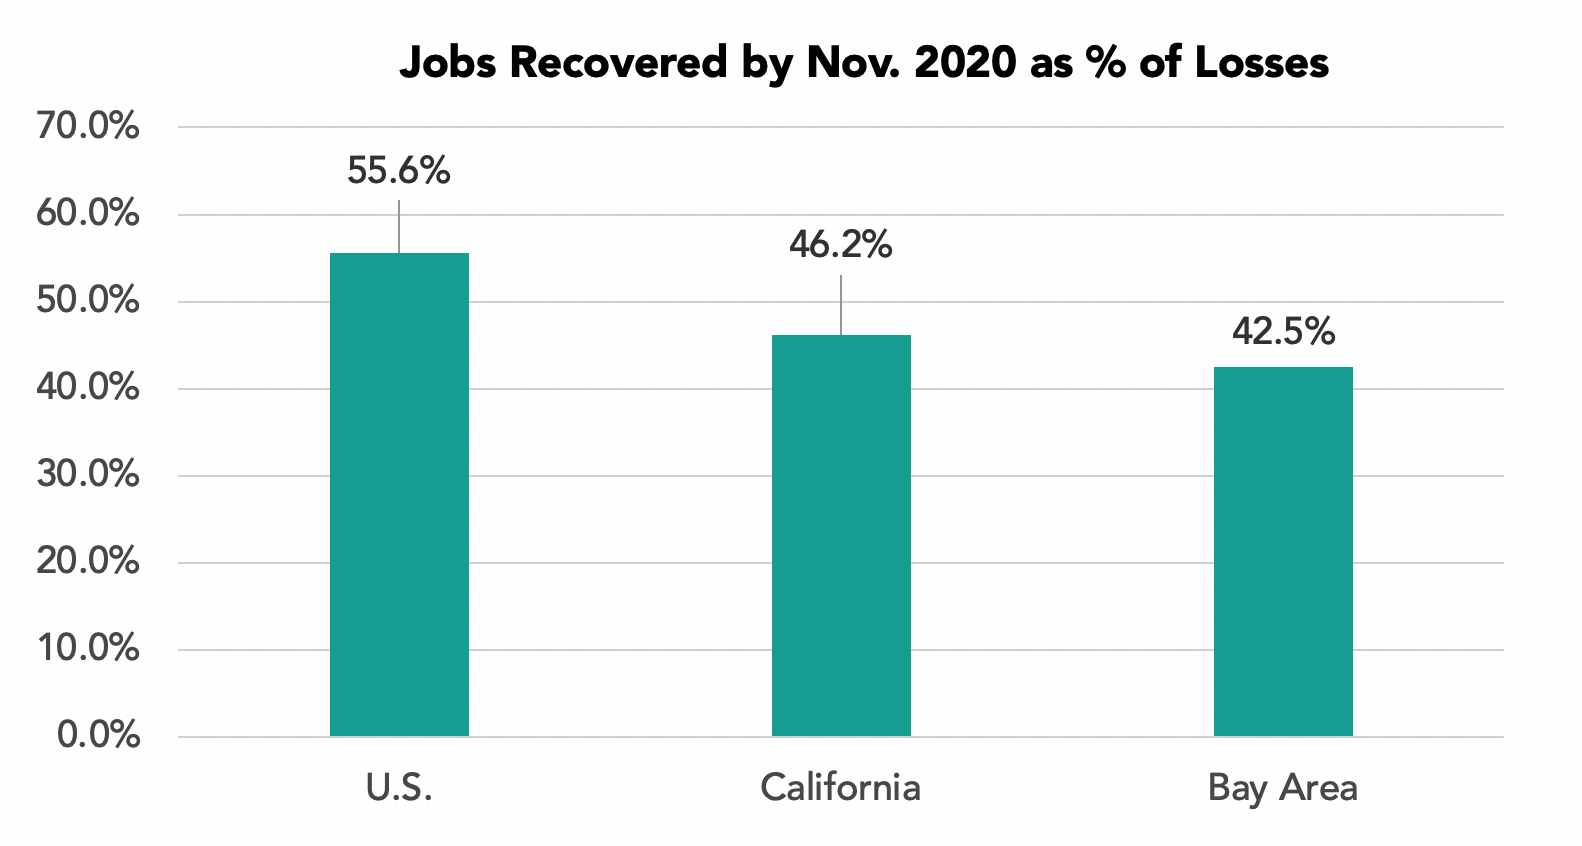
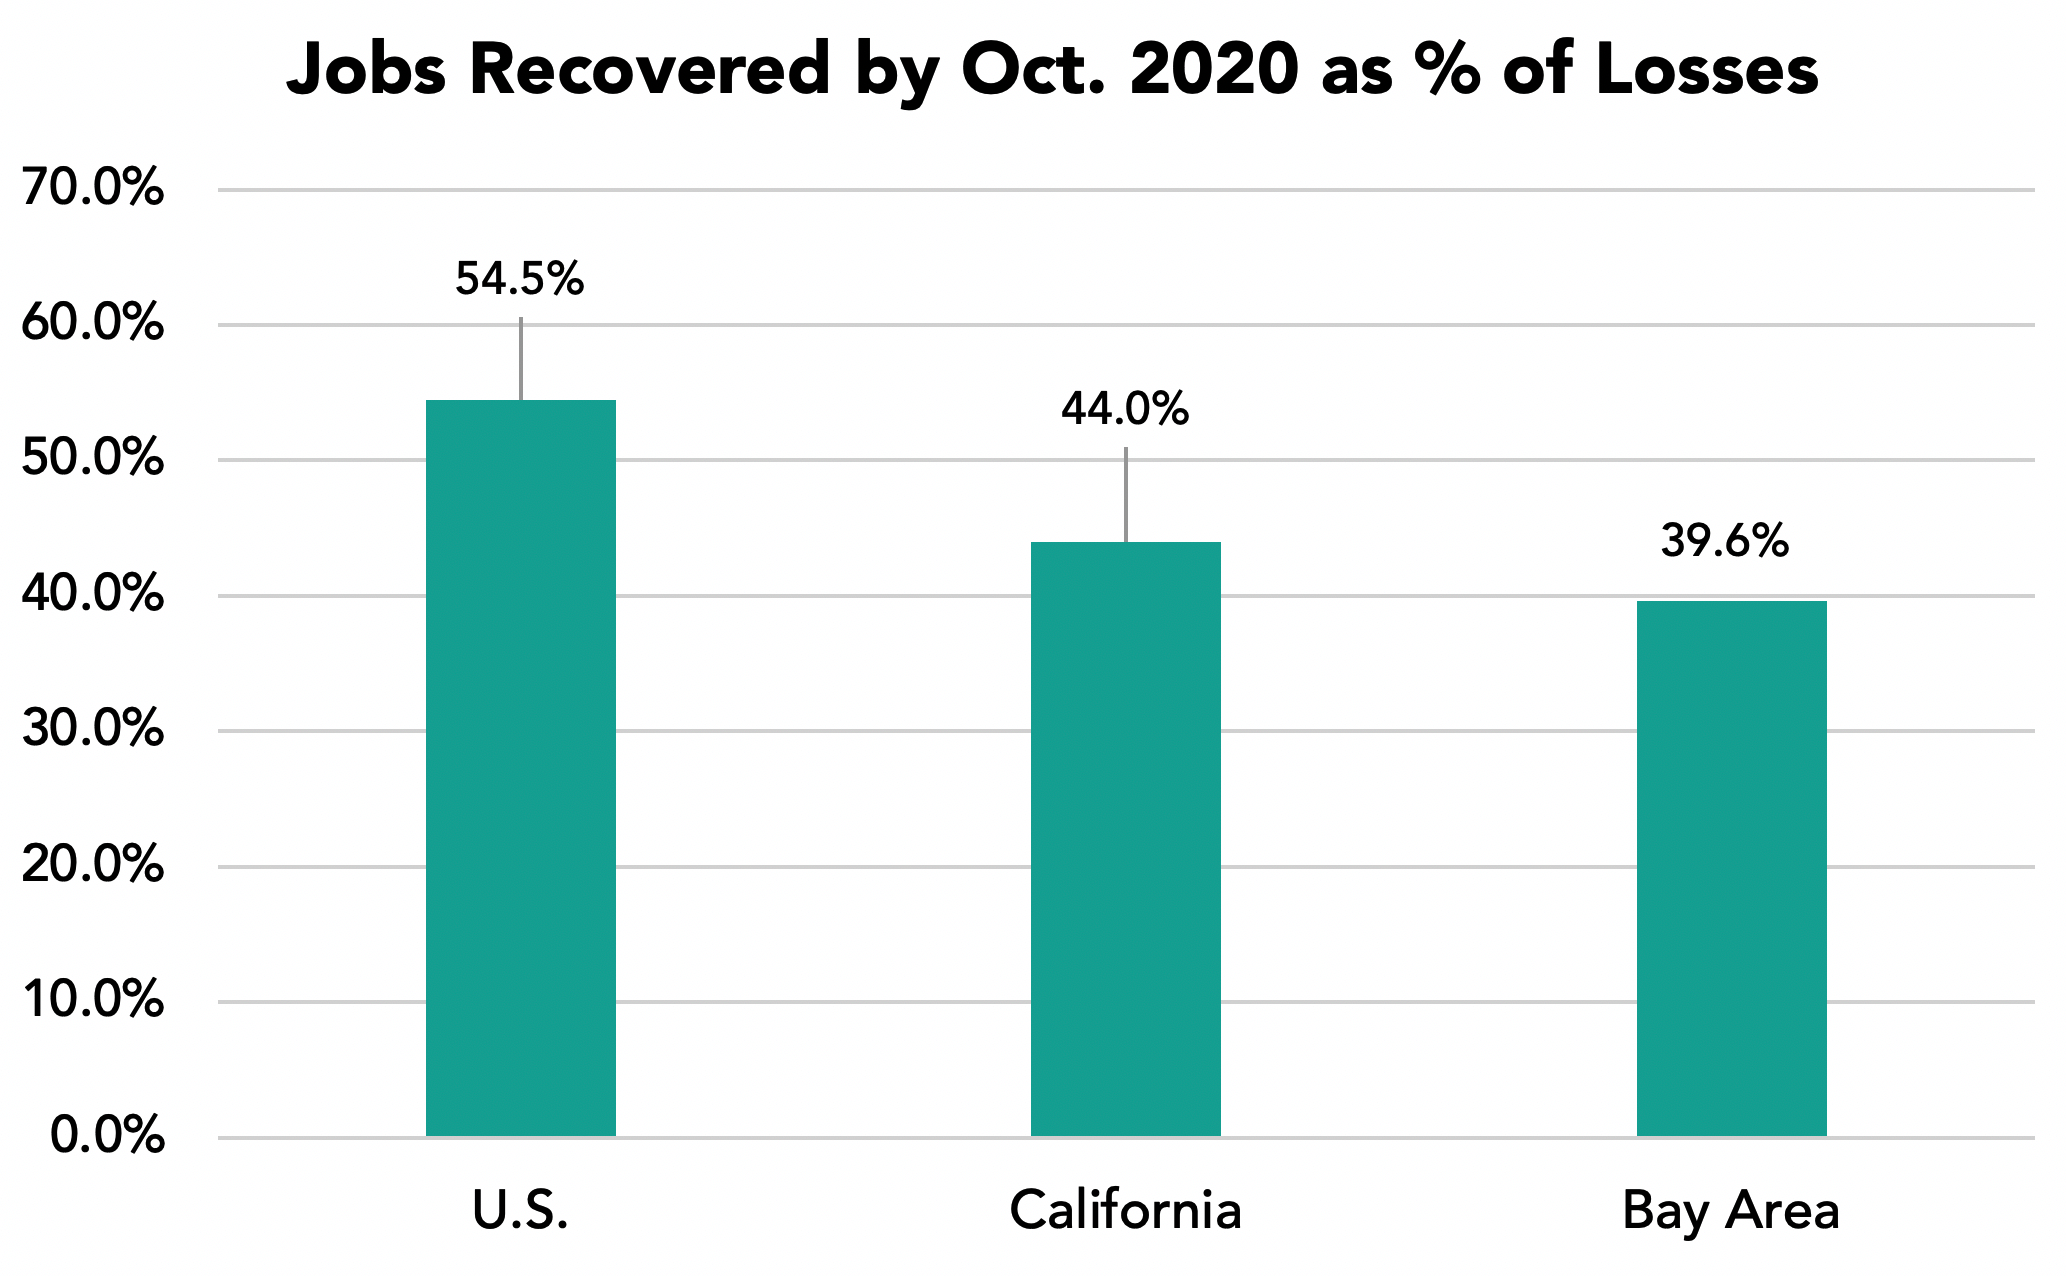
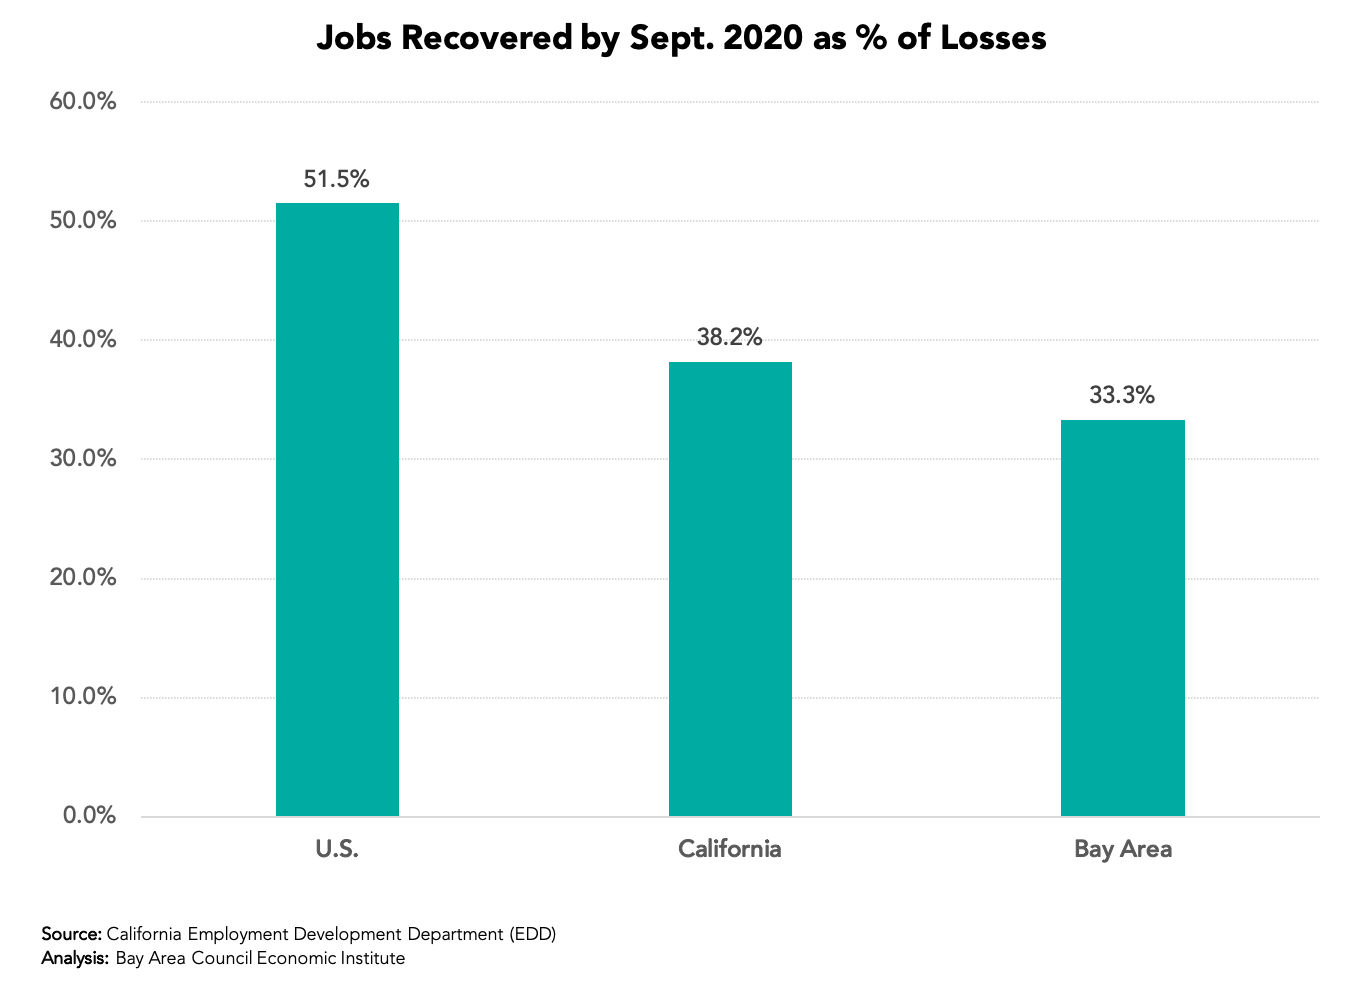
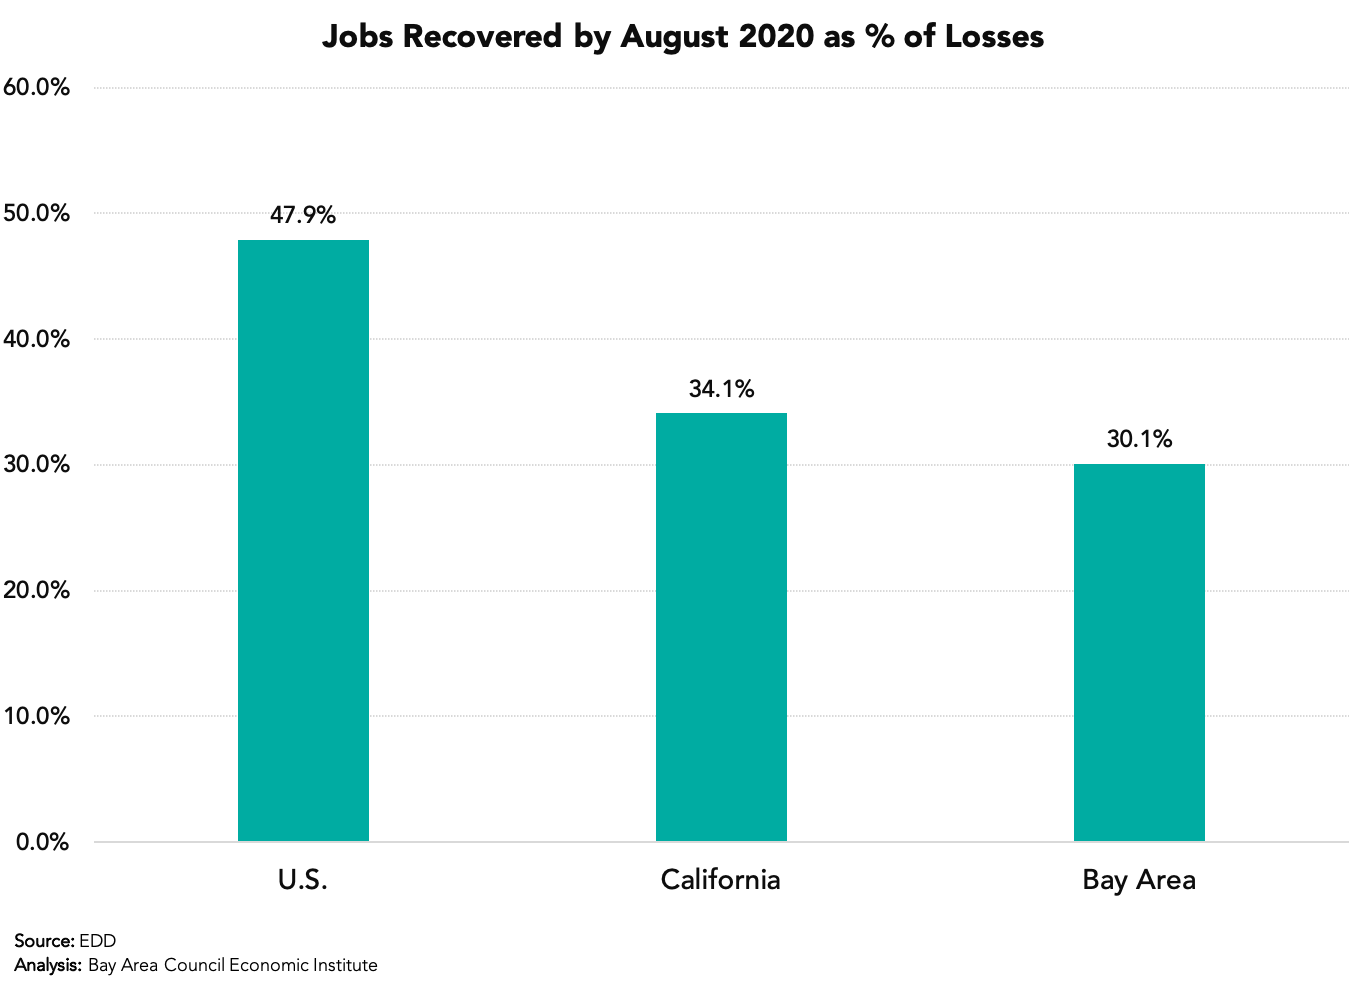
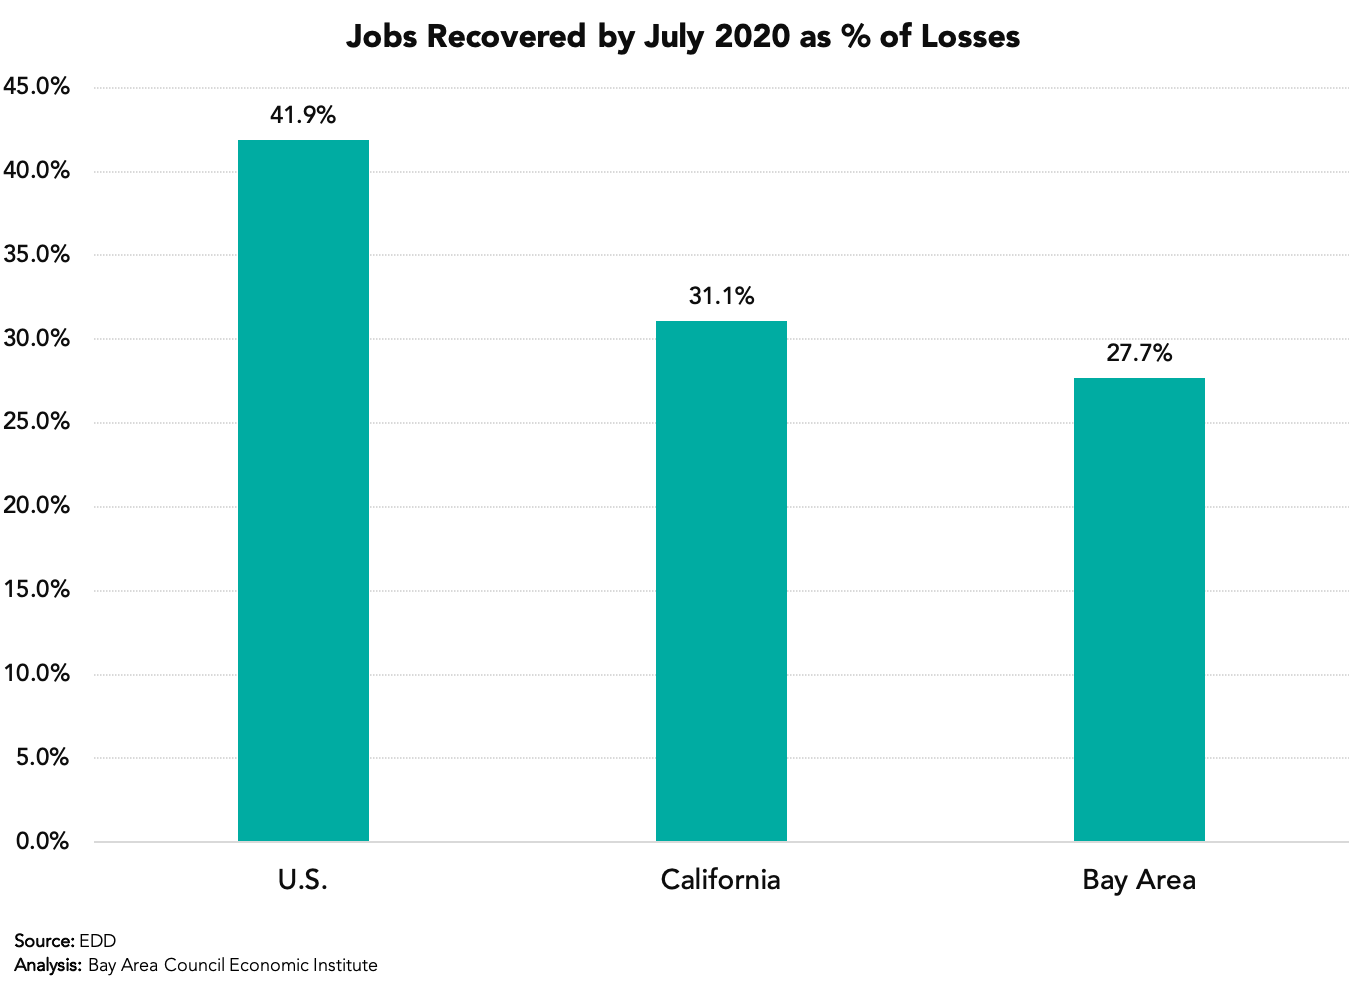
The chart below gets wide media attention and focuses on our region’s below-average job recovery rate. It is accurate and shows the better U.S. and California data. But look at the chart above to see the Bay Area catching up.
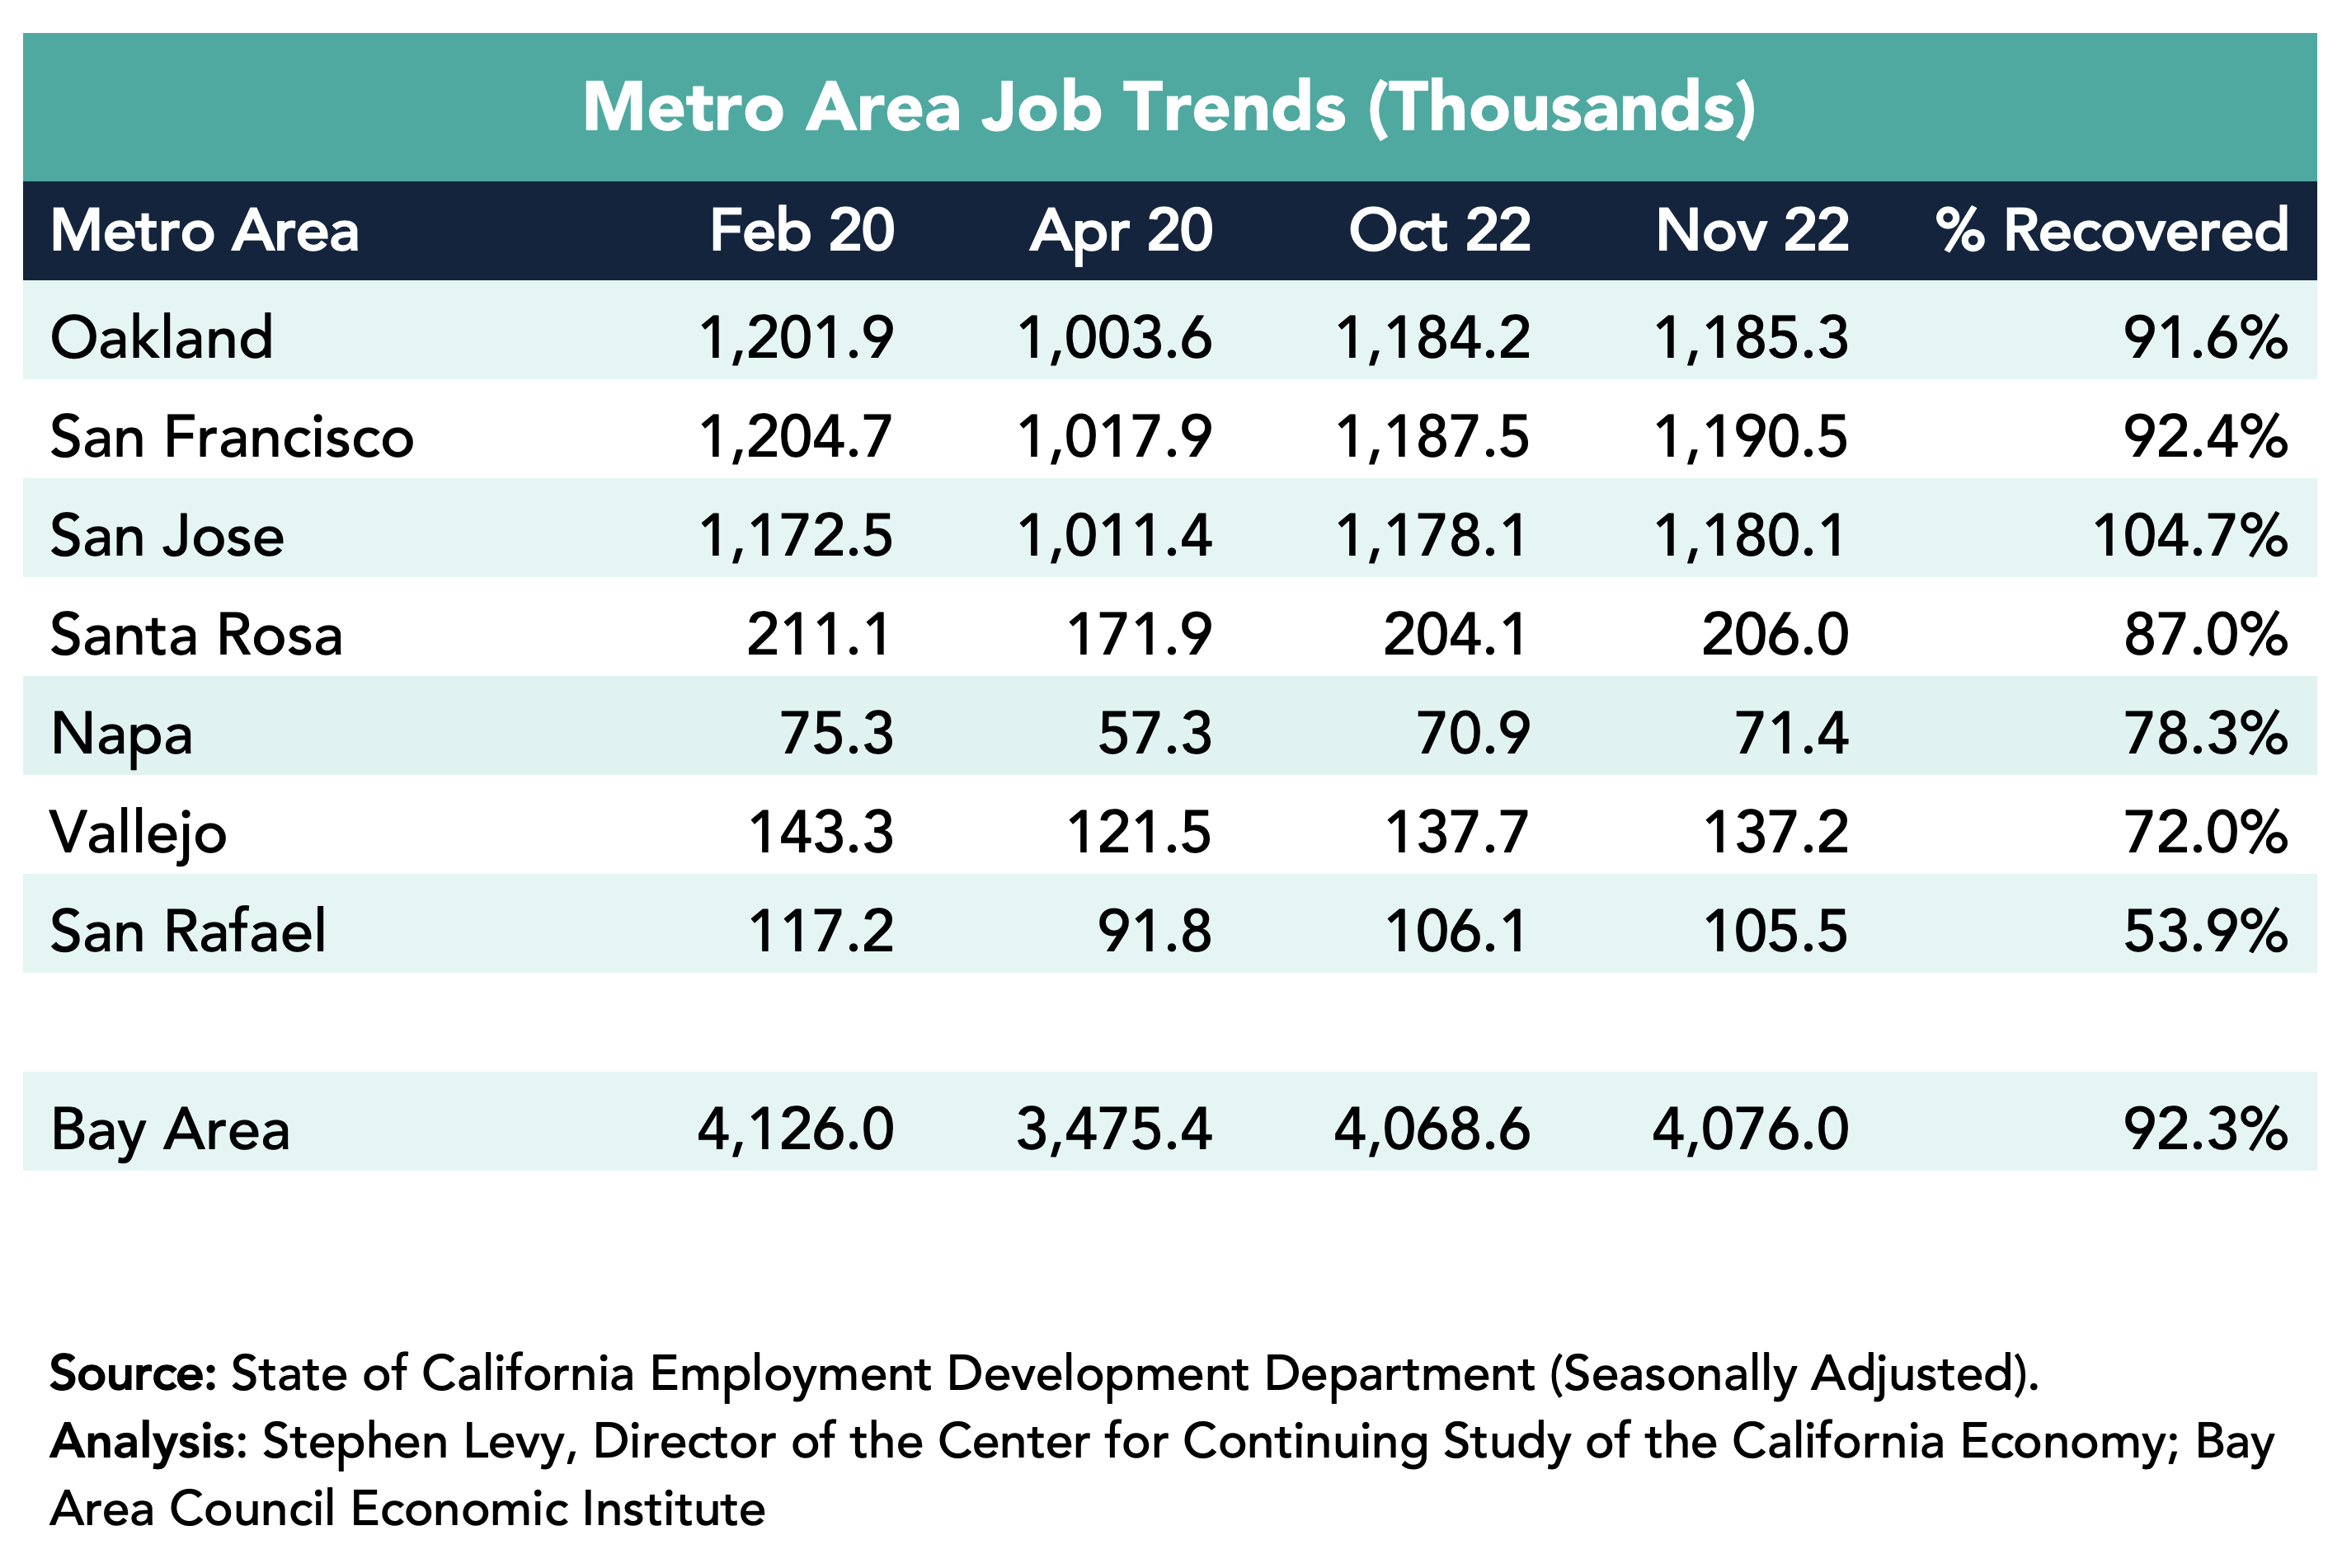
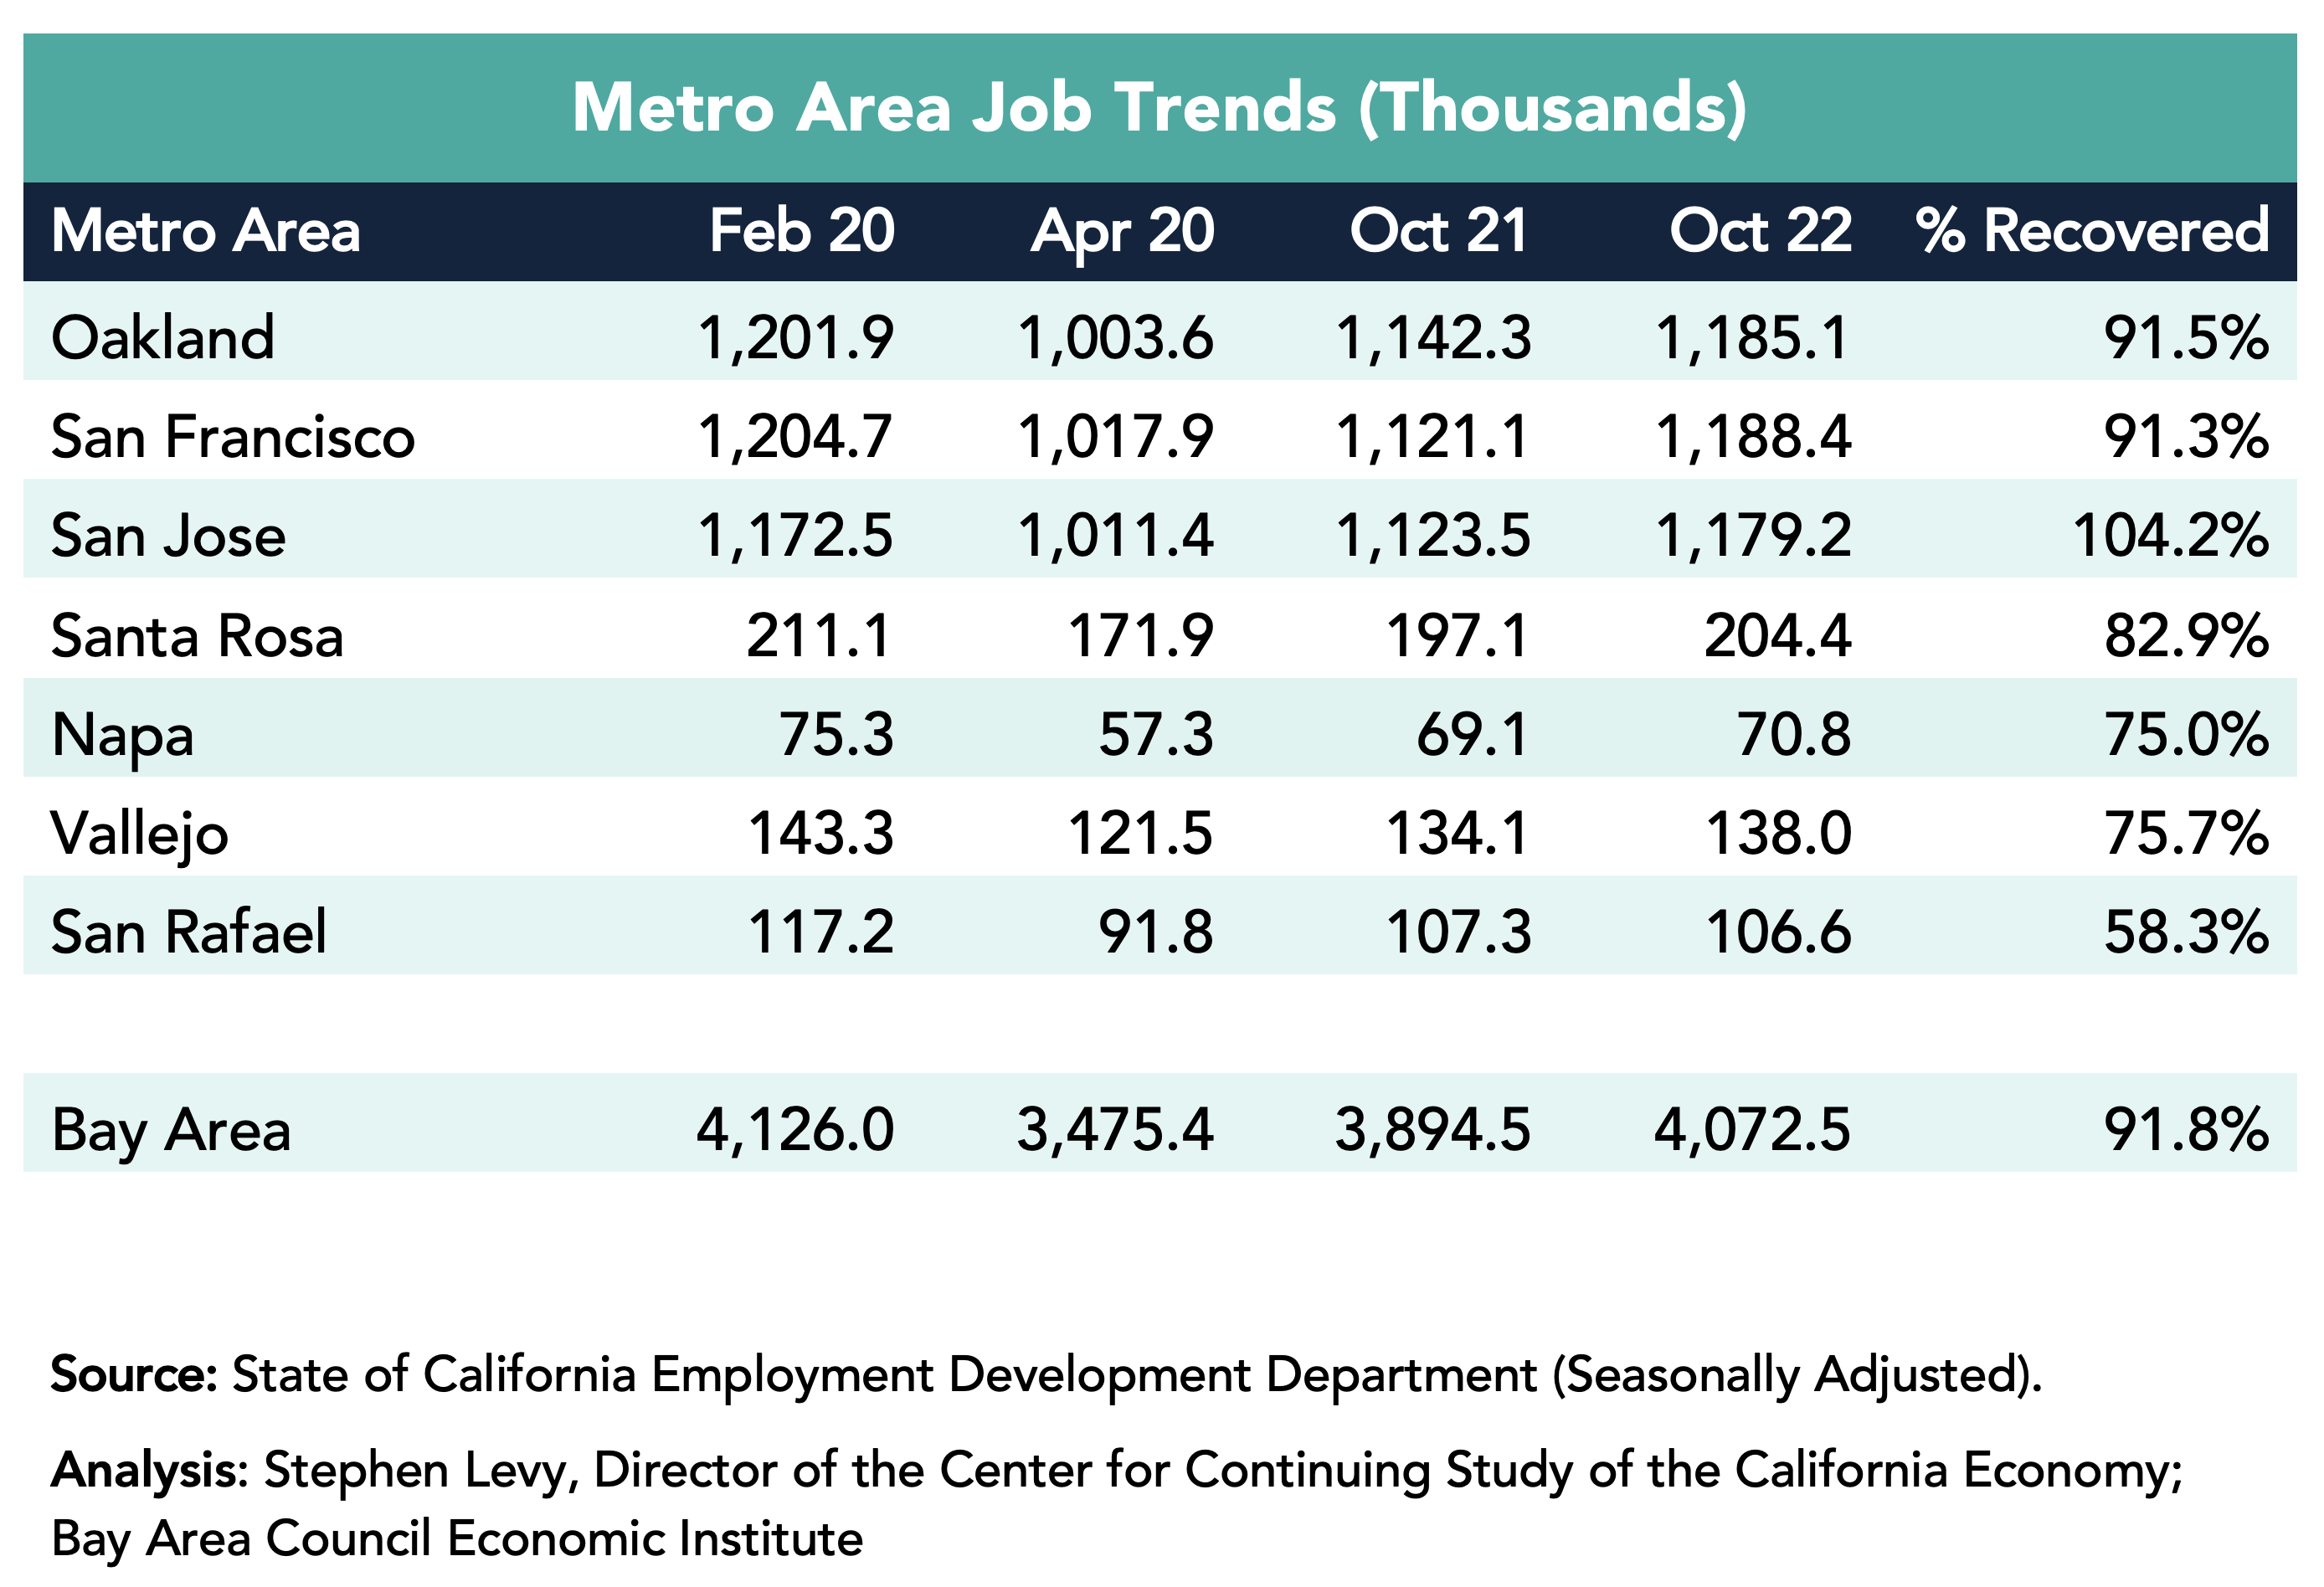
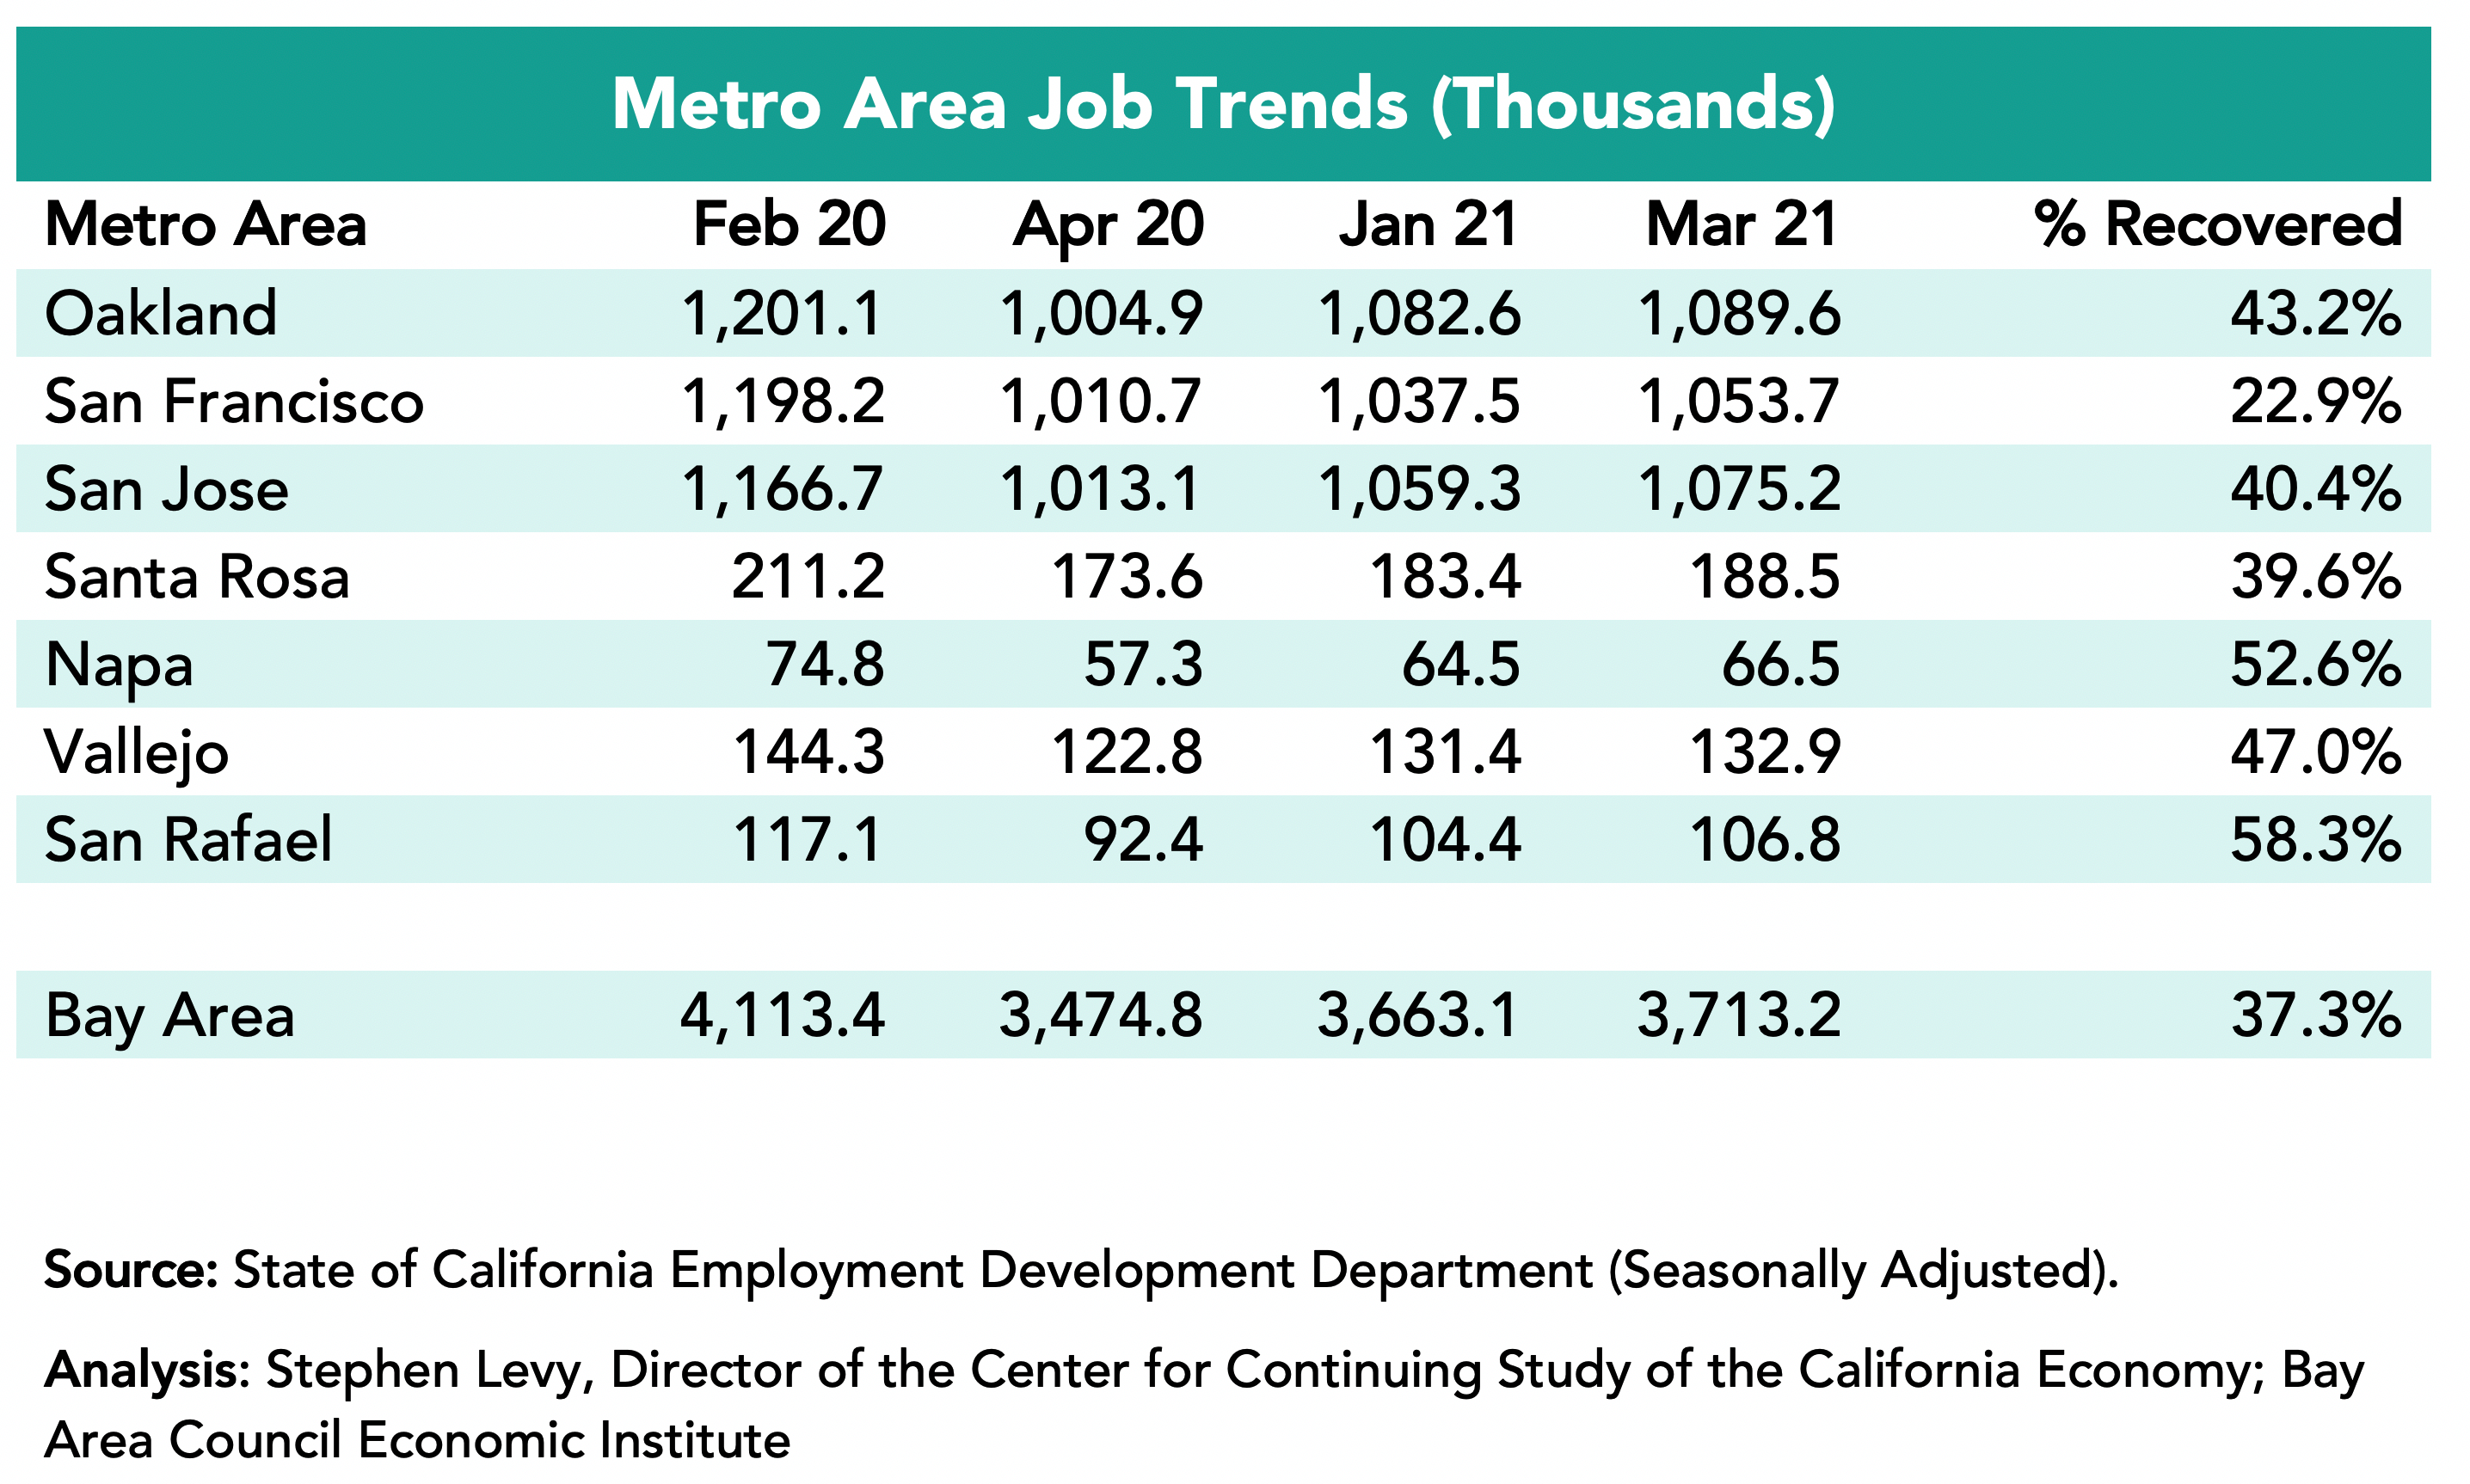
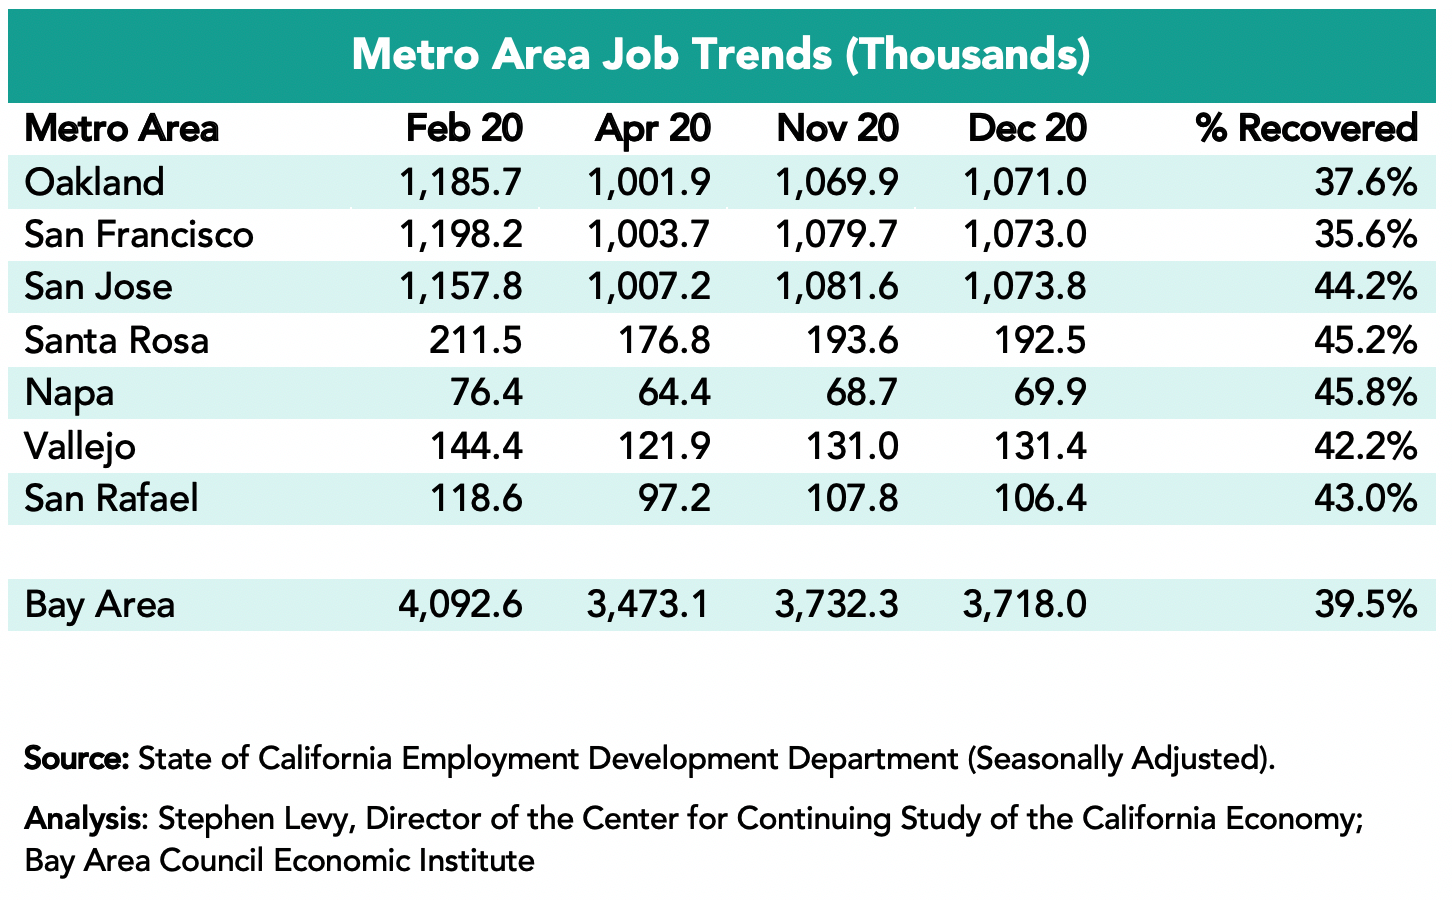
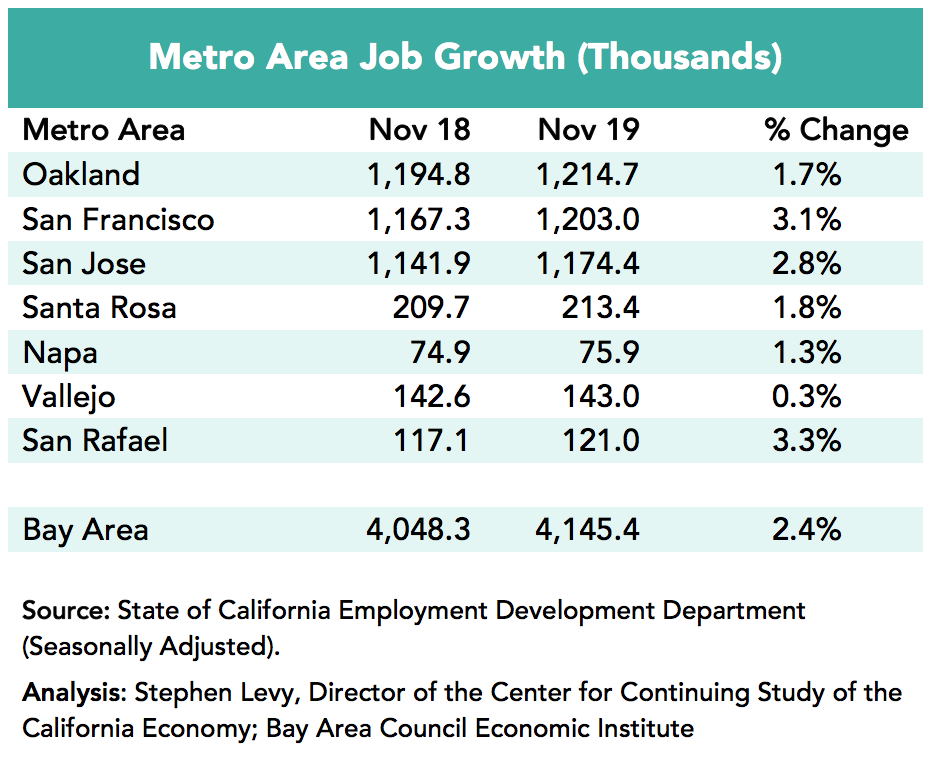
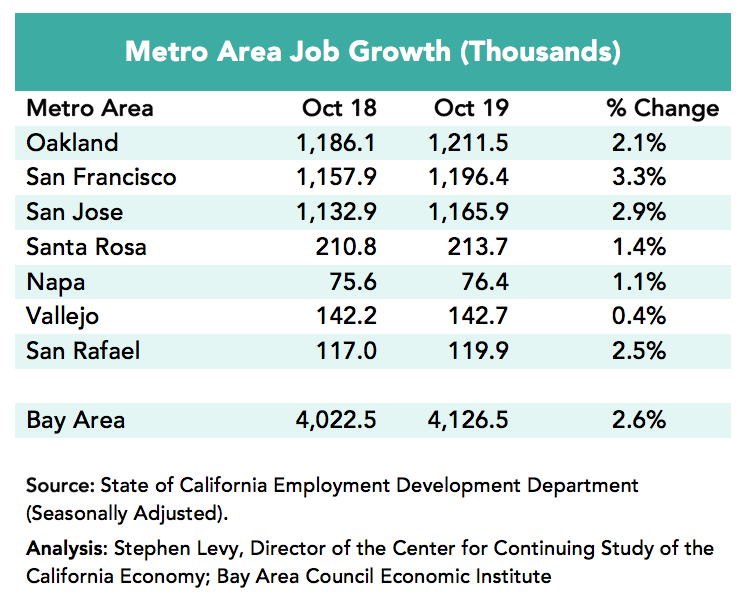
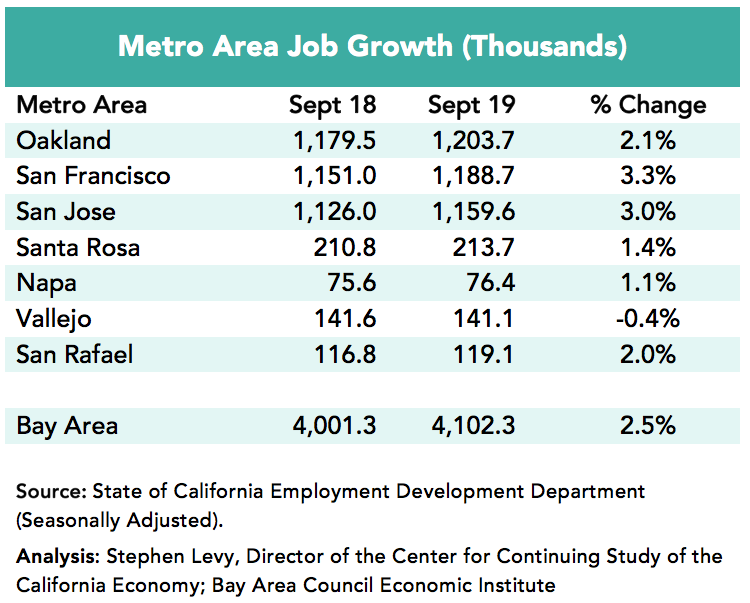
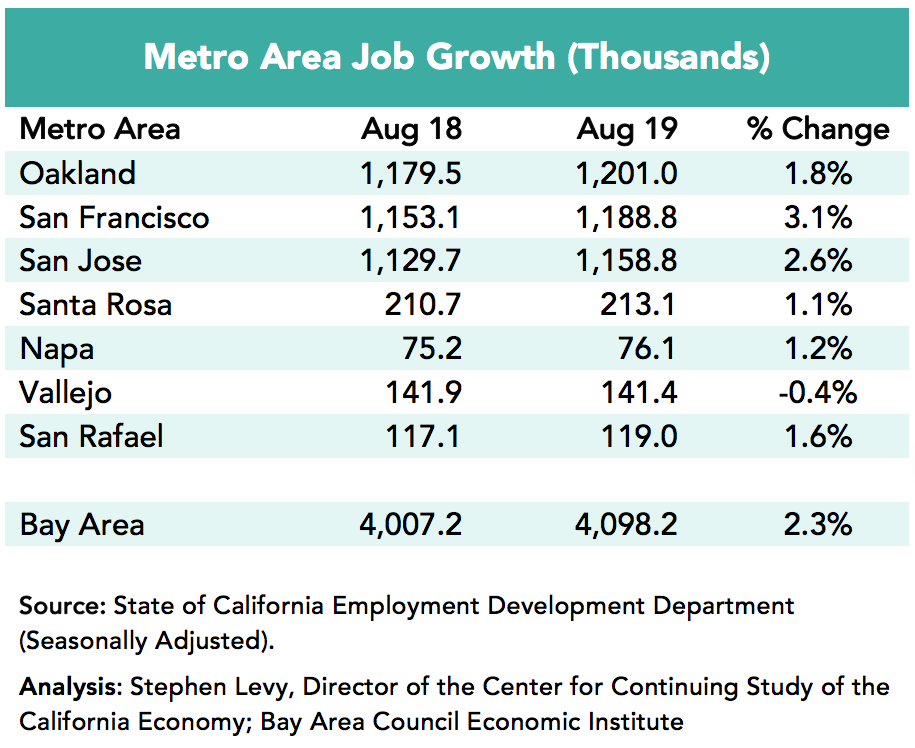
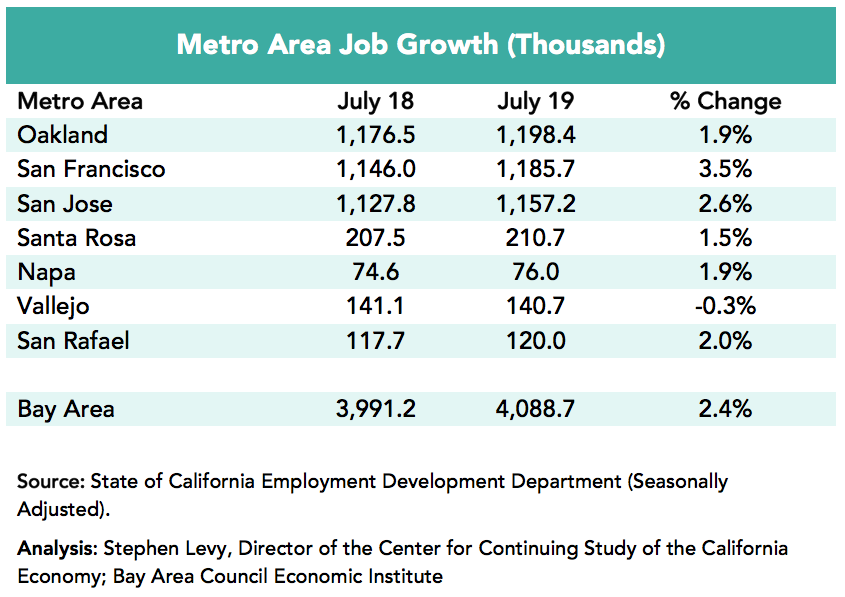
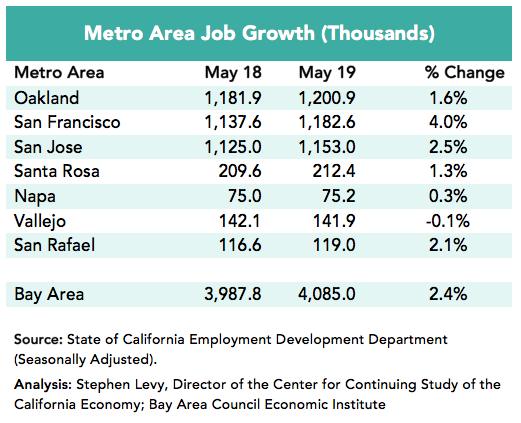
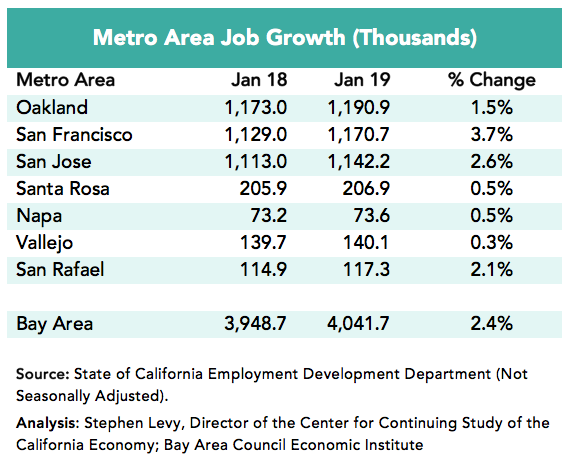
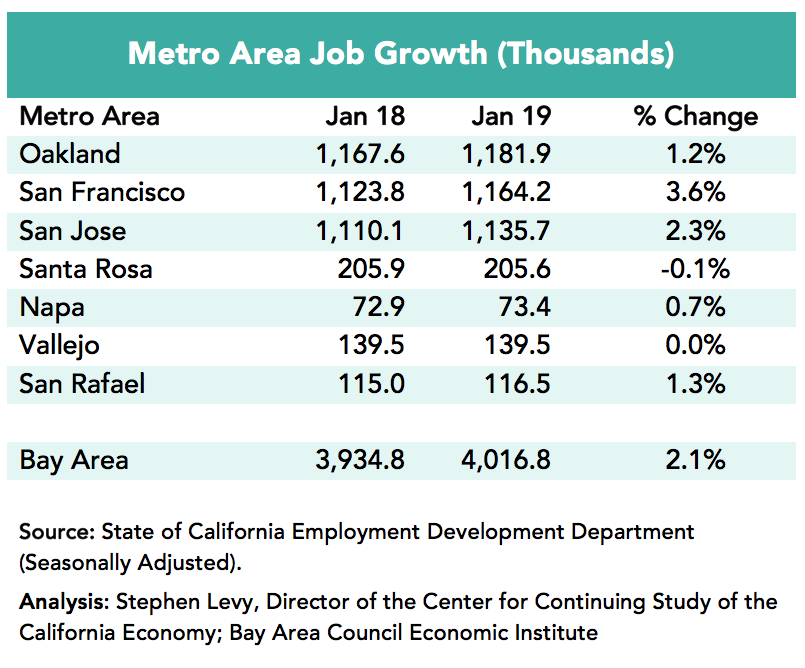
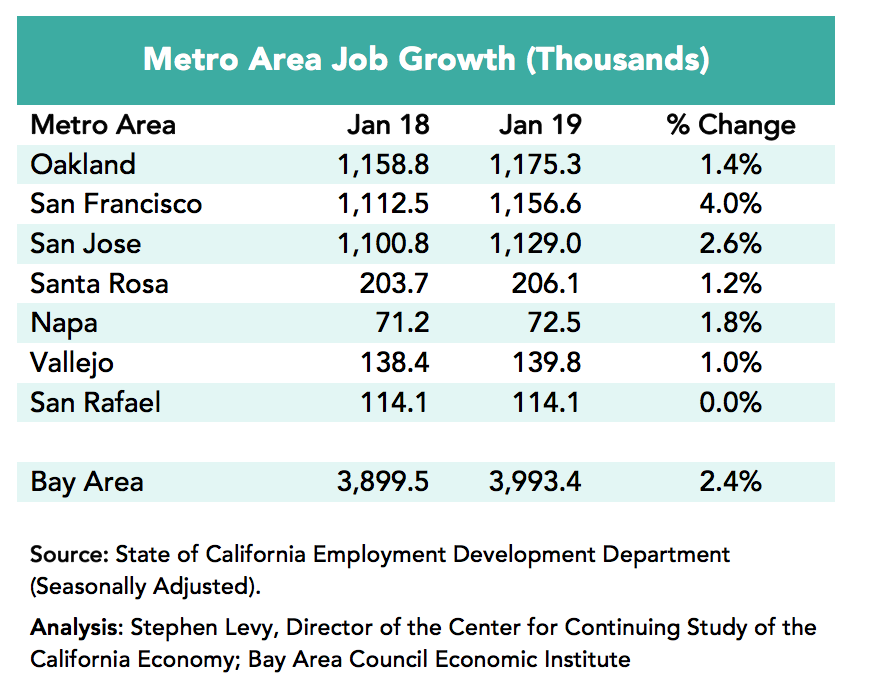
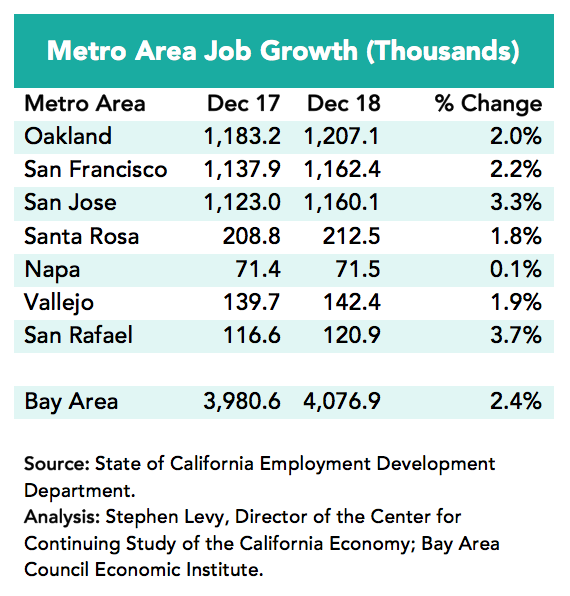
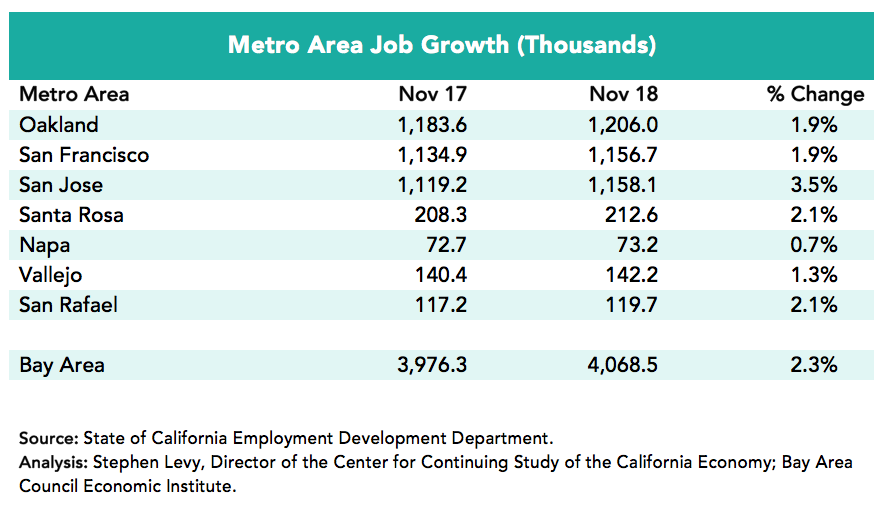
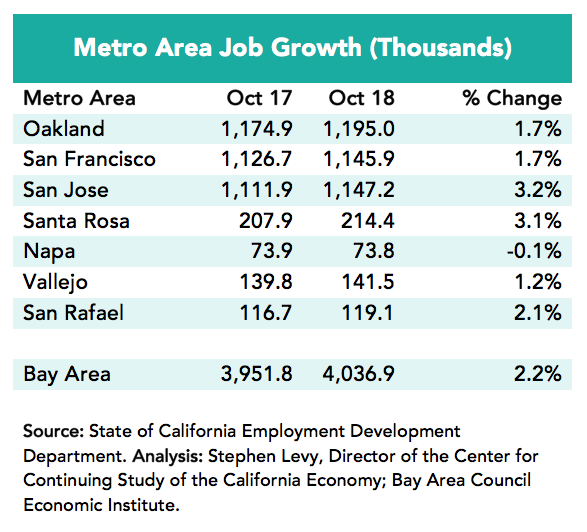
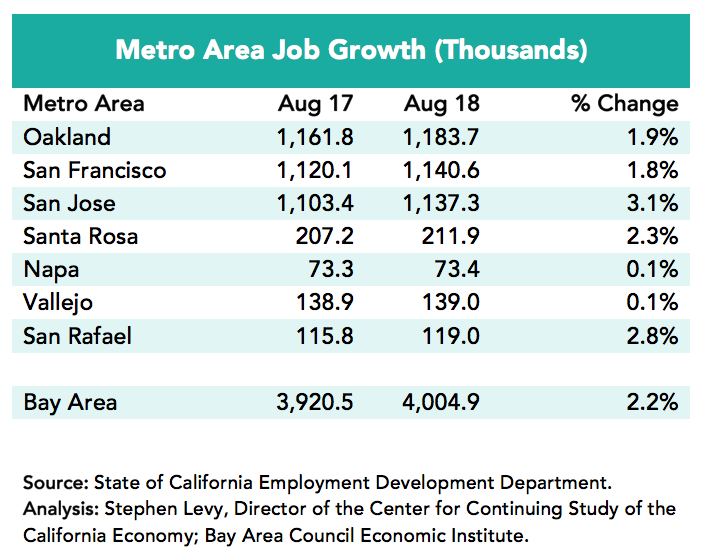
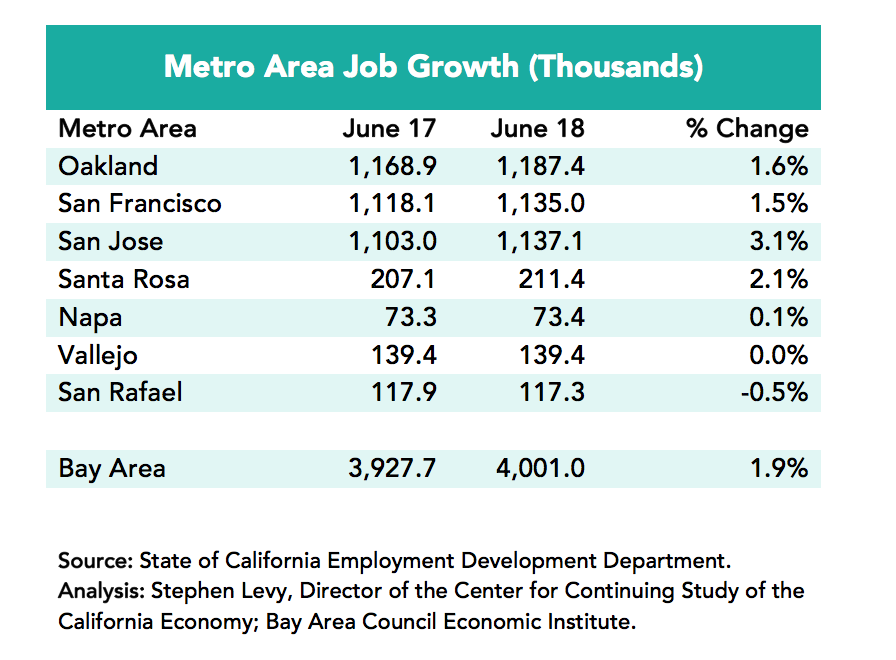
Payroll Job Growth Shows the San Jose Metro Area Leads the Region
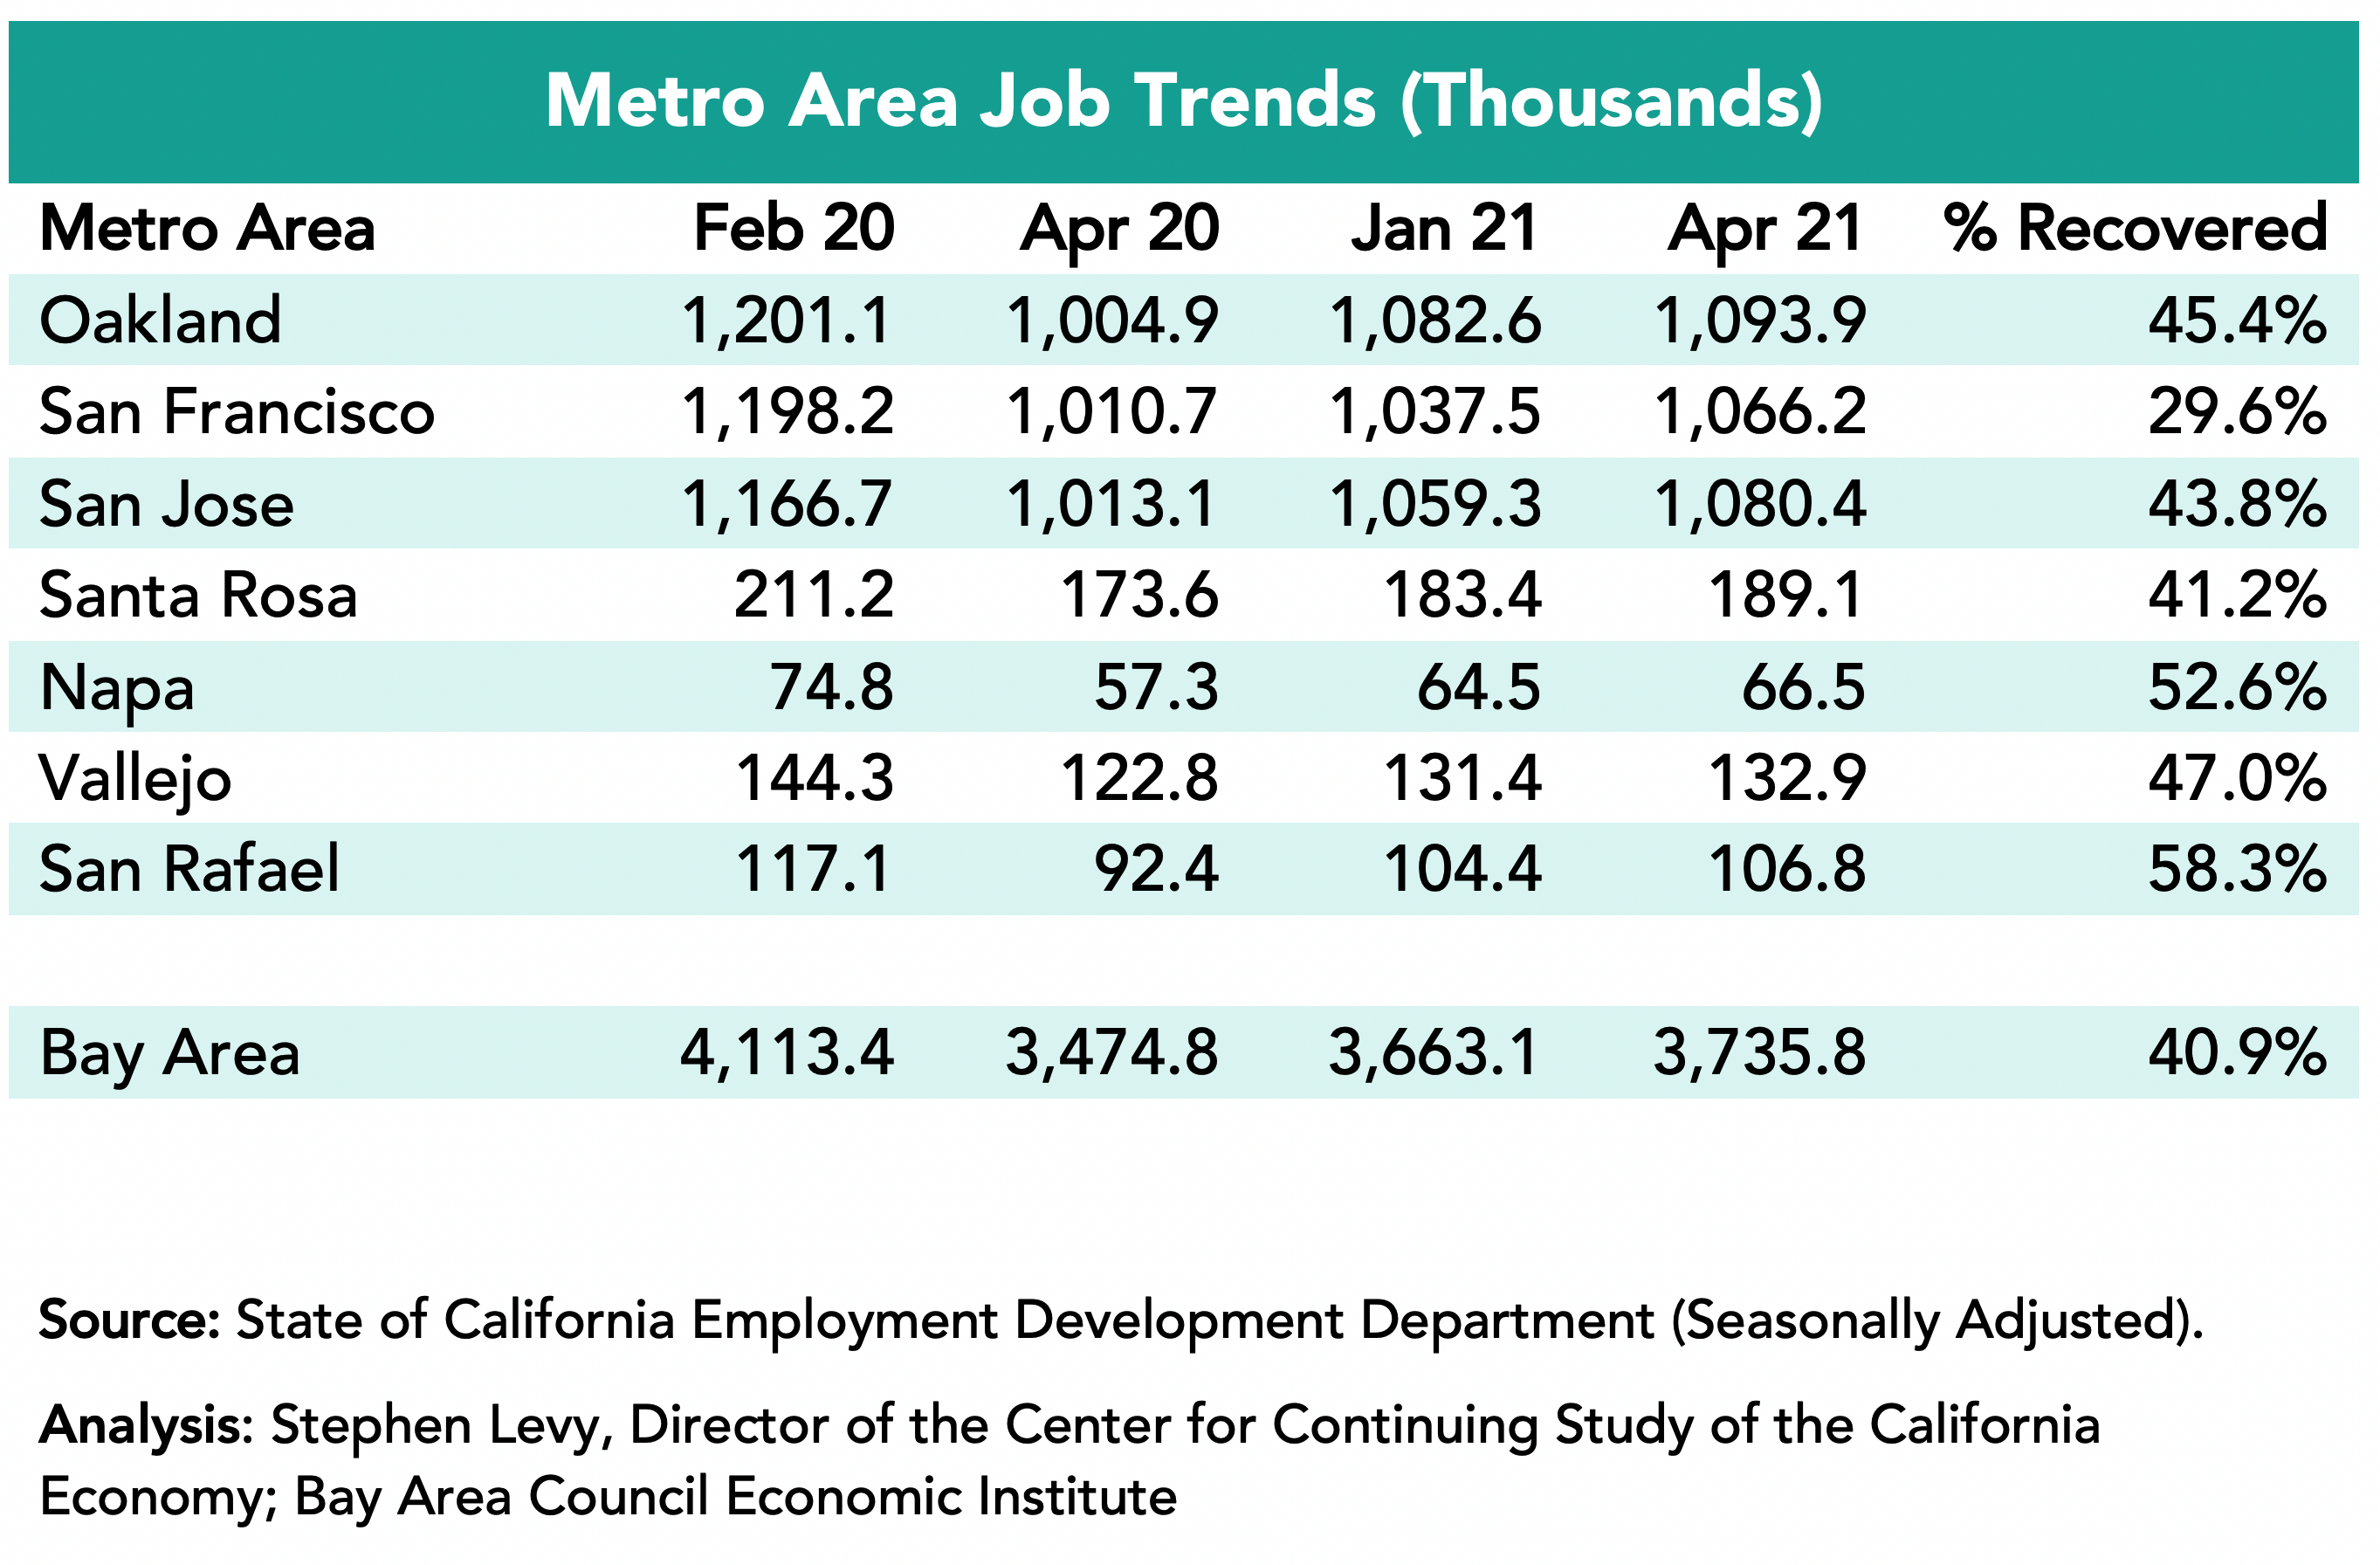
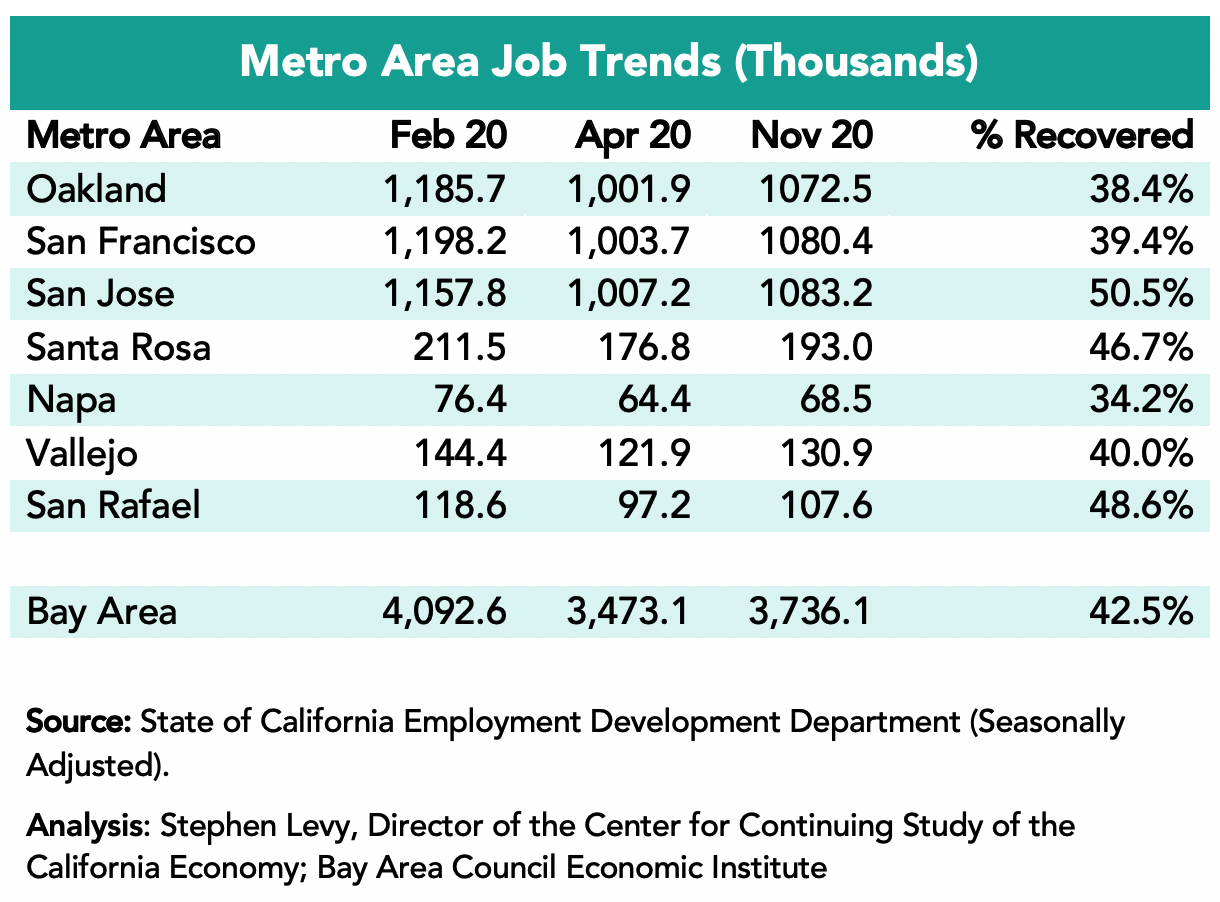
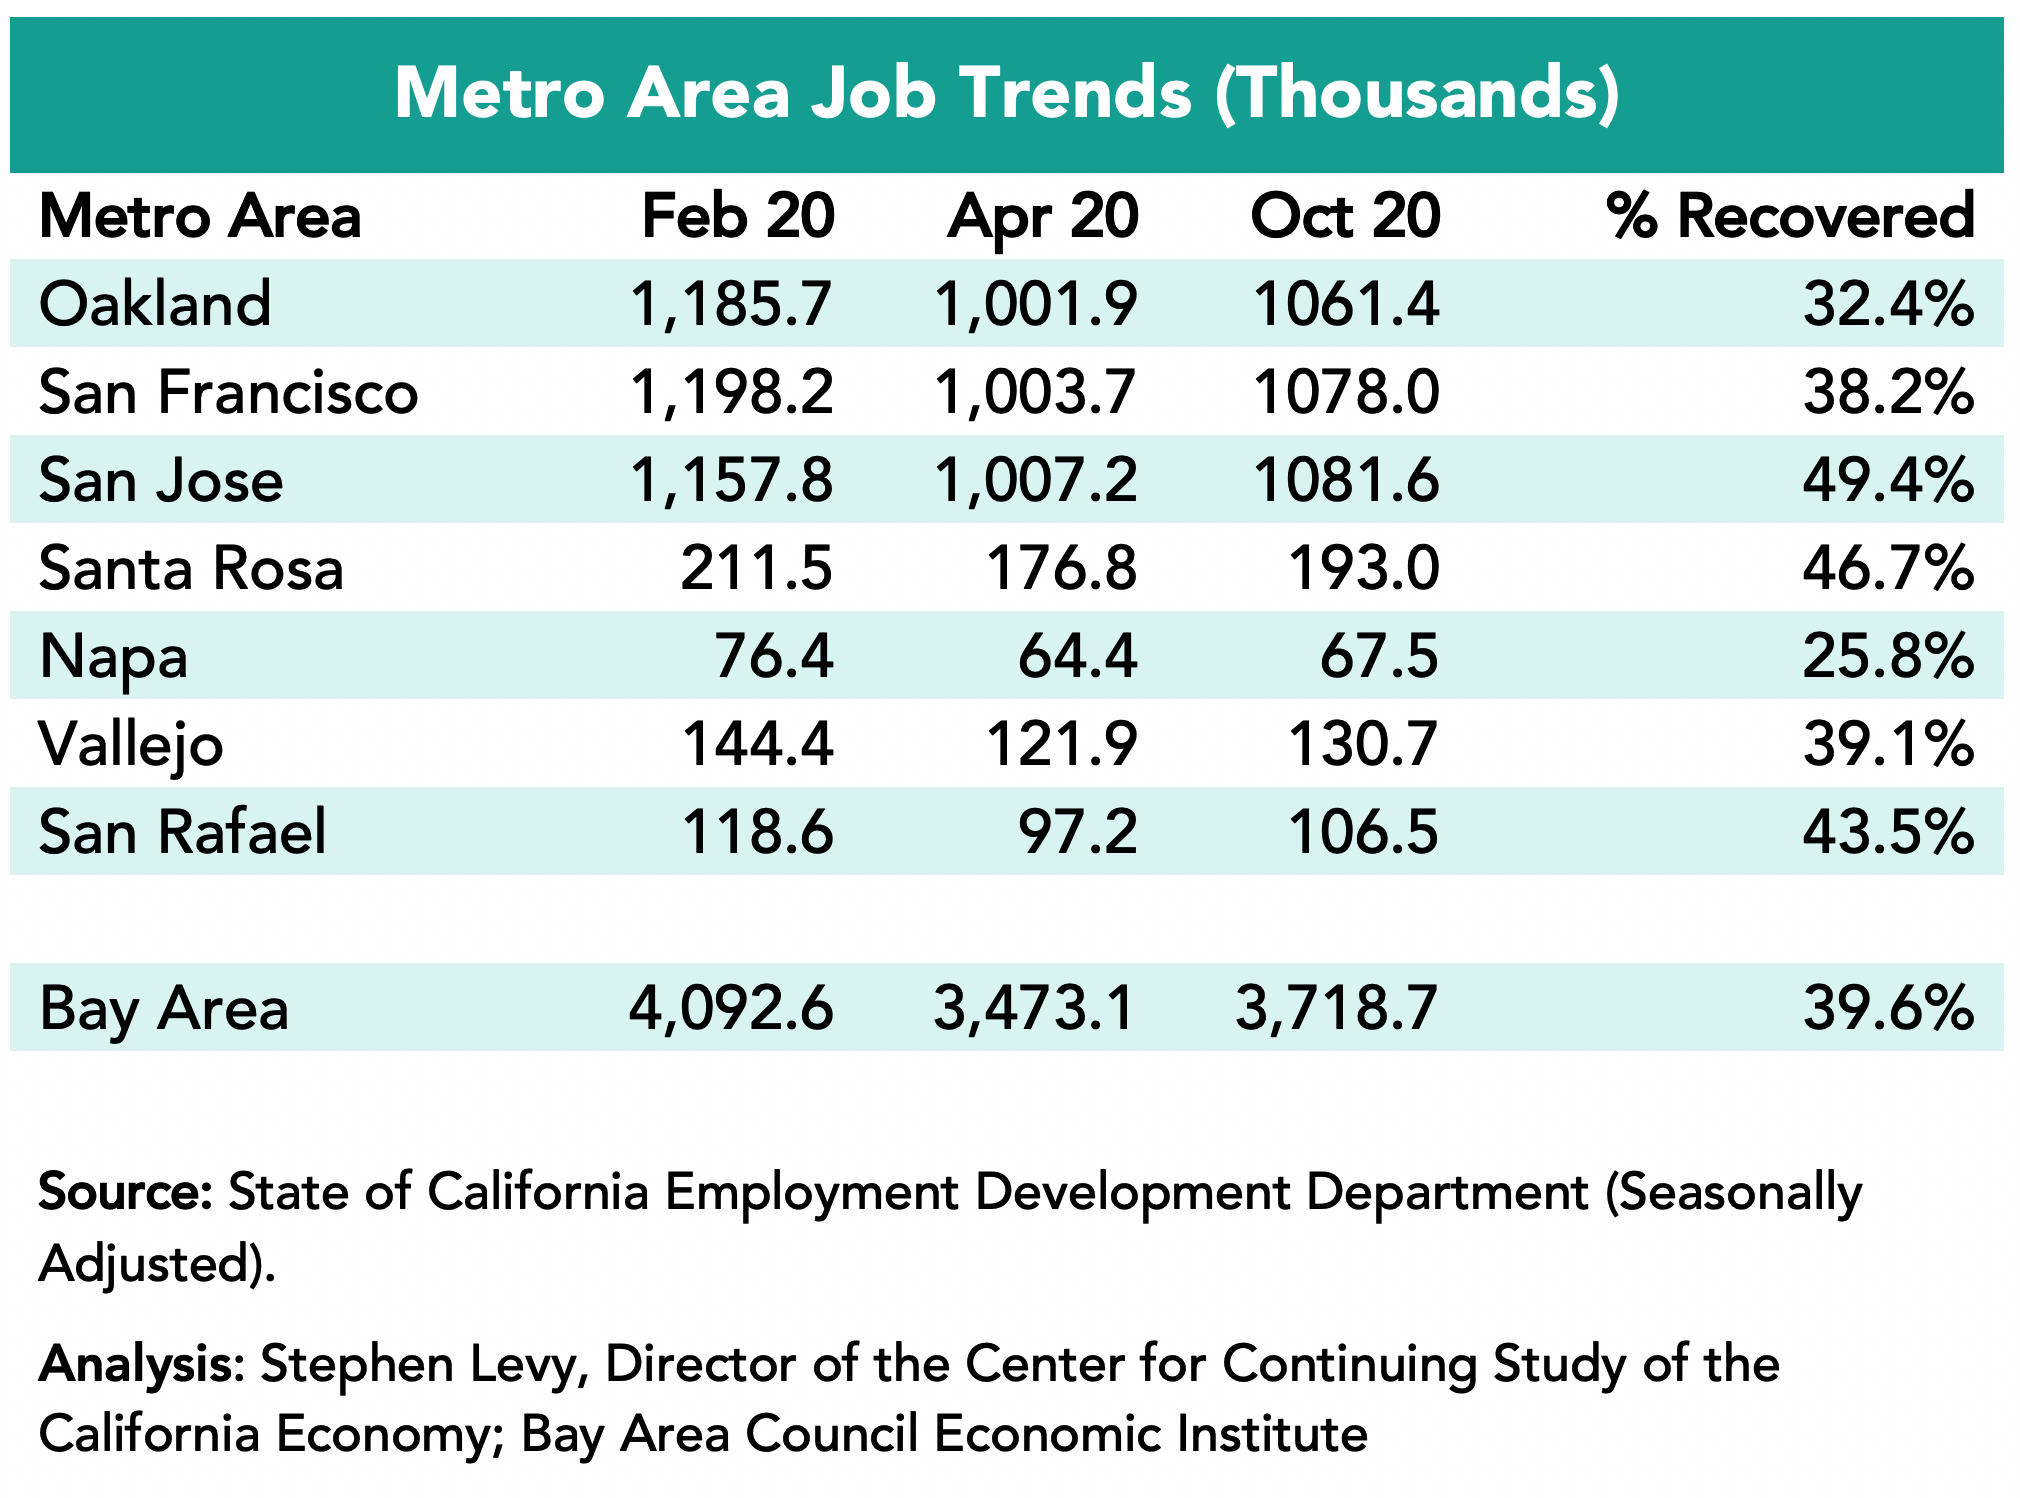
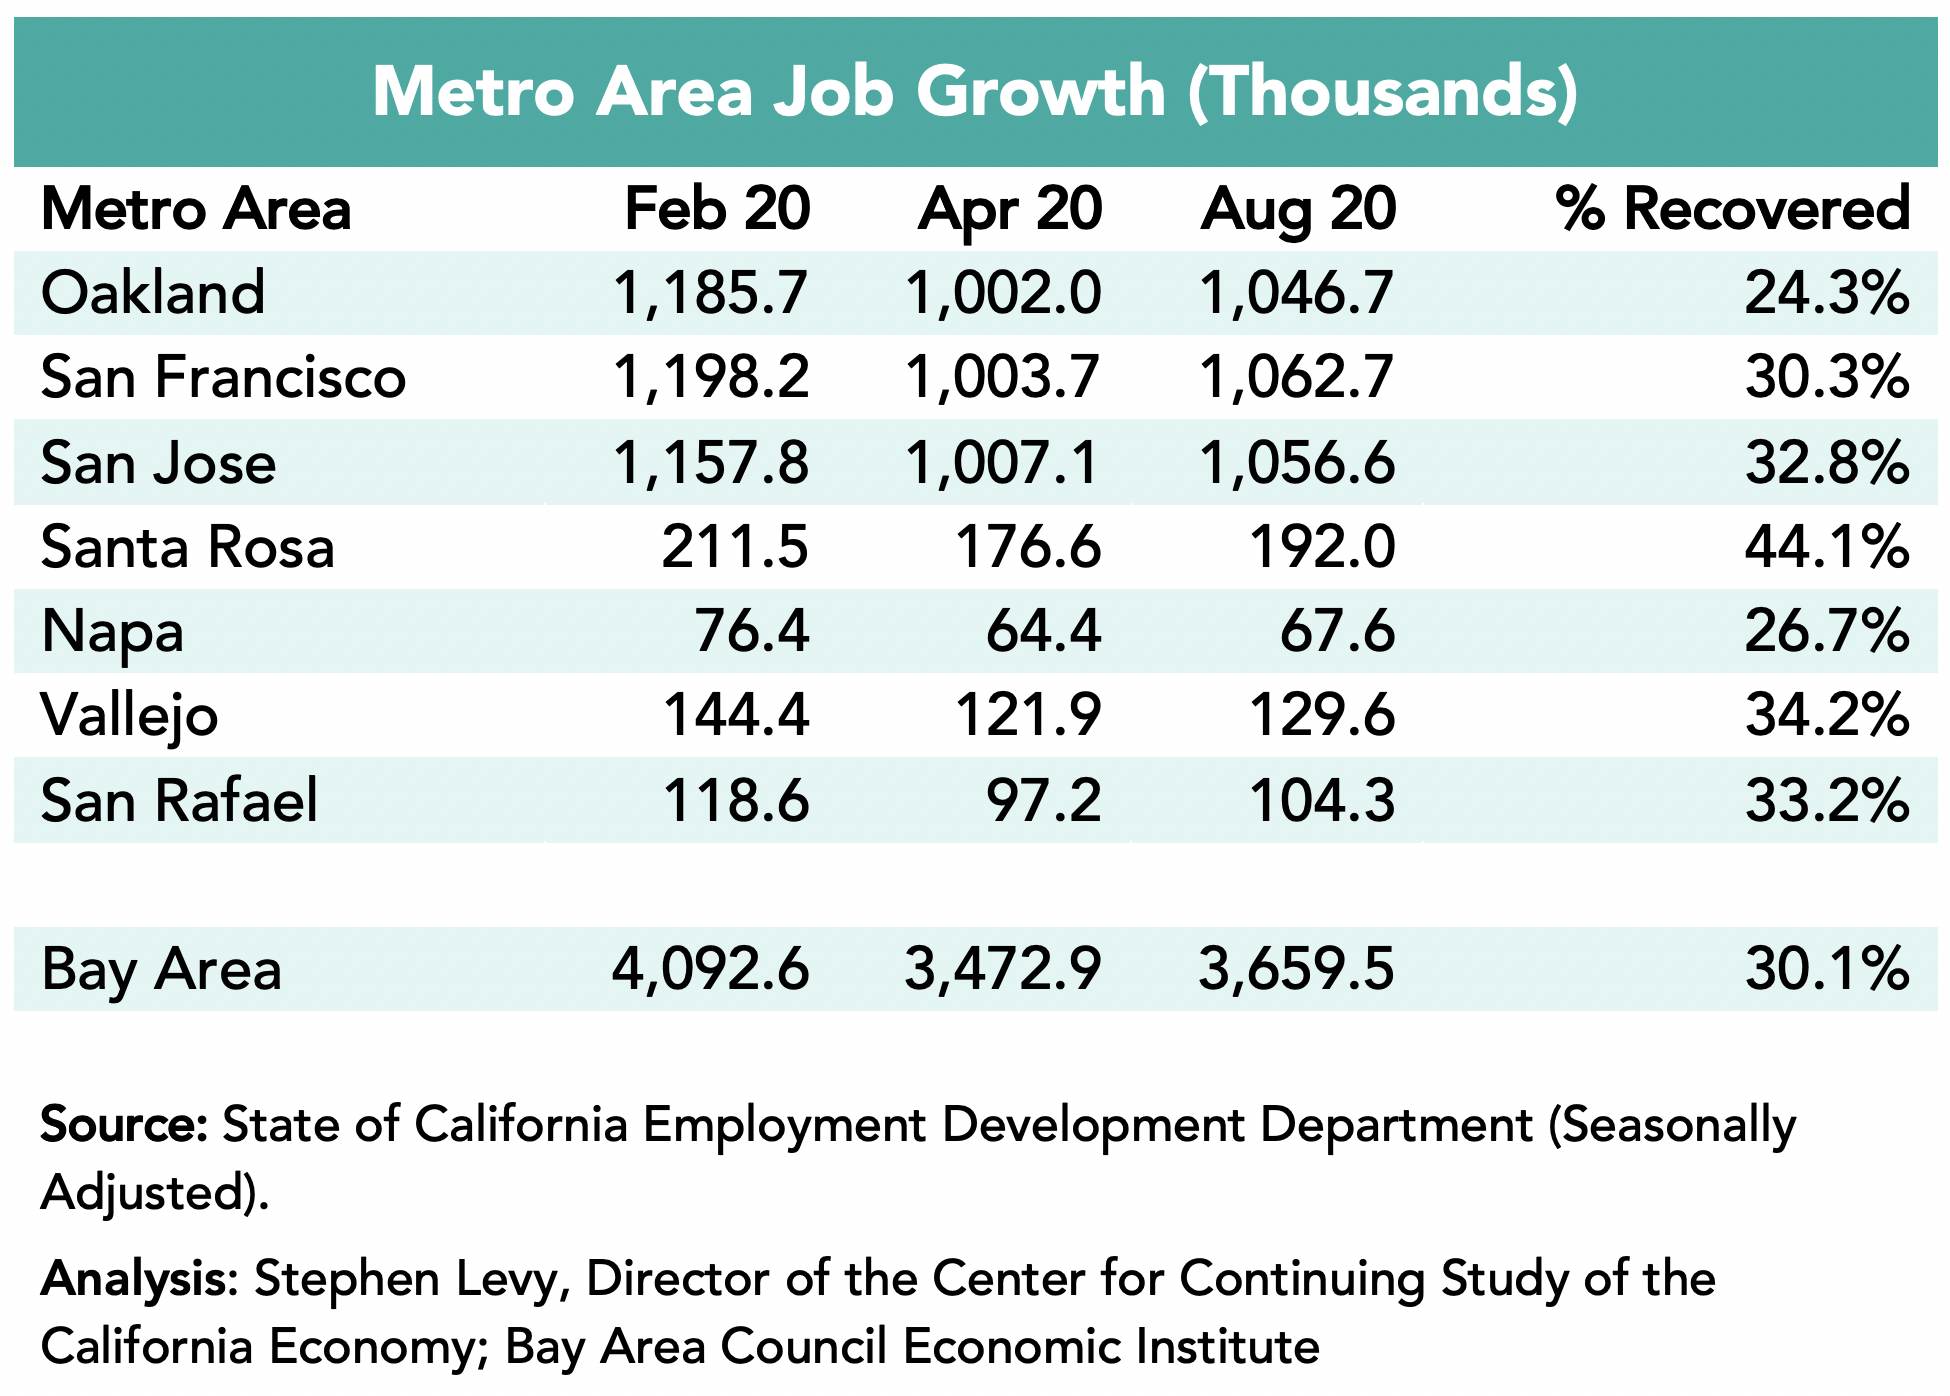
Though growth has slowed in recent months, the Bay Area added 165,000 jobs in the past year (+4.2%) led by a gain of 62,300 in the San Francisco metro area though SF has recovered just 92.4.3% of the jobs lost between February and April 2020. The San Jose metro area added 53,200 jobs and by October 2022 had recovered 104.7% of the payroll jobs lost between February and April 2020. The Oakland metro area added 39,000 jobs during the past year. Other metro areas have been slower to recover lost jobs.
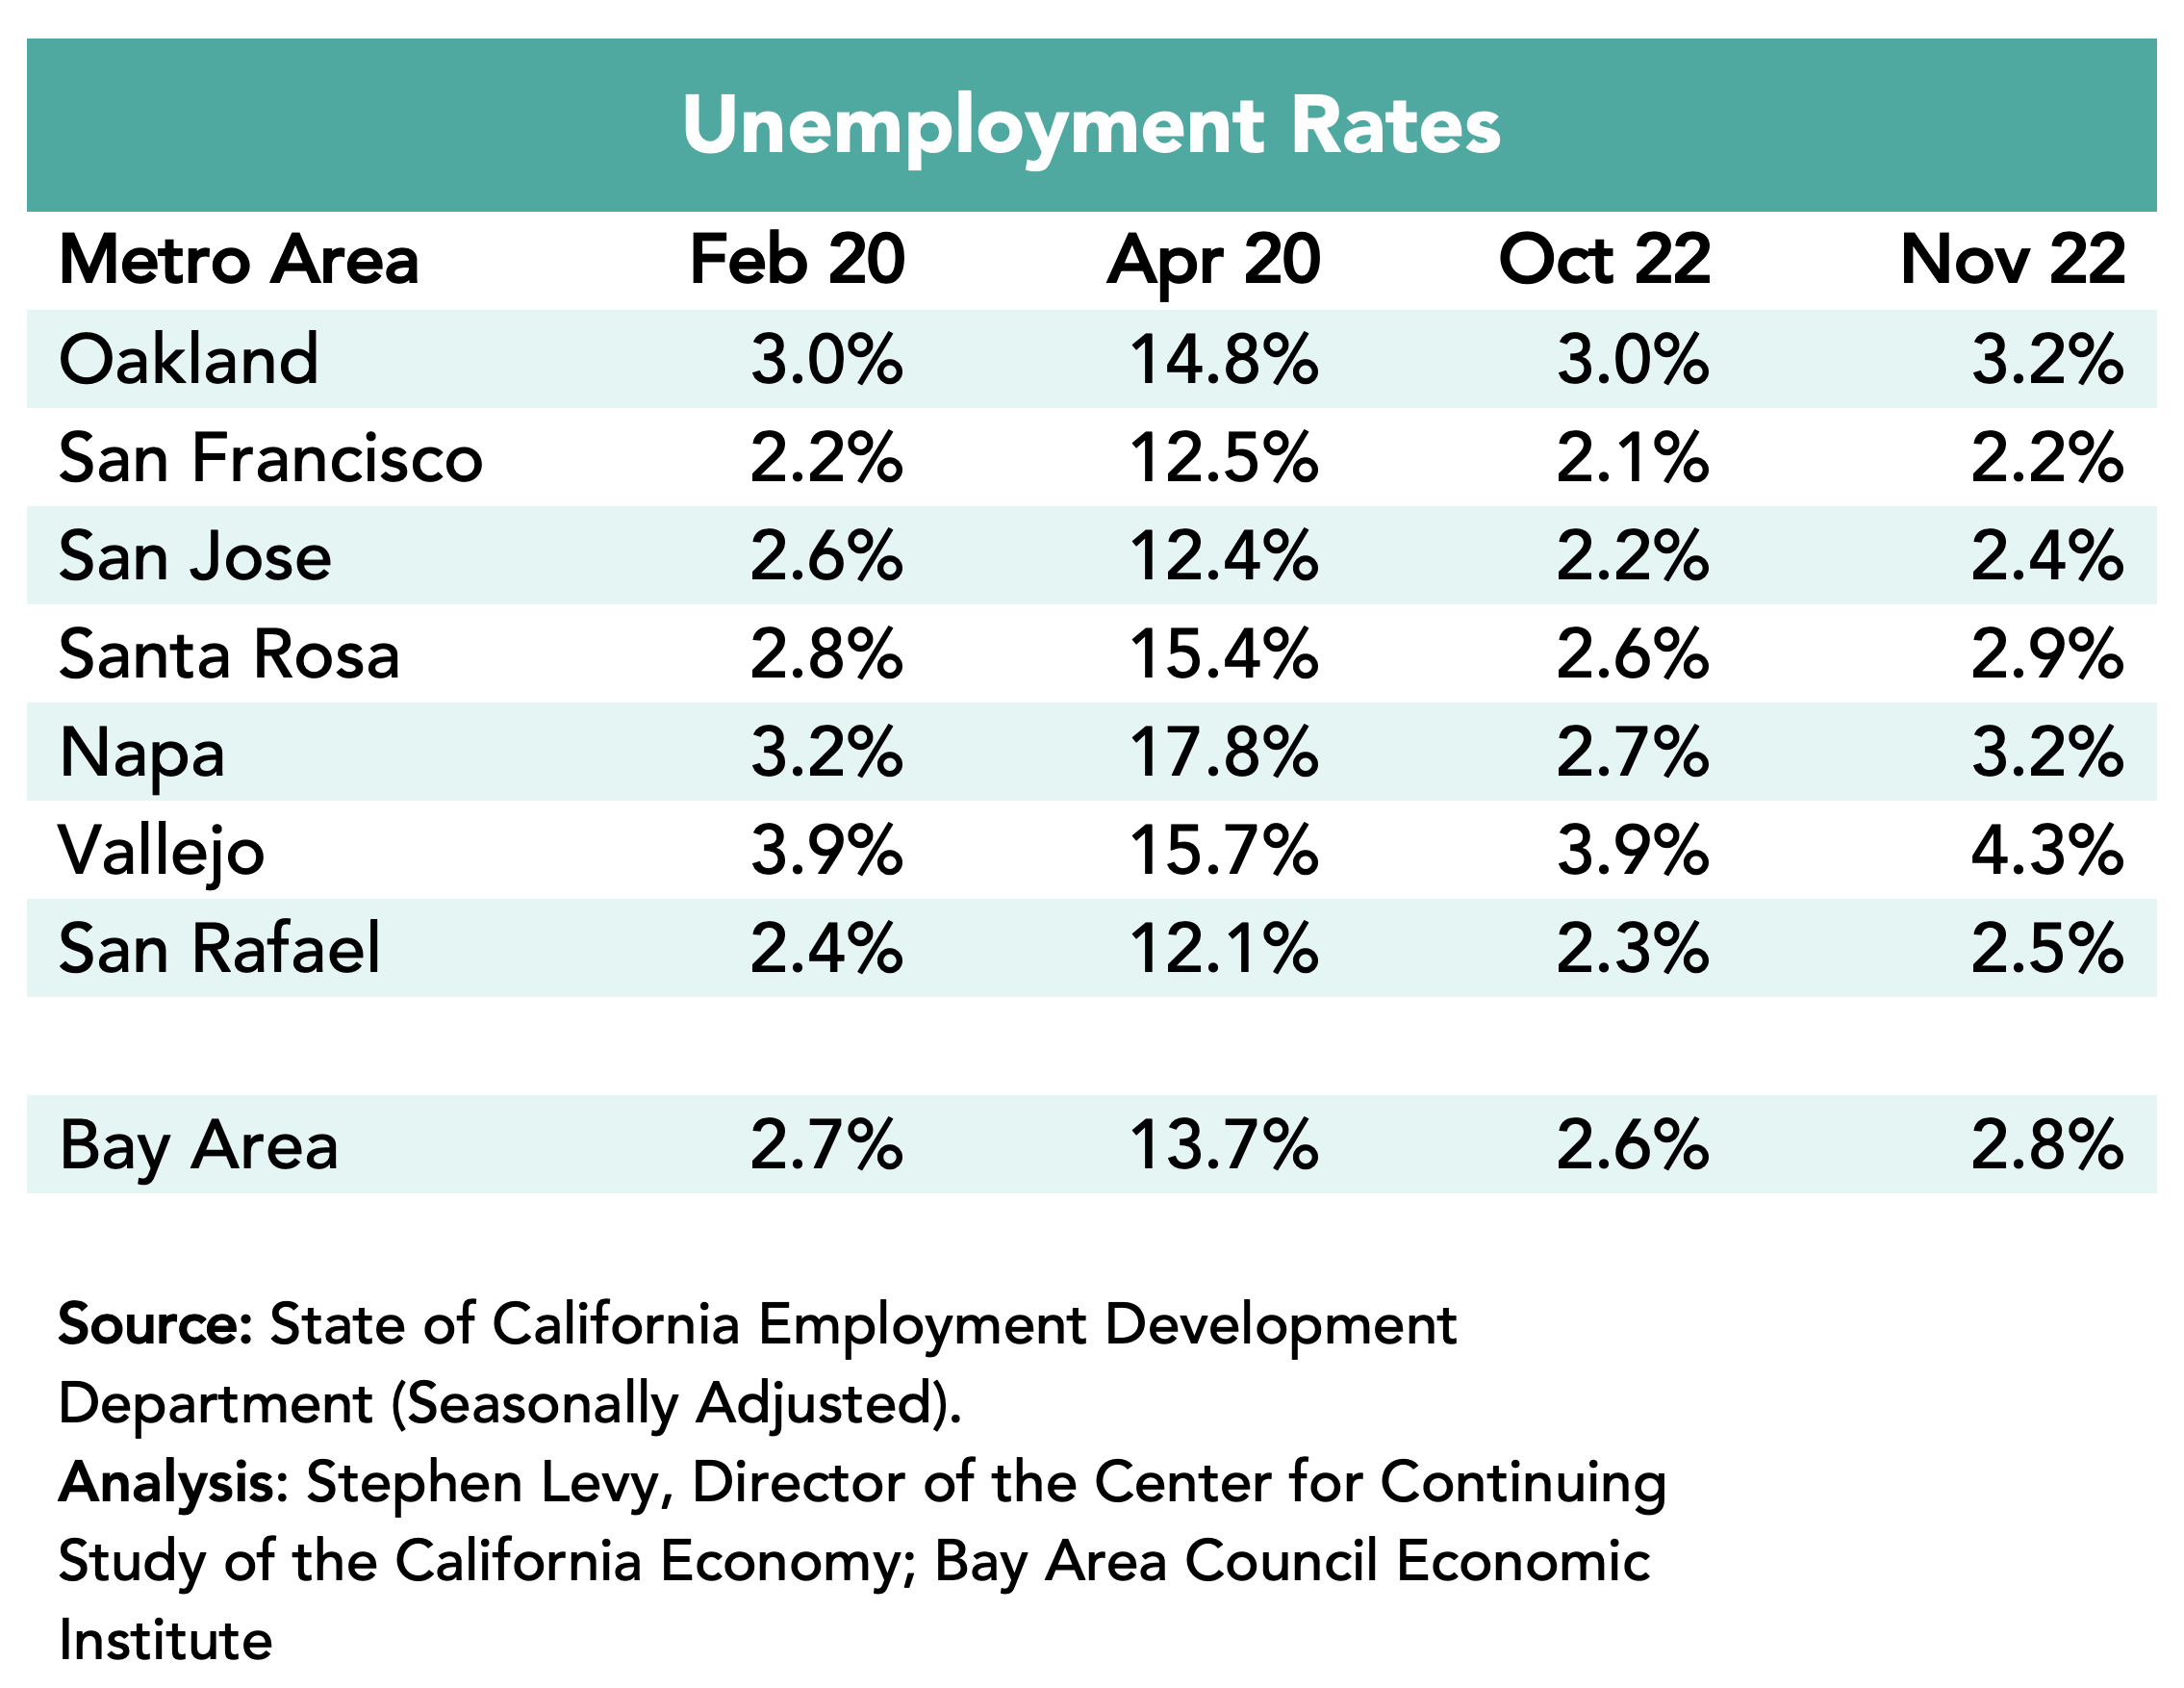
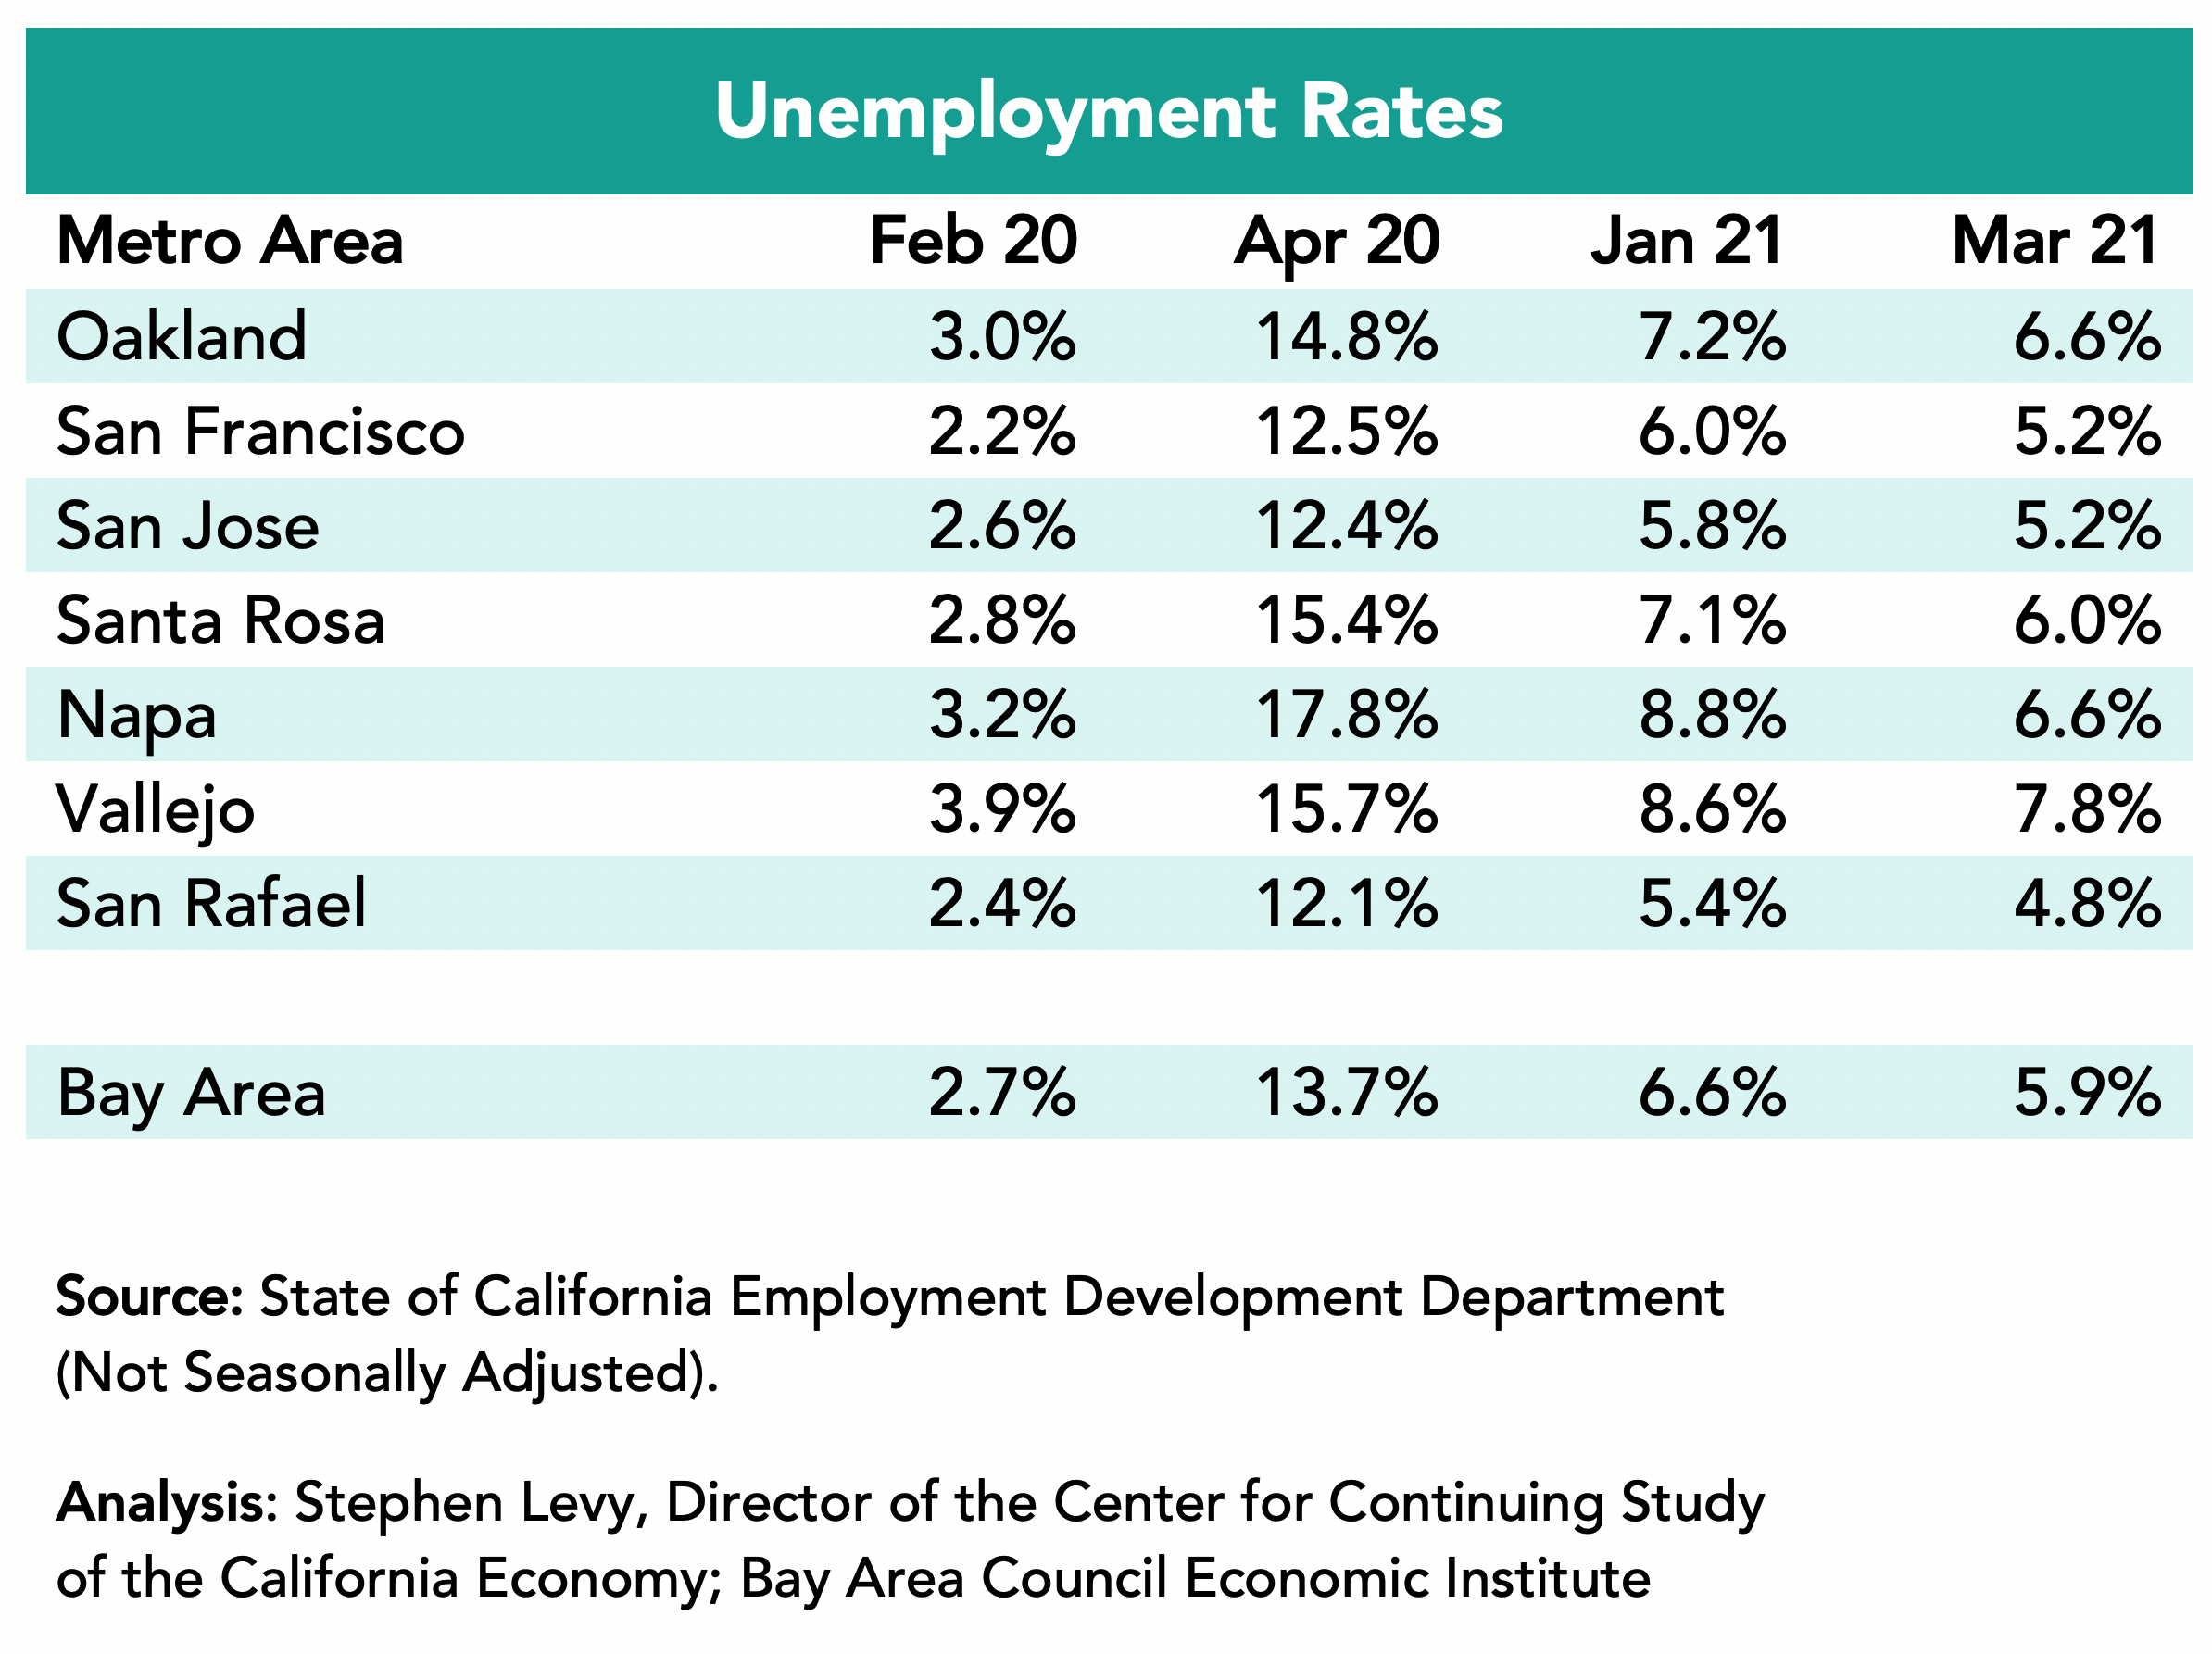
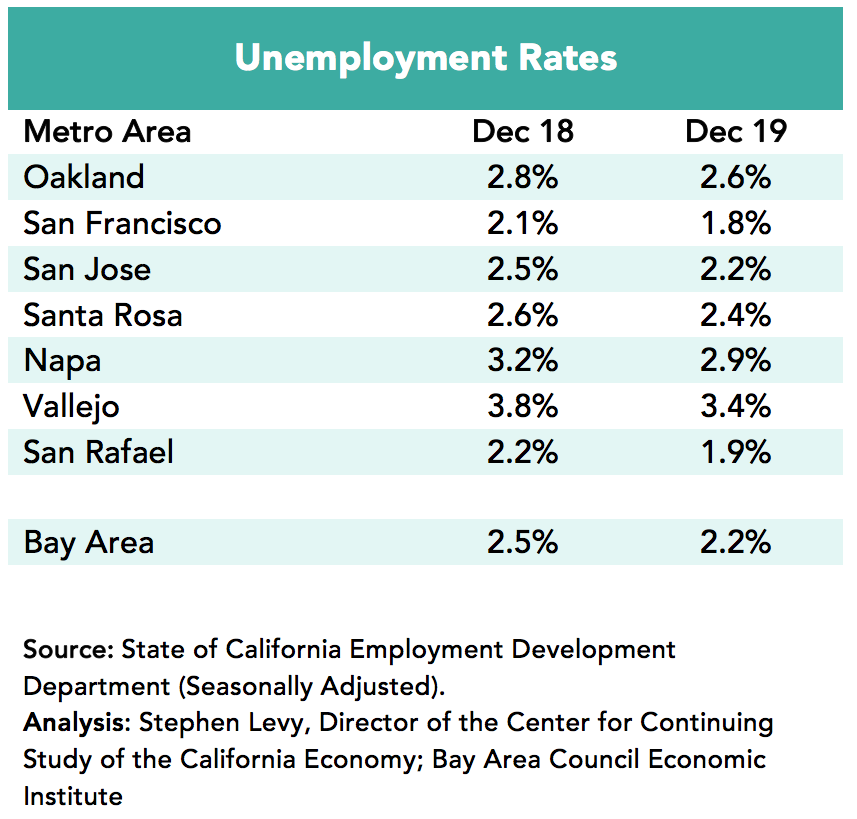
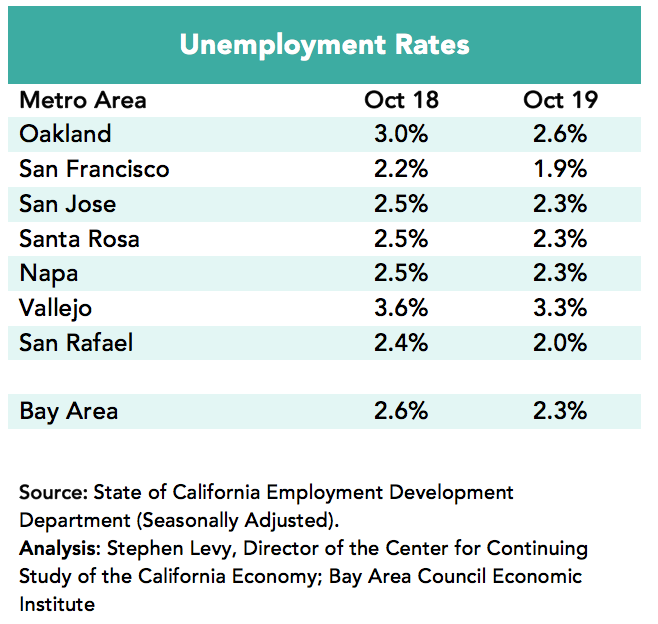
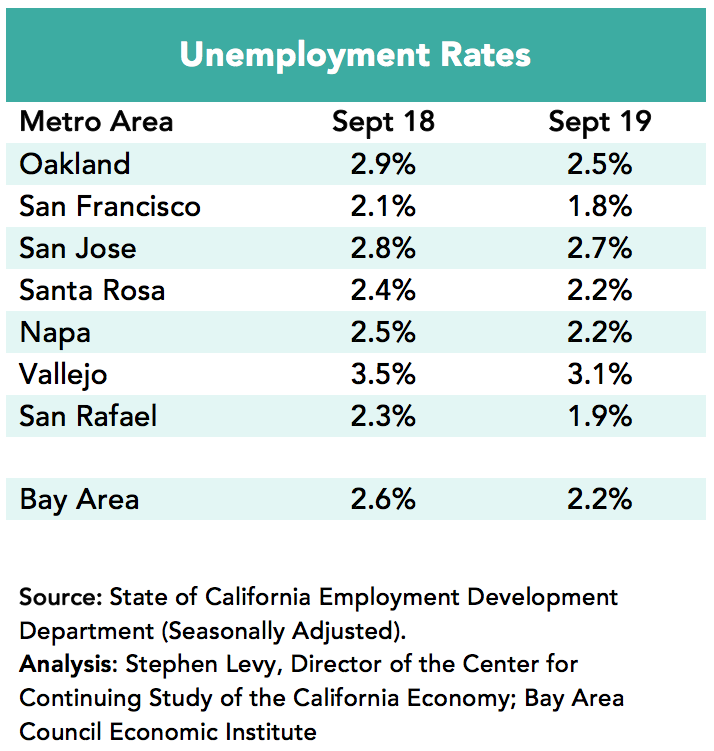
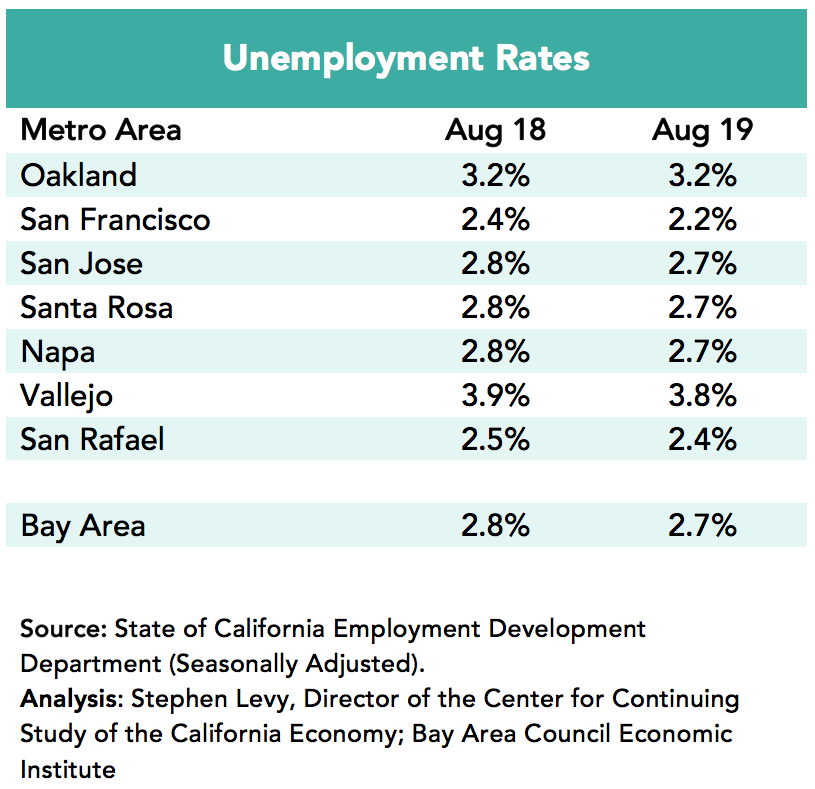
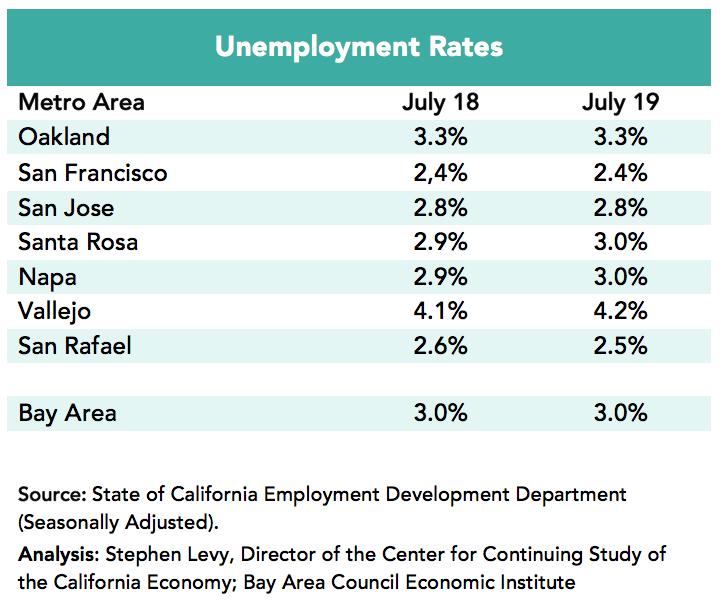
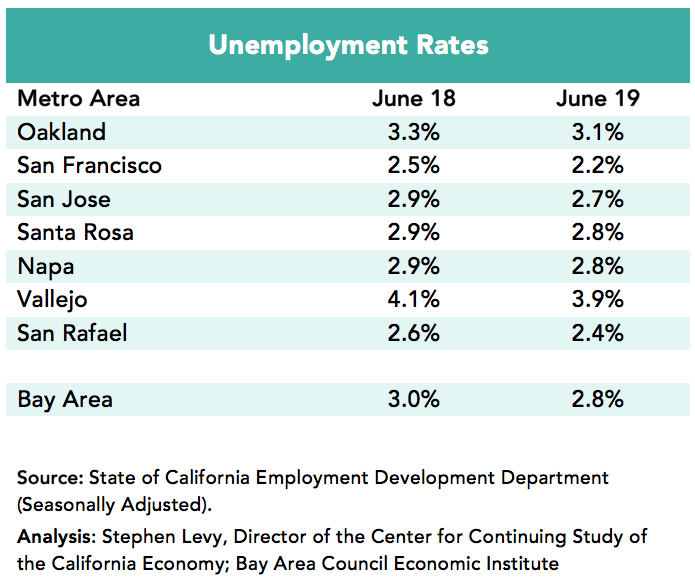
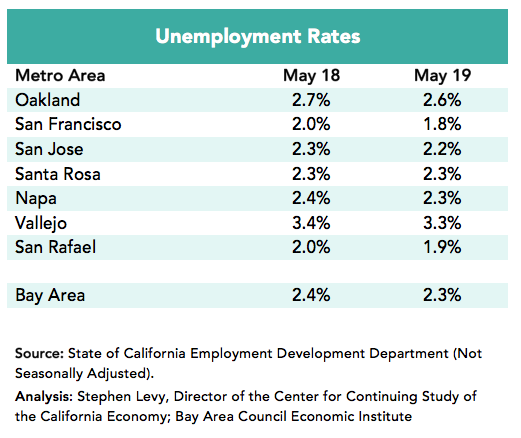
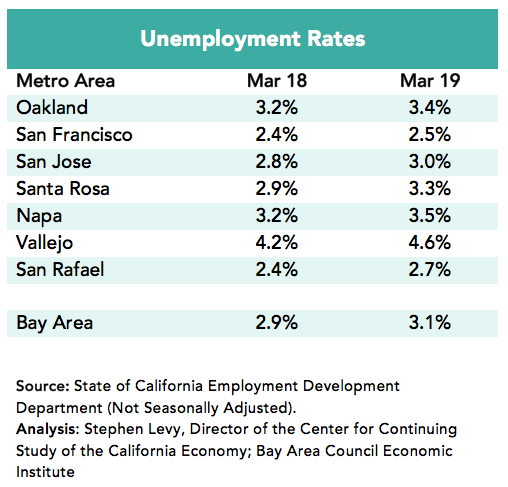
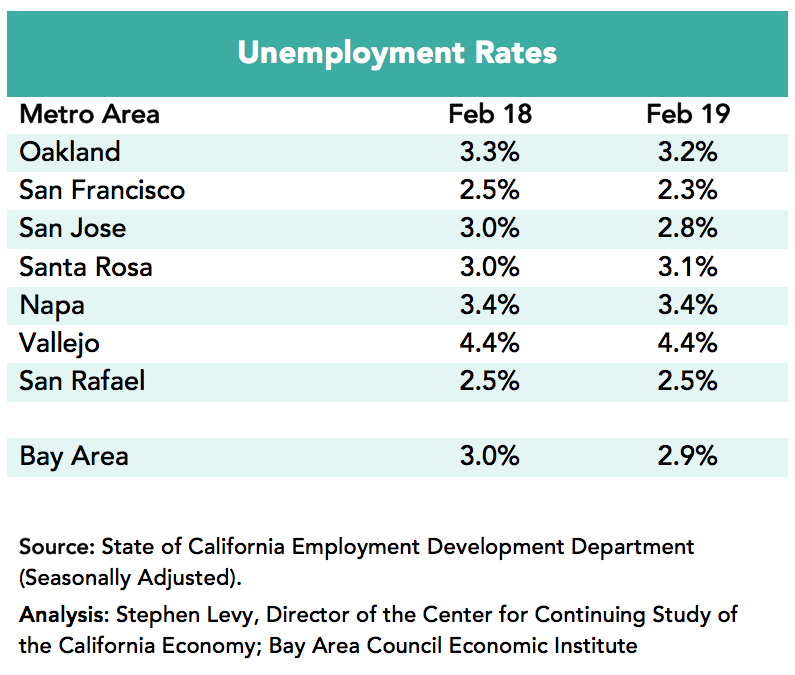
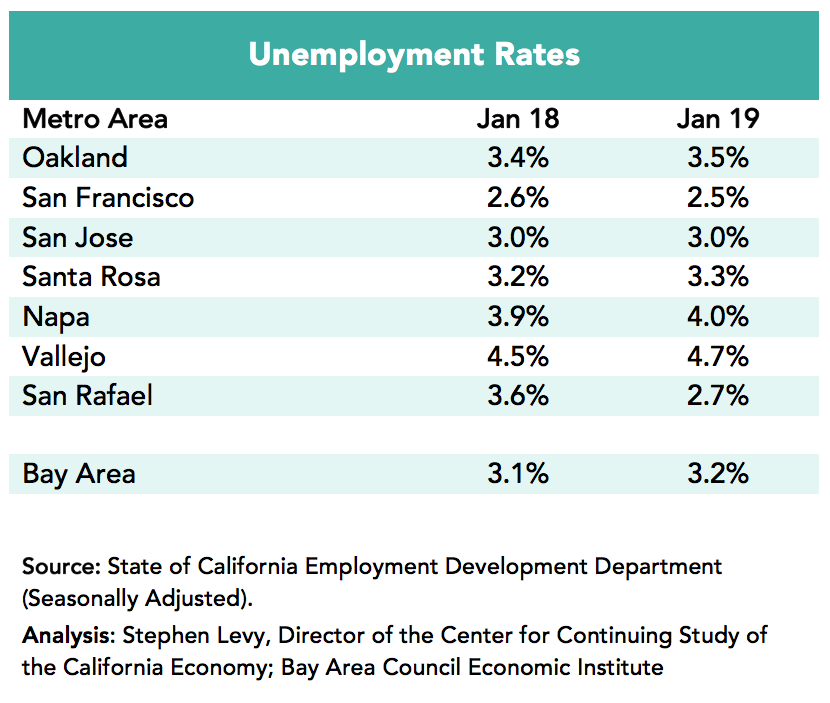
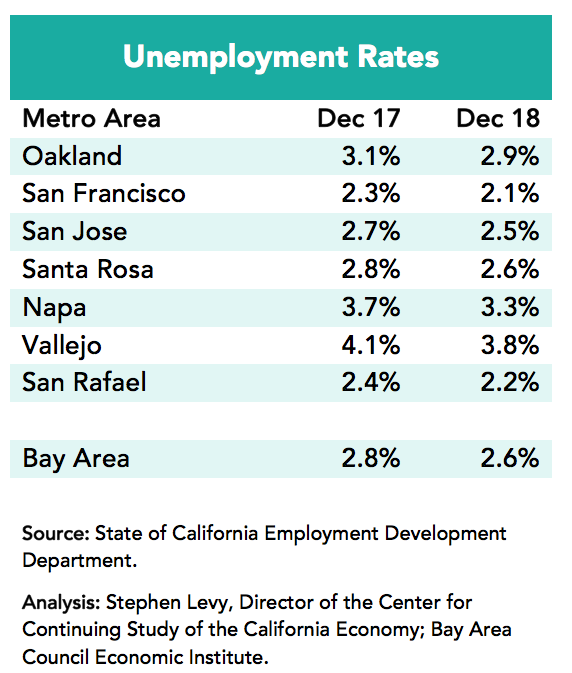
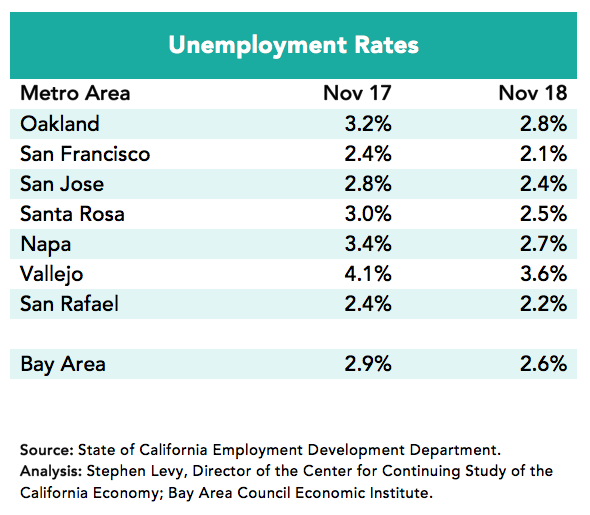
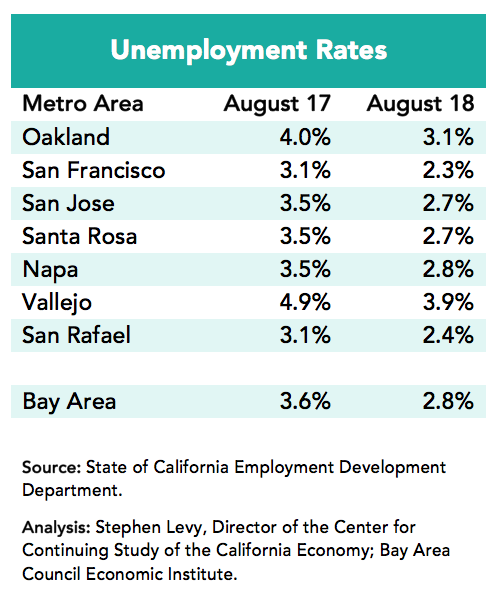
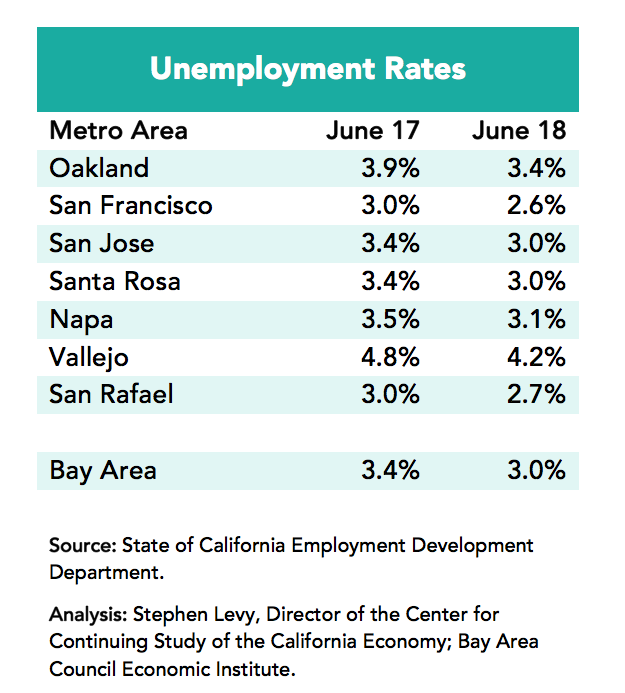
Unemployment Trends
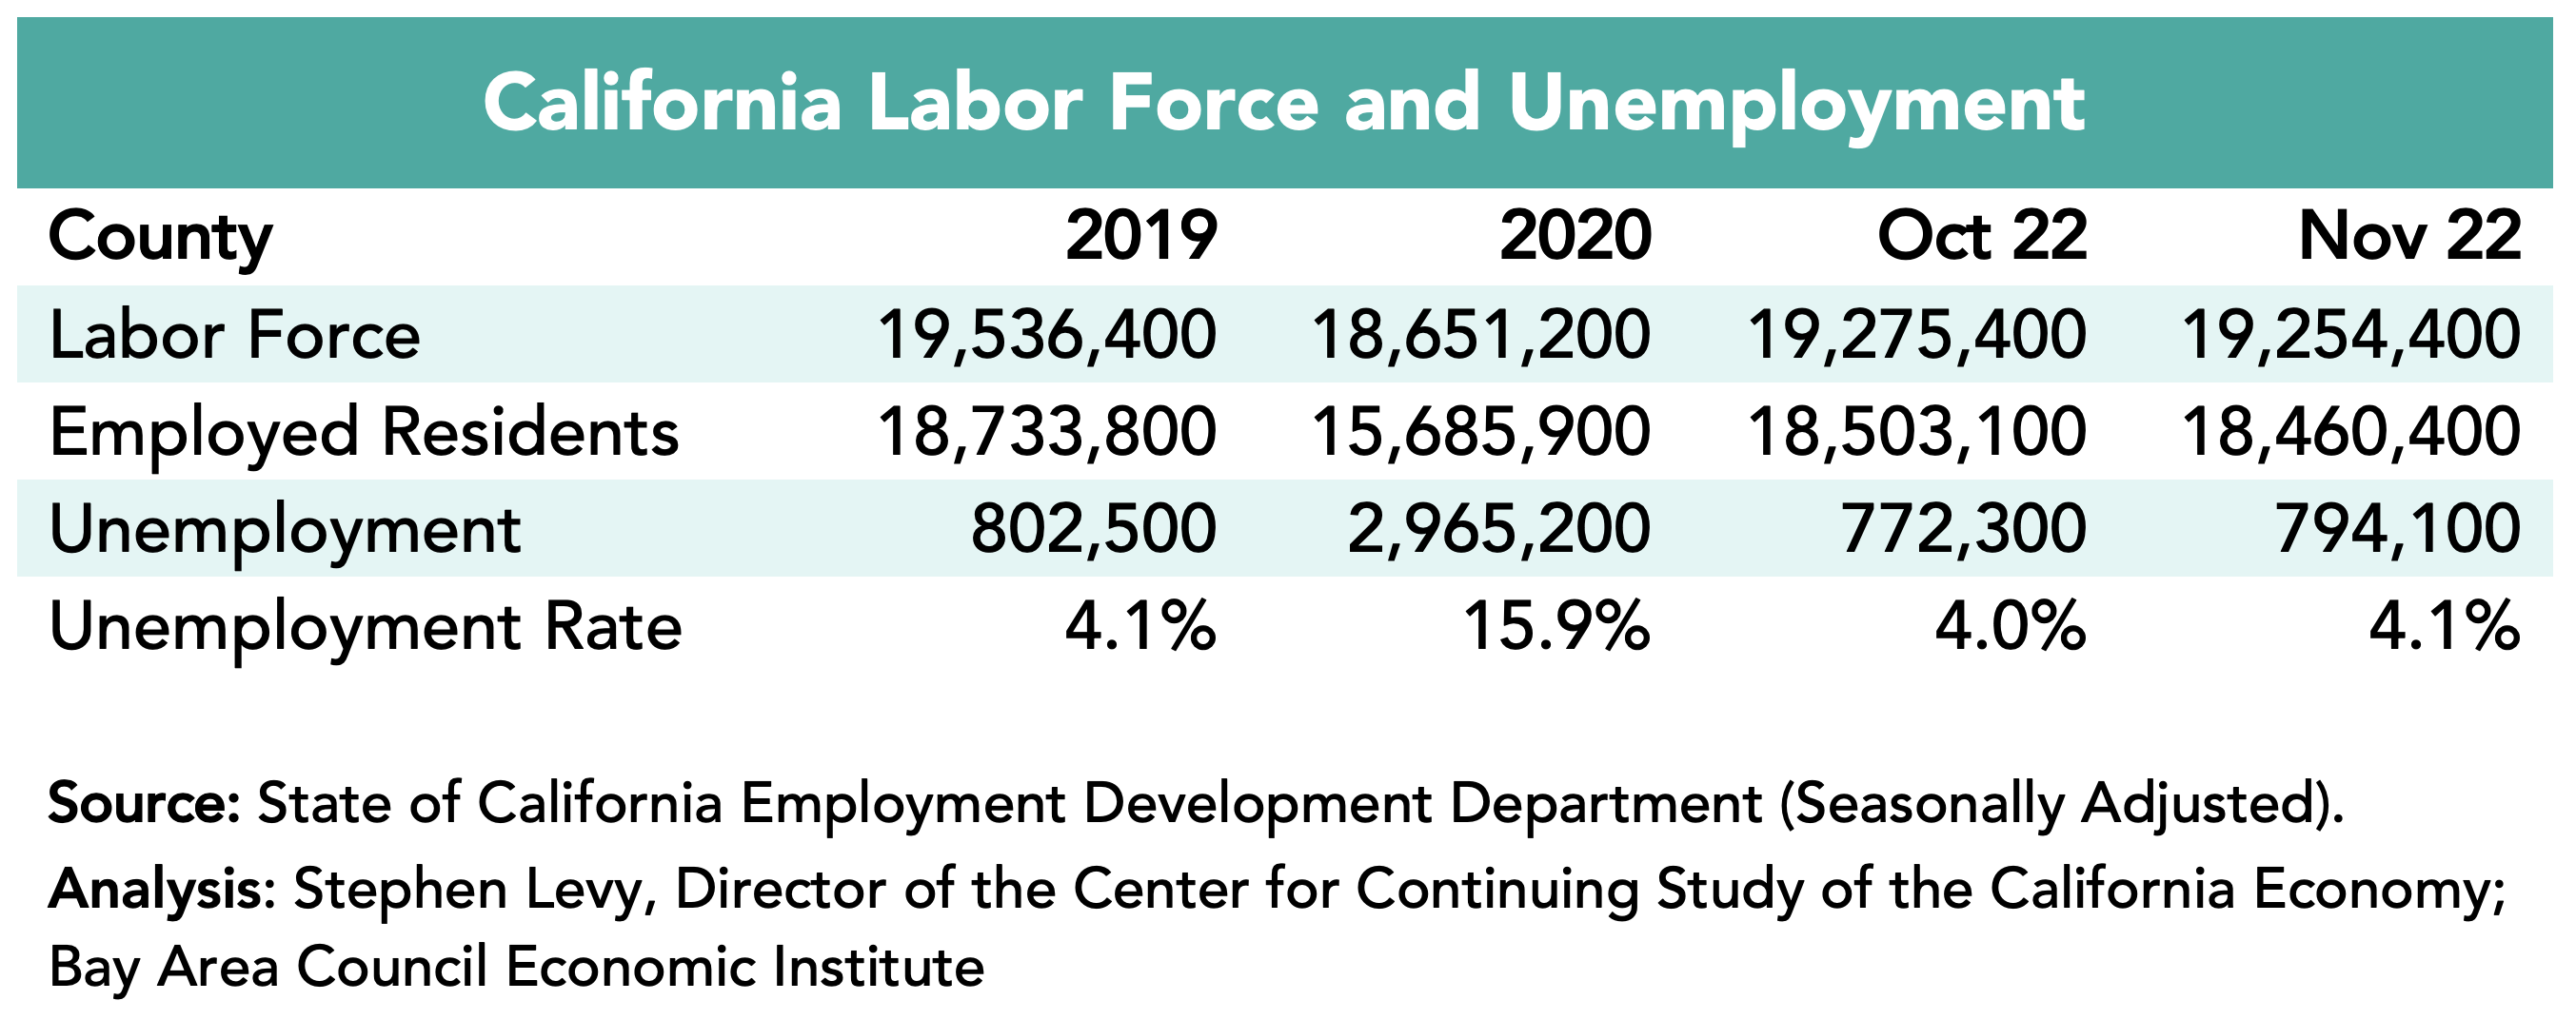
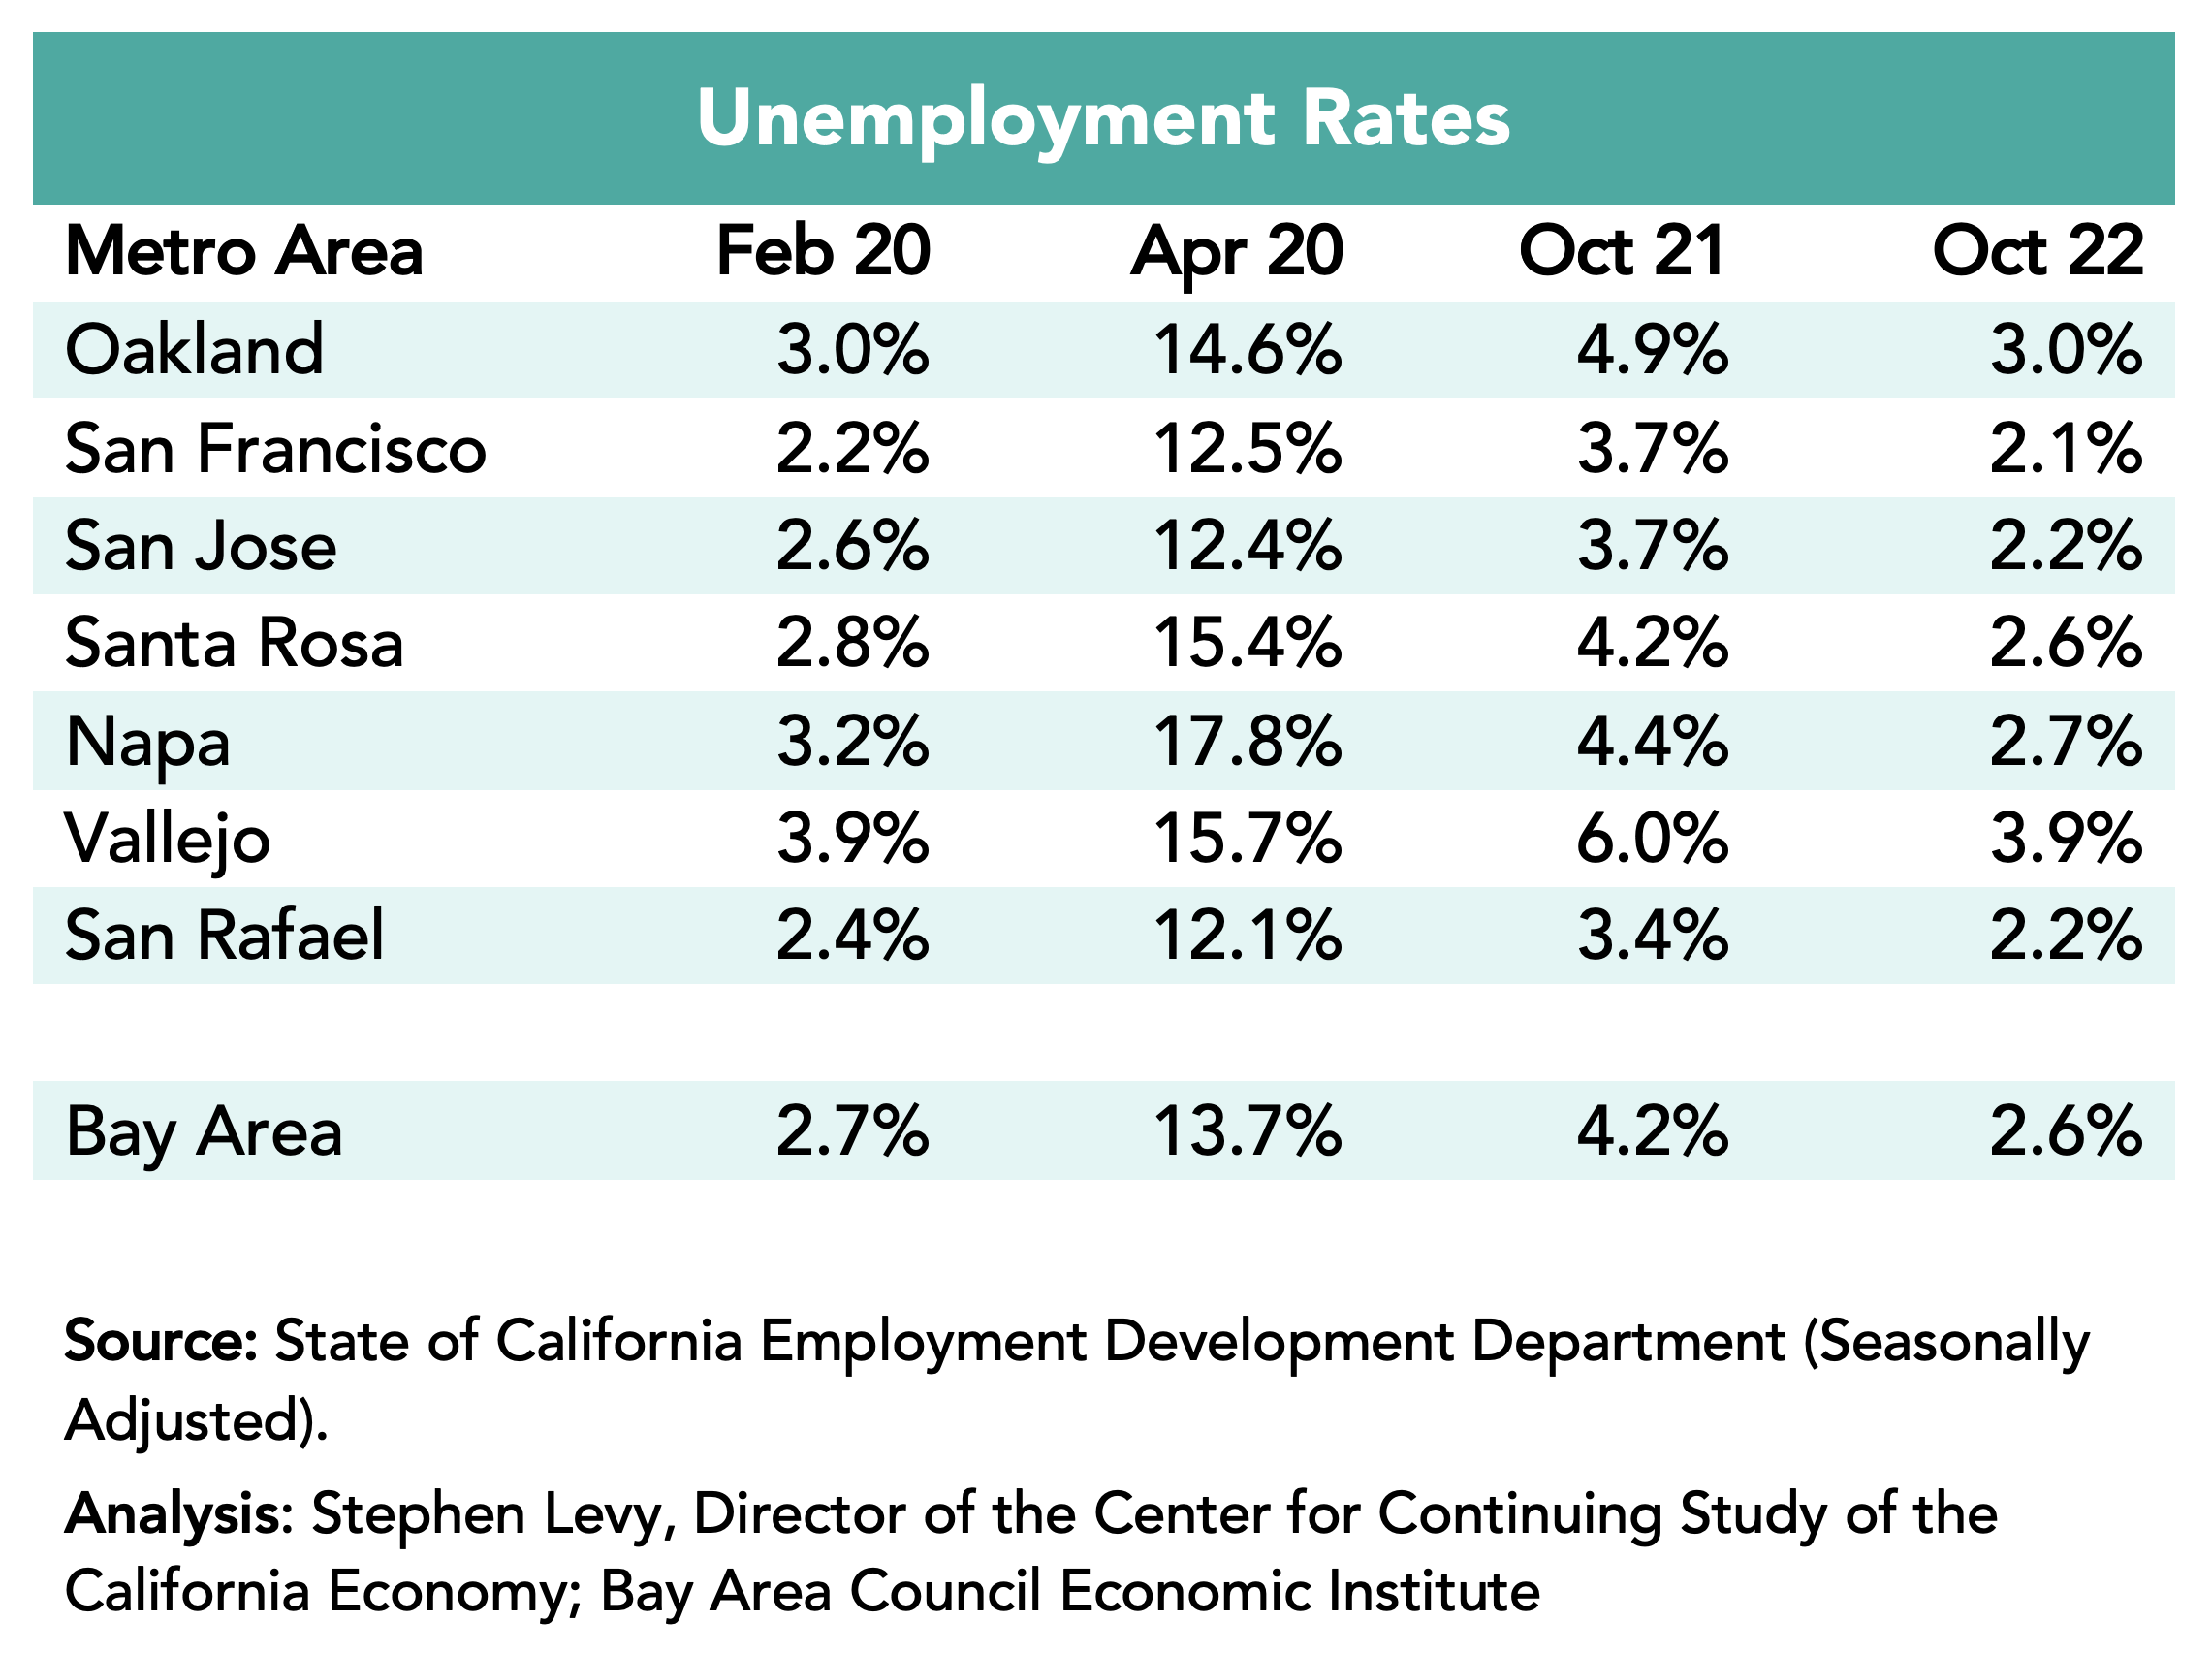
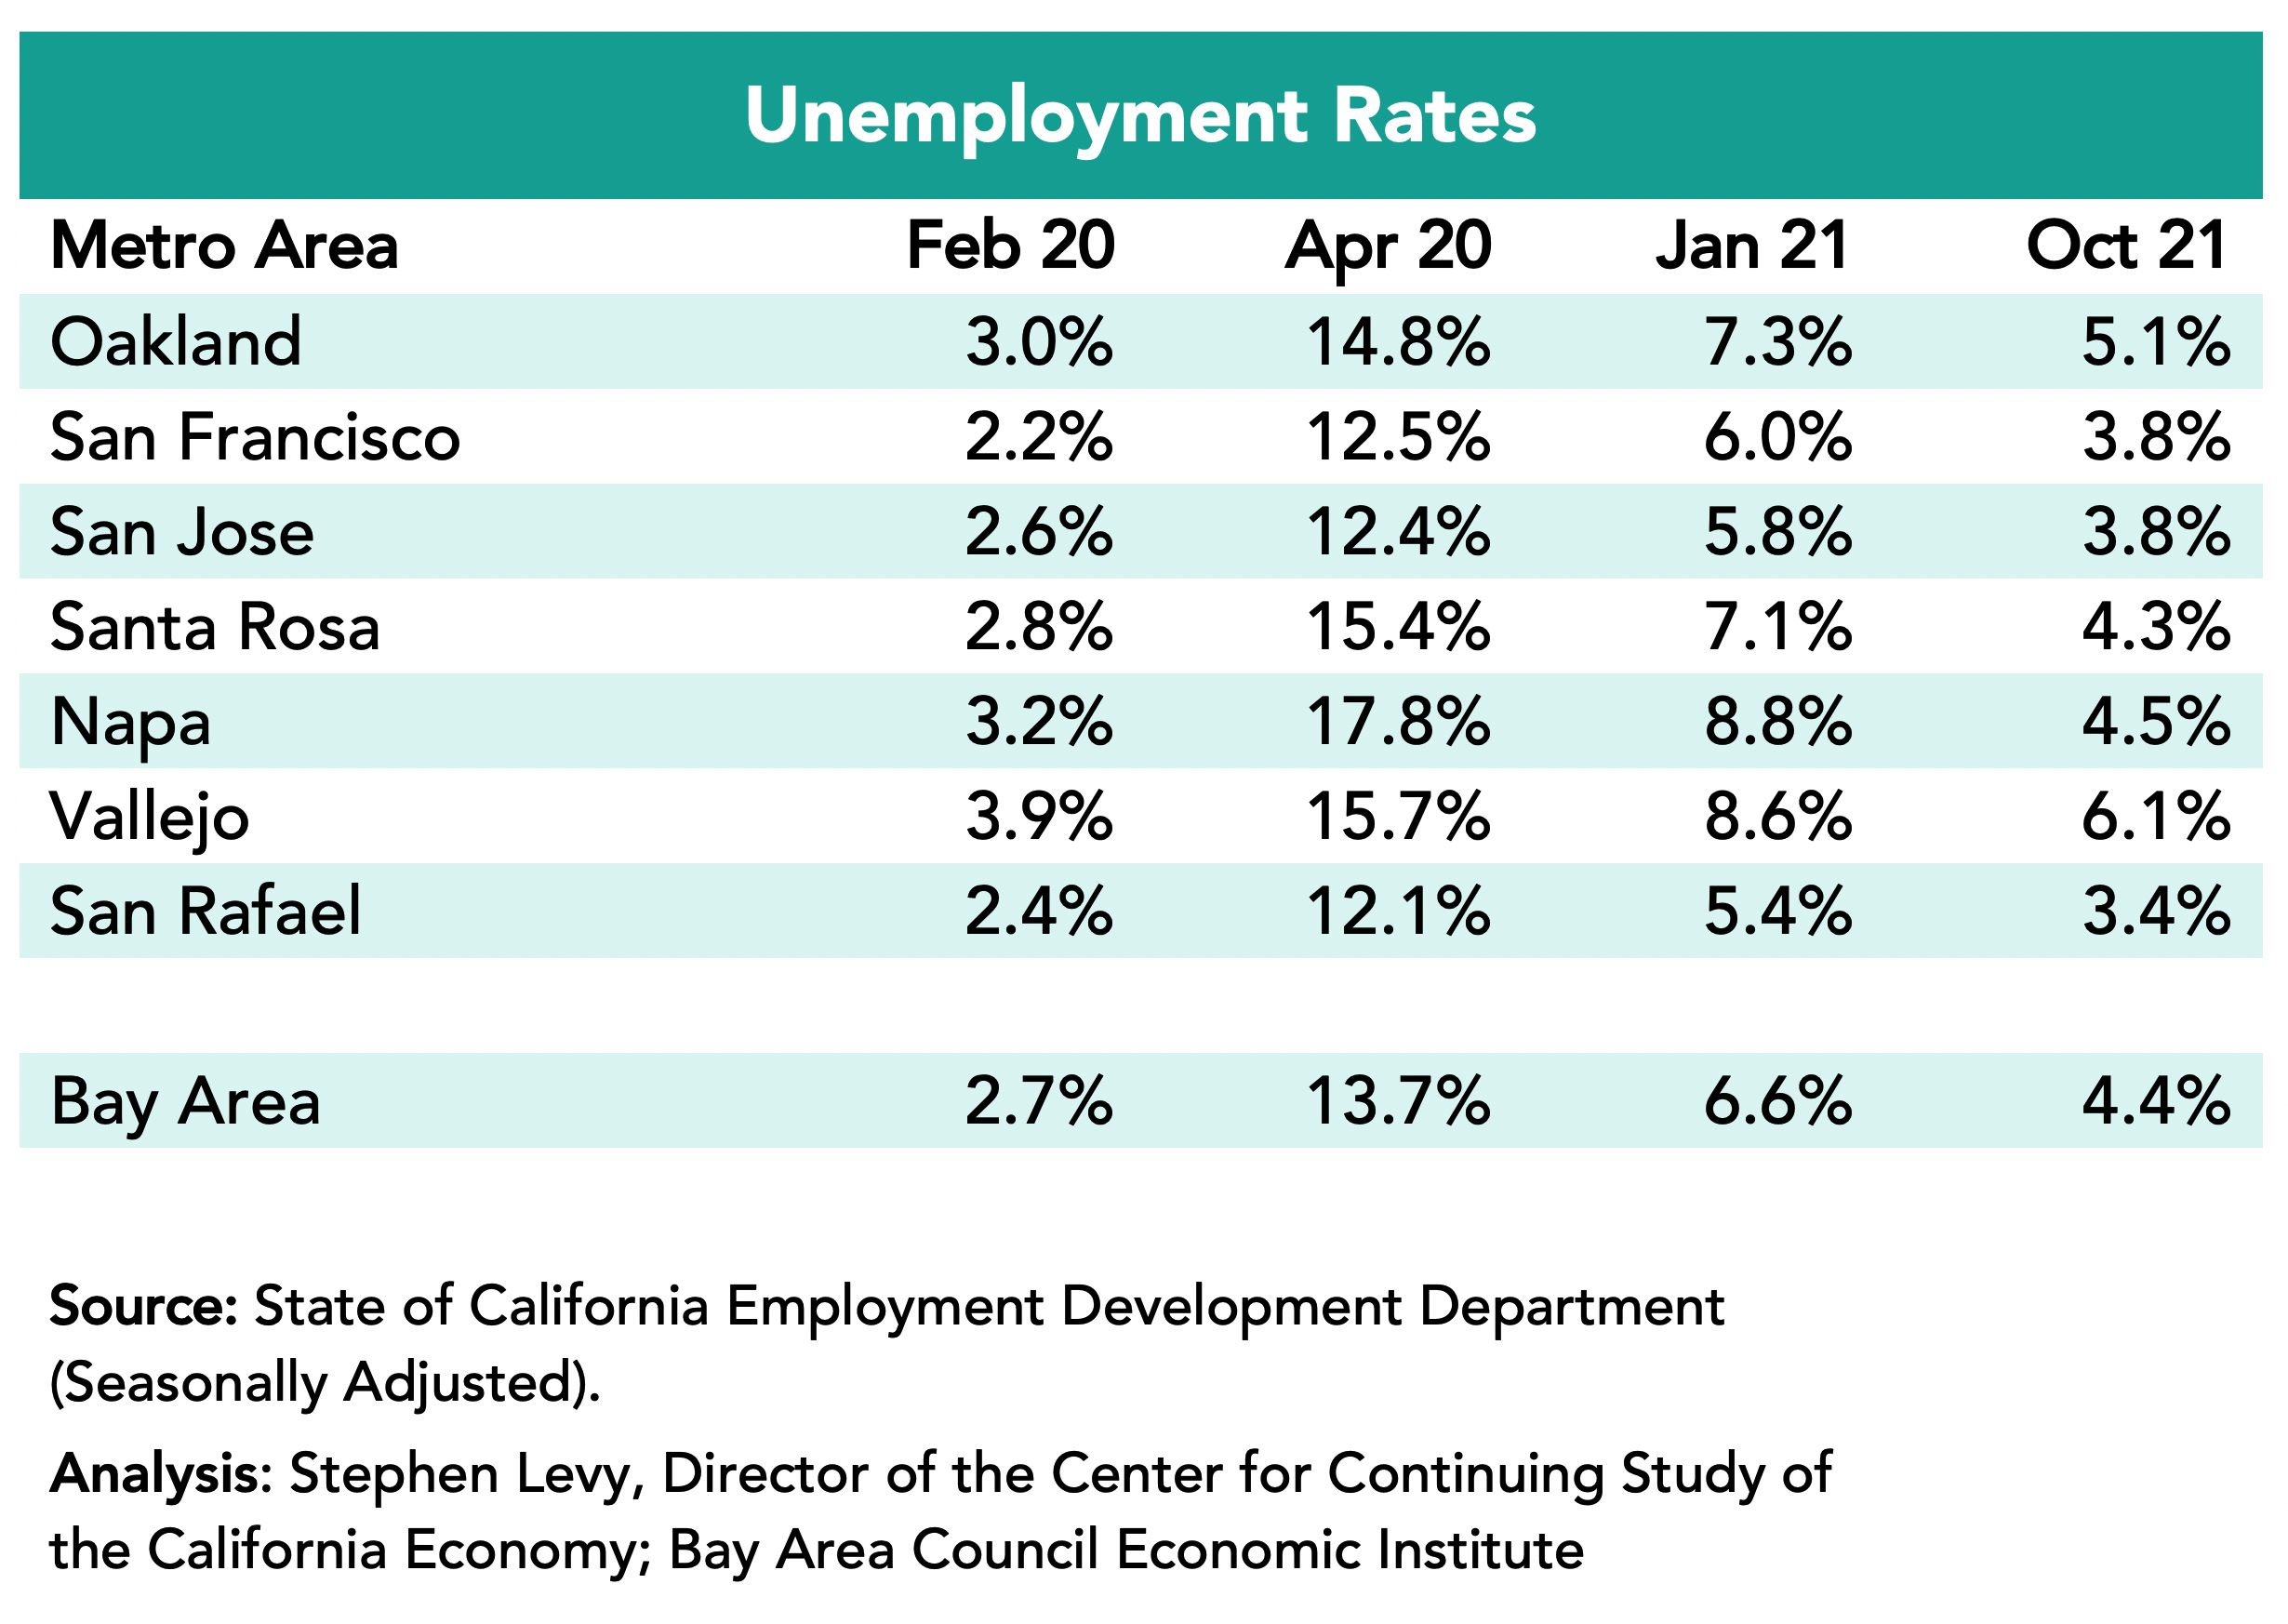
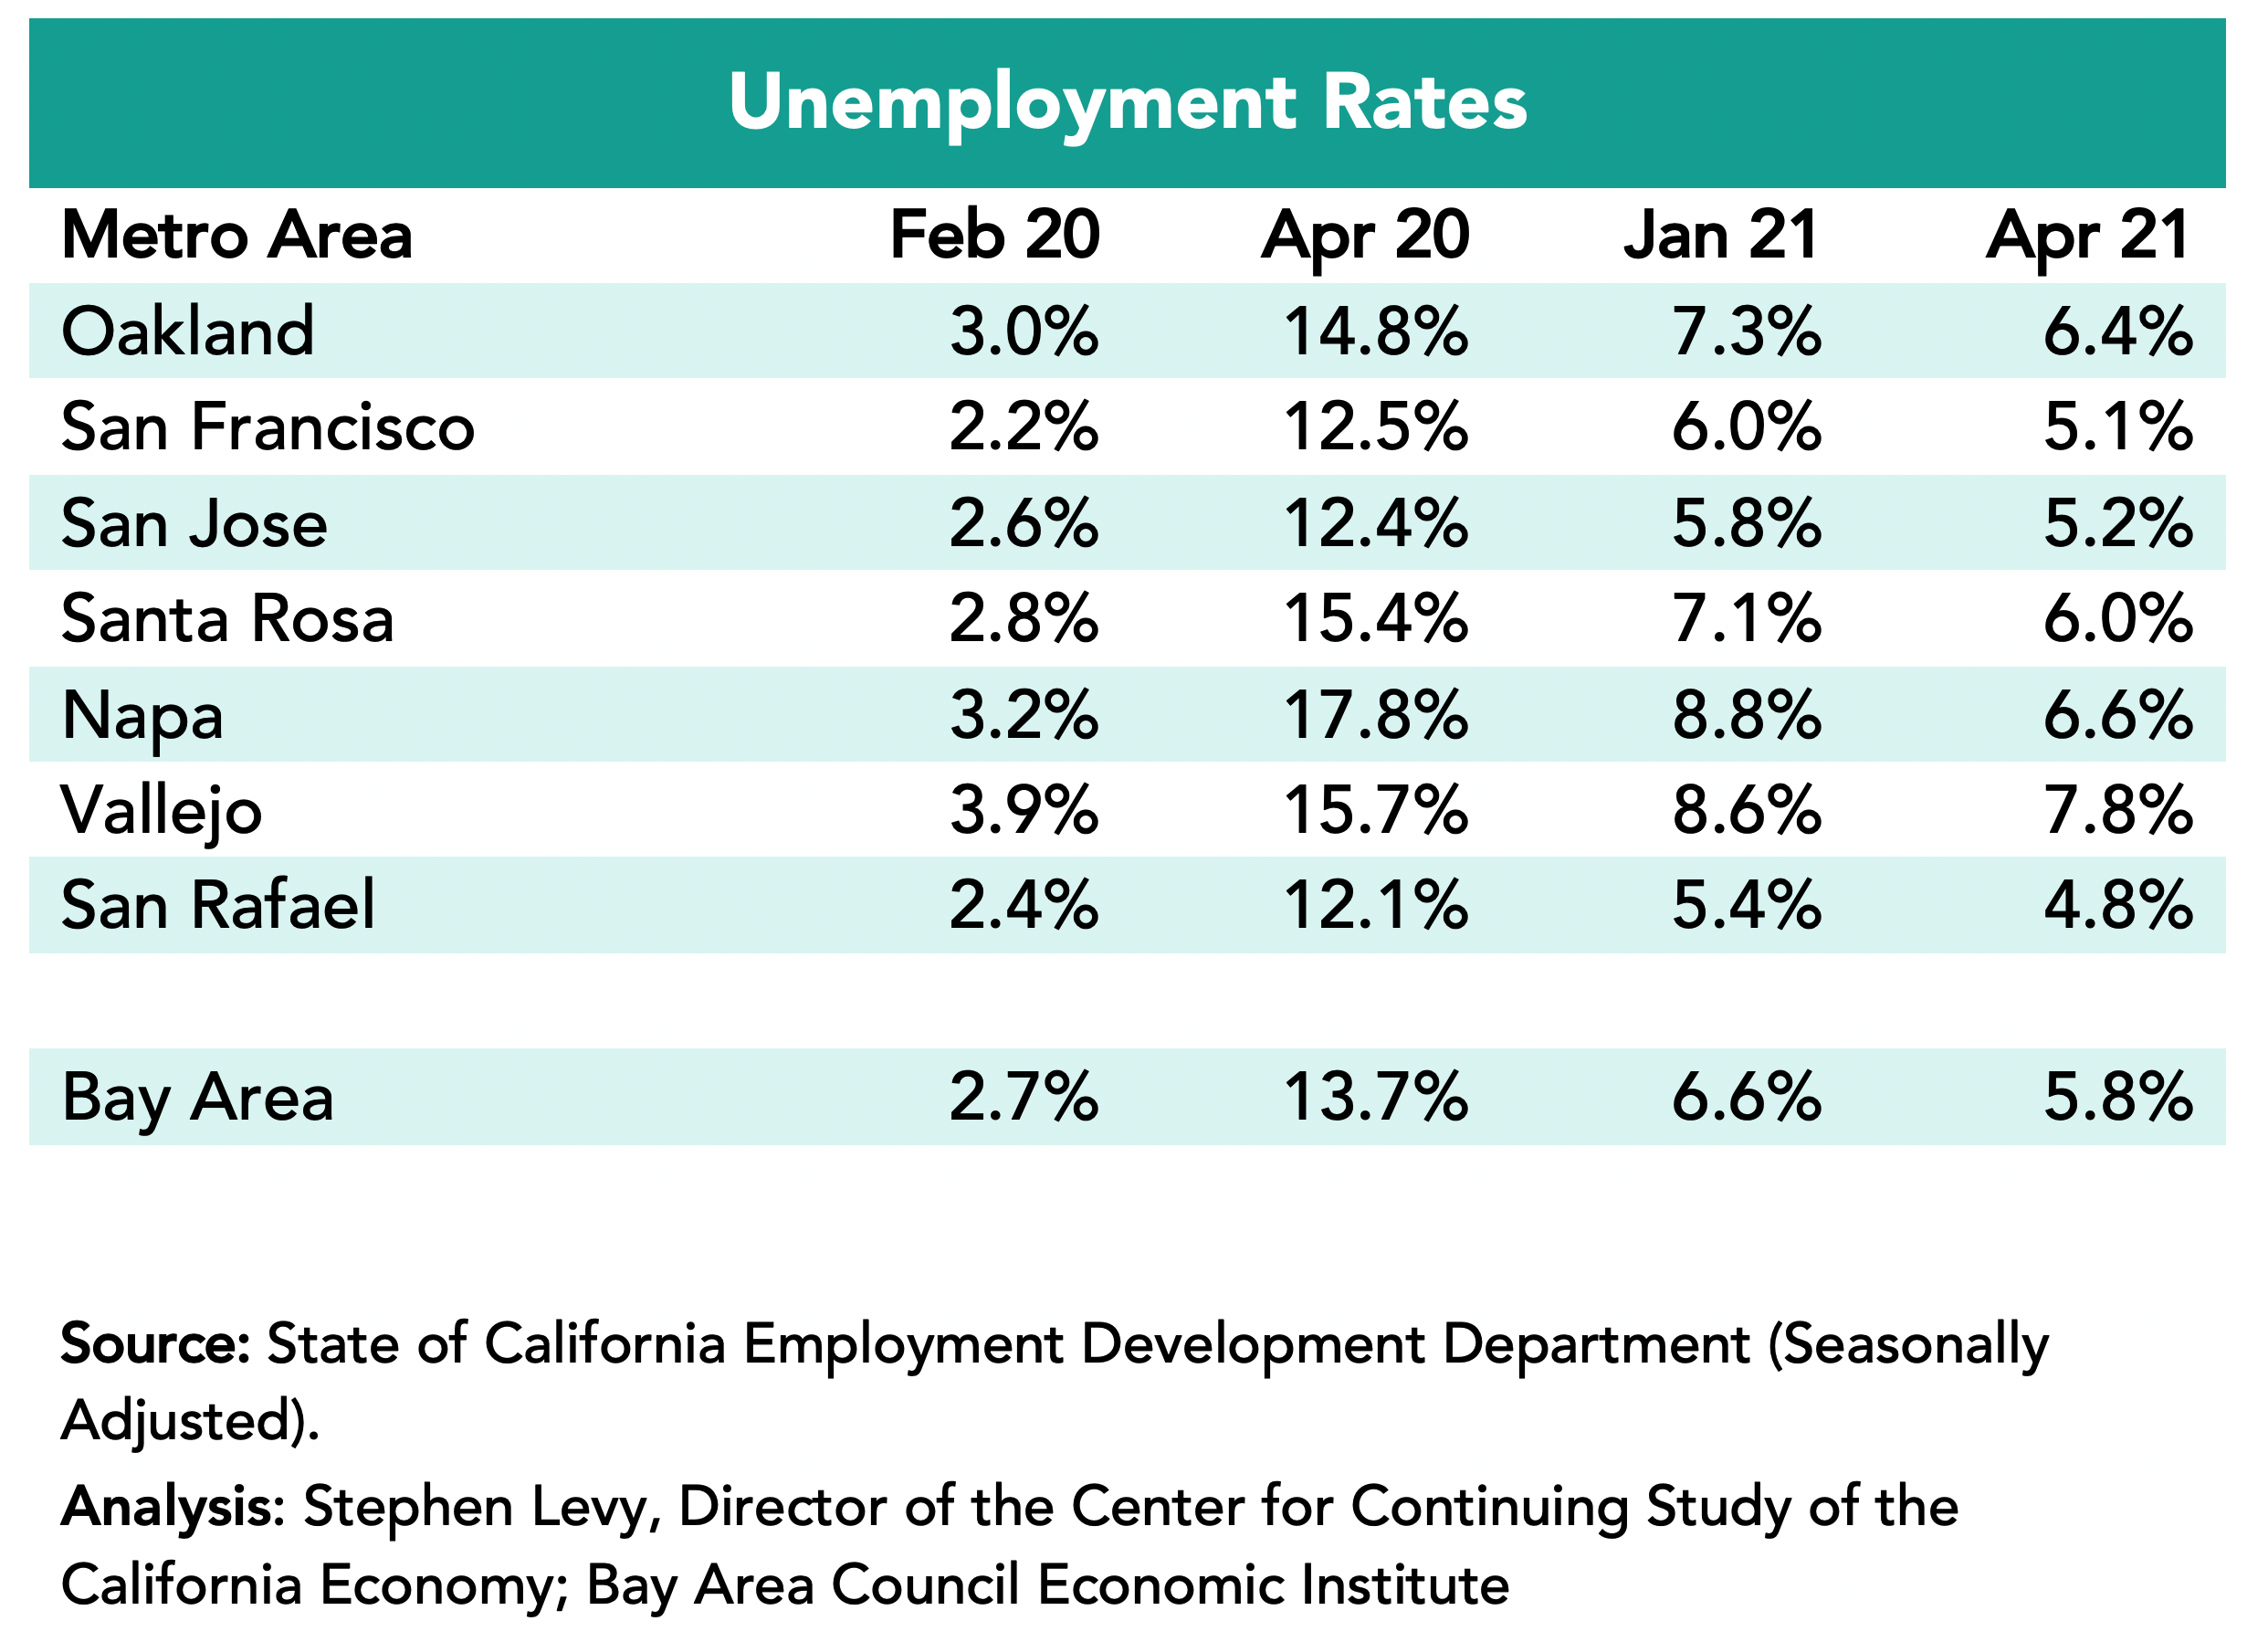
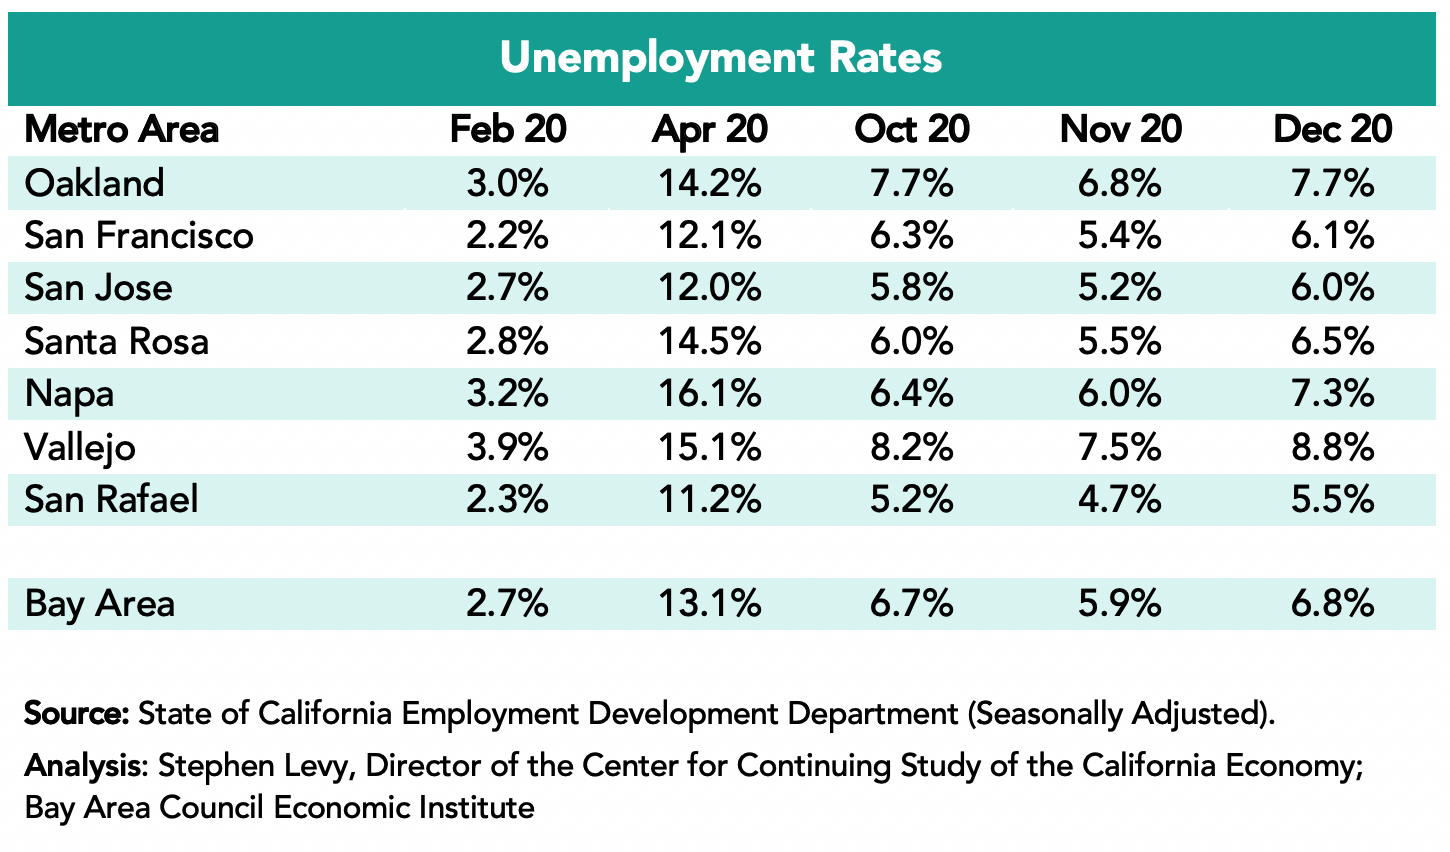
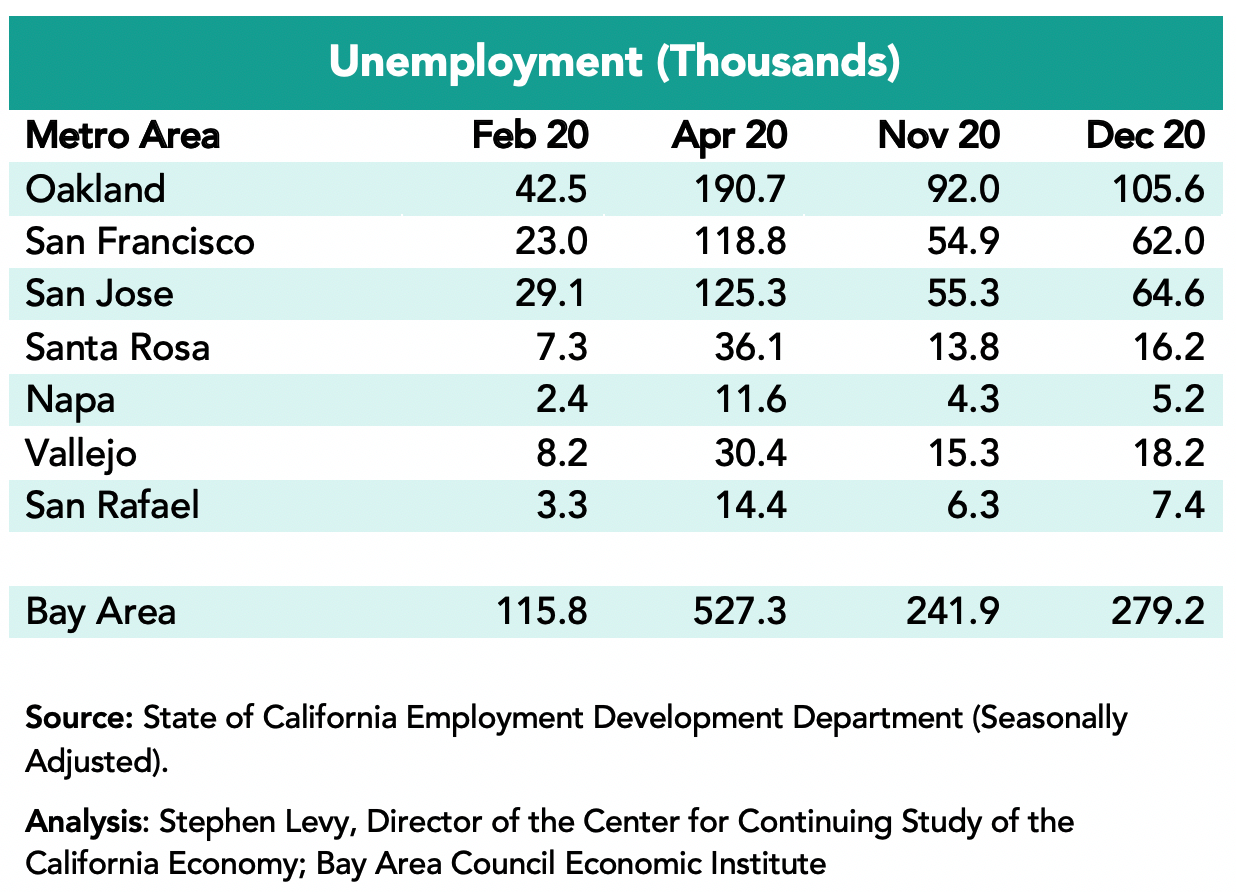
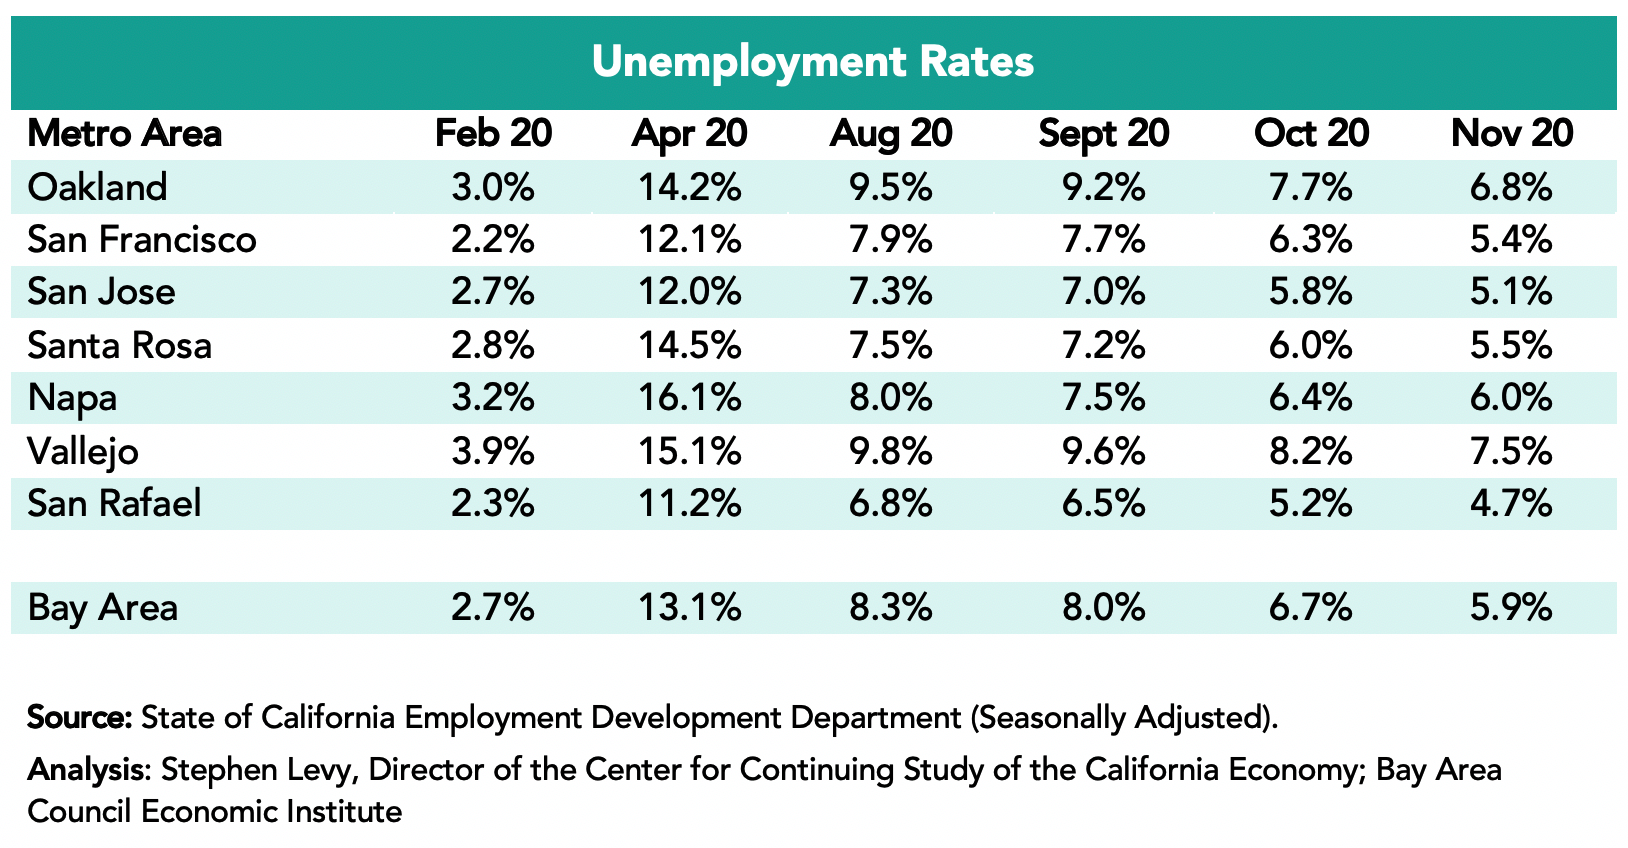
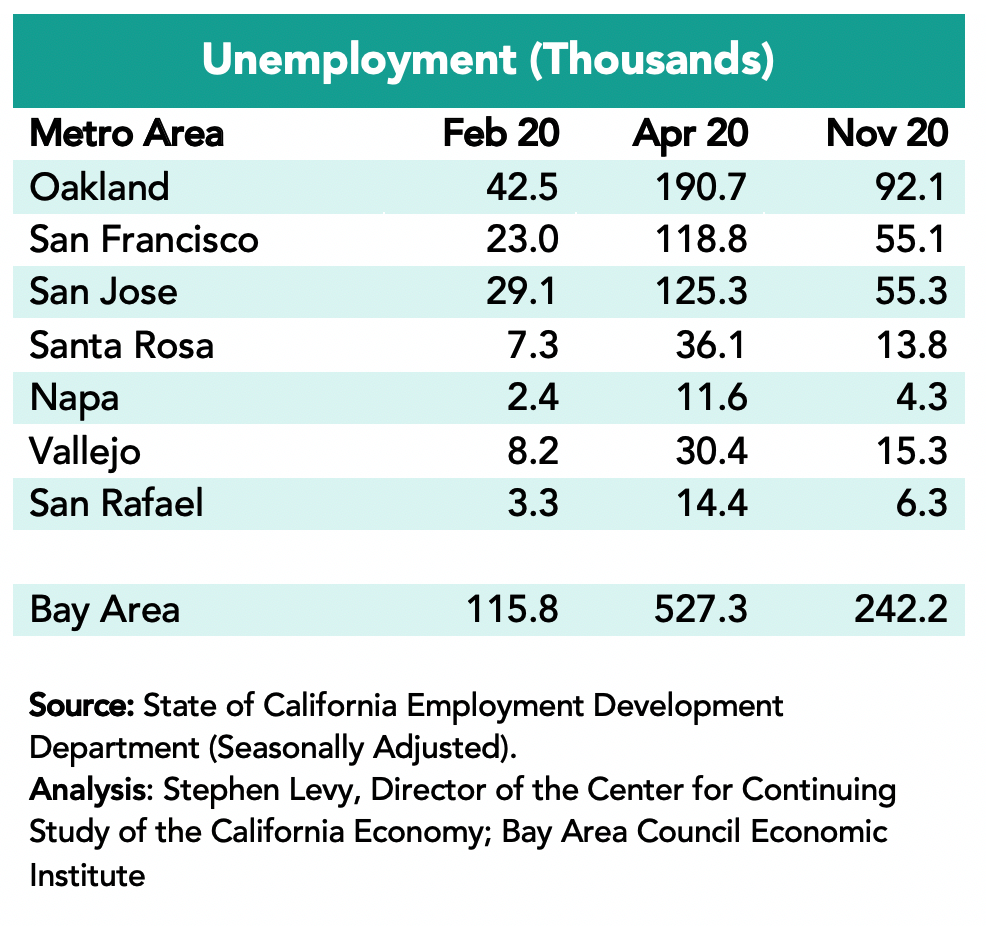
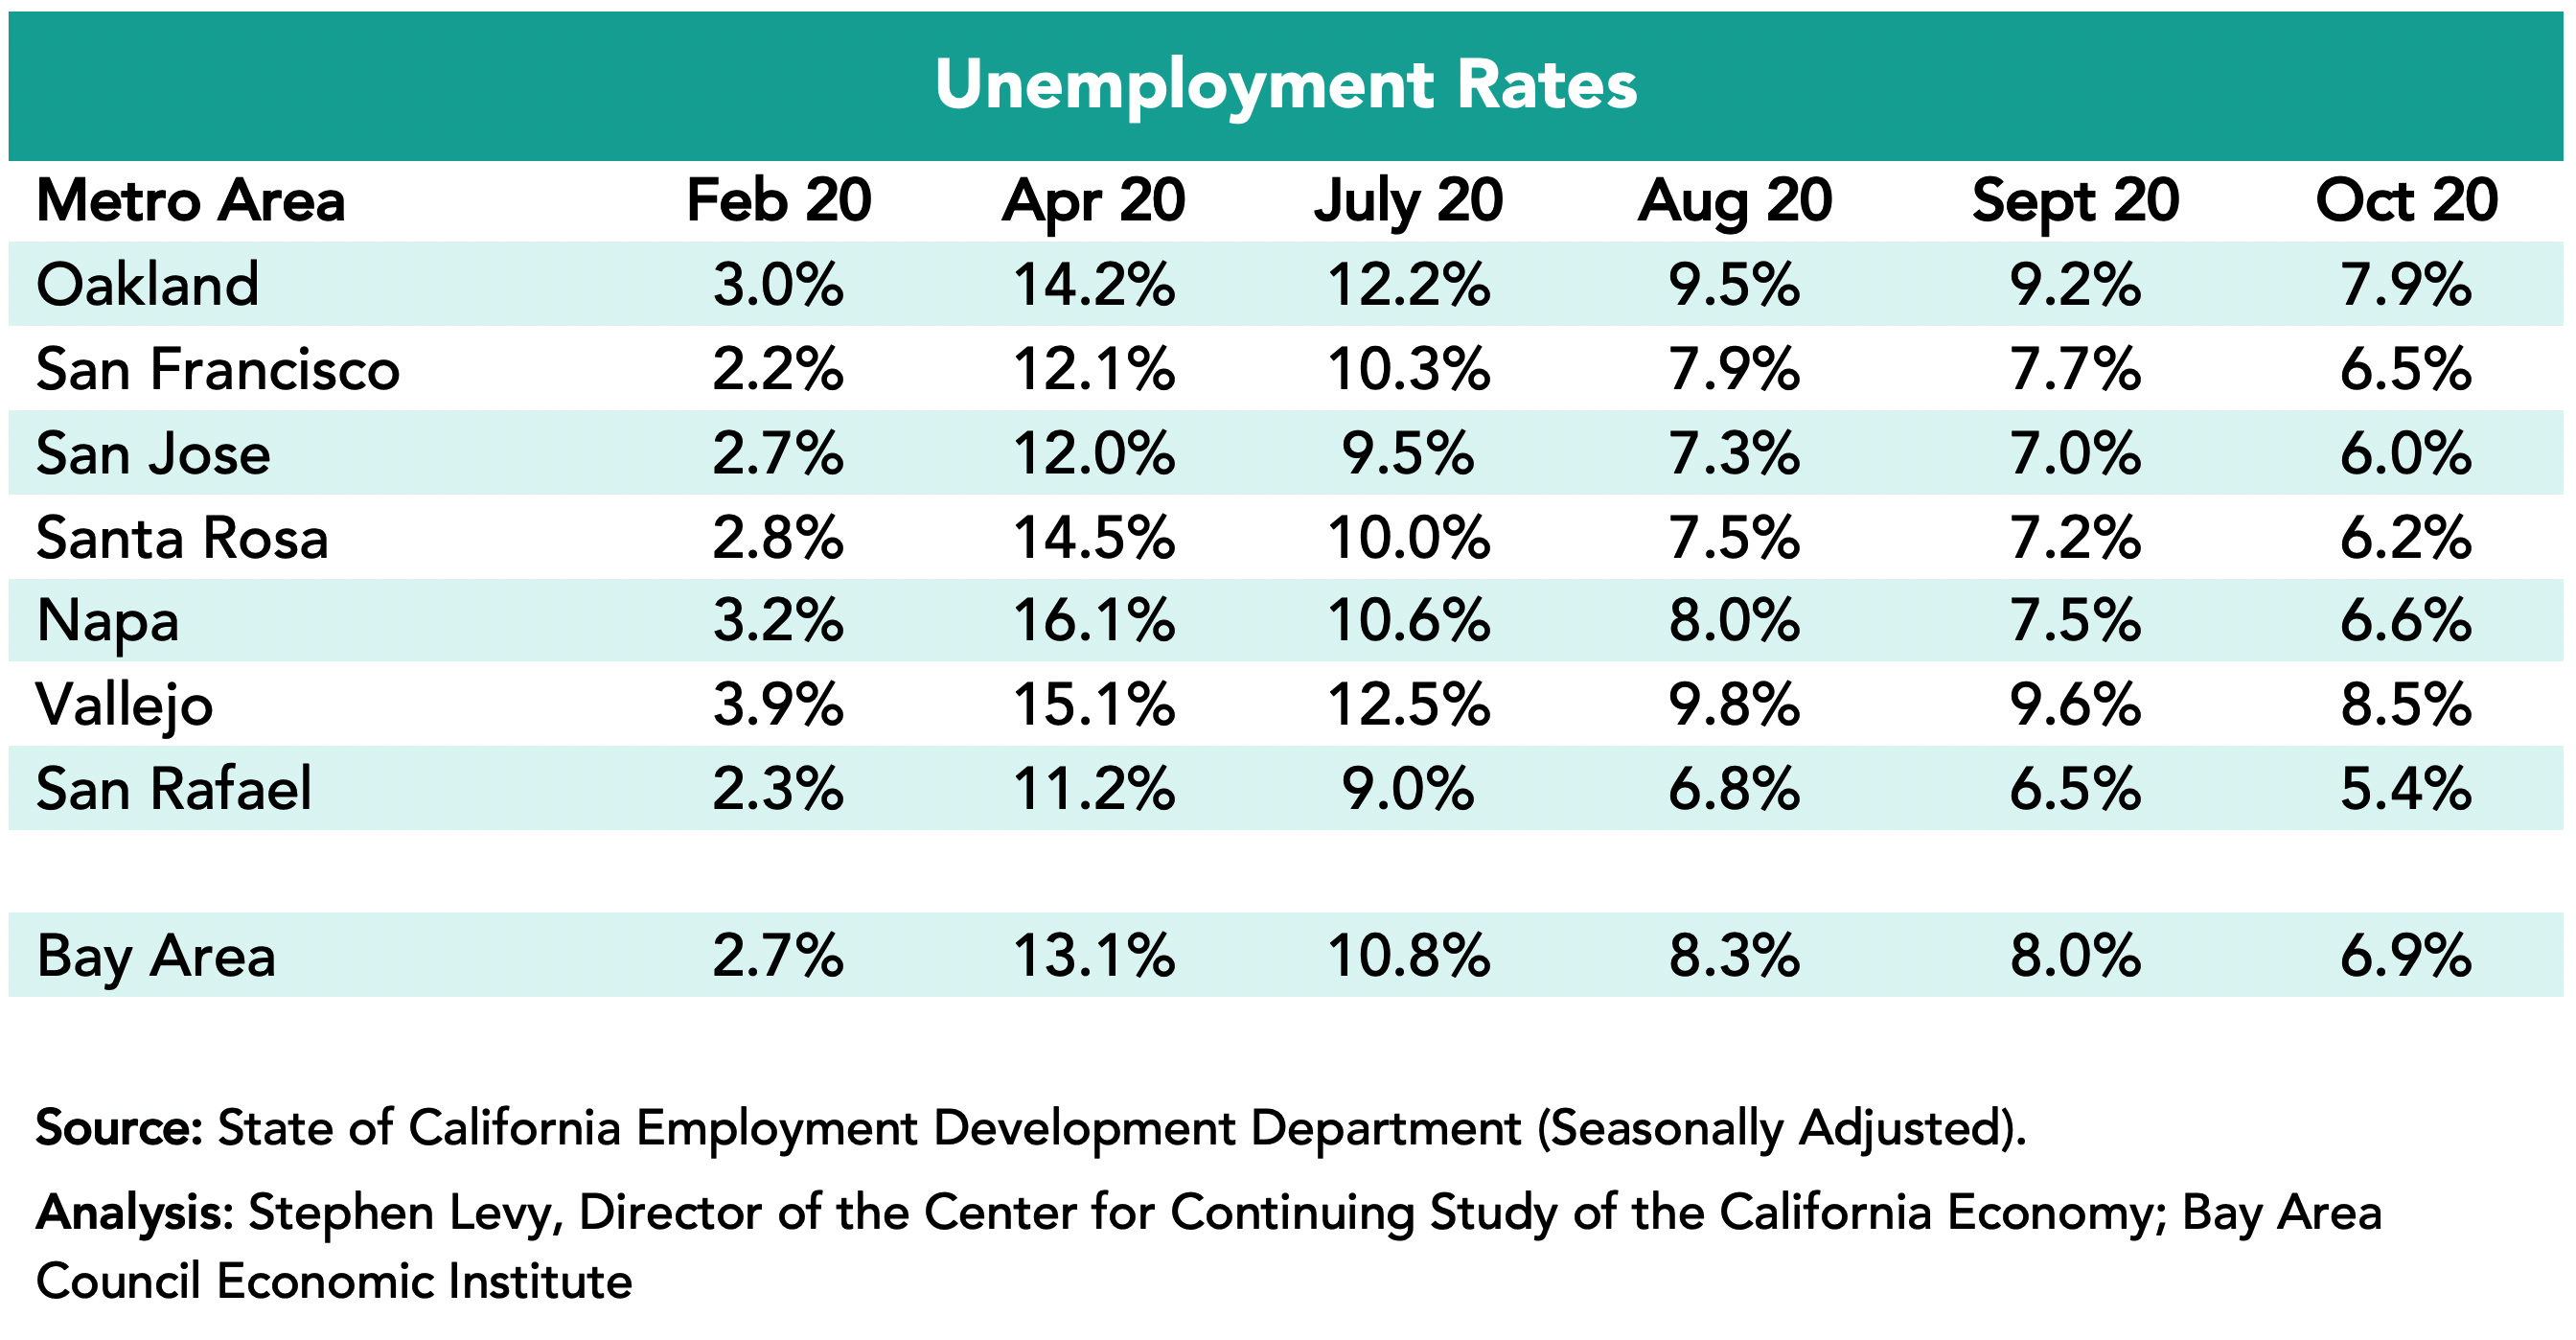
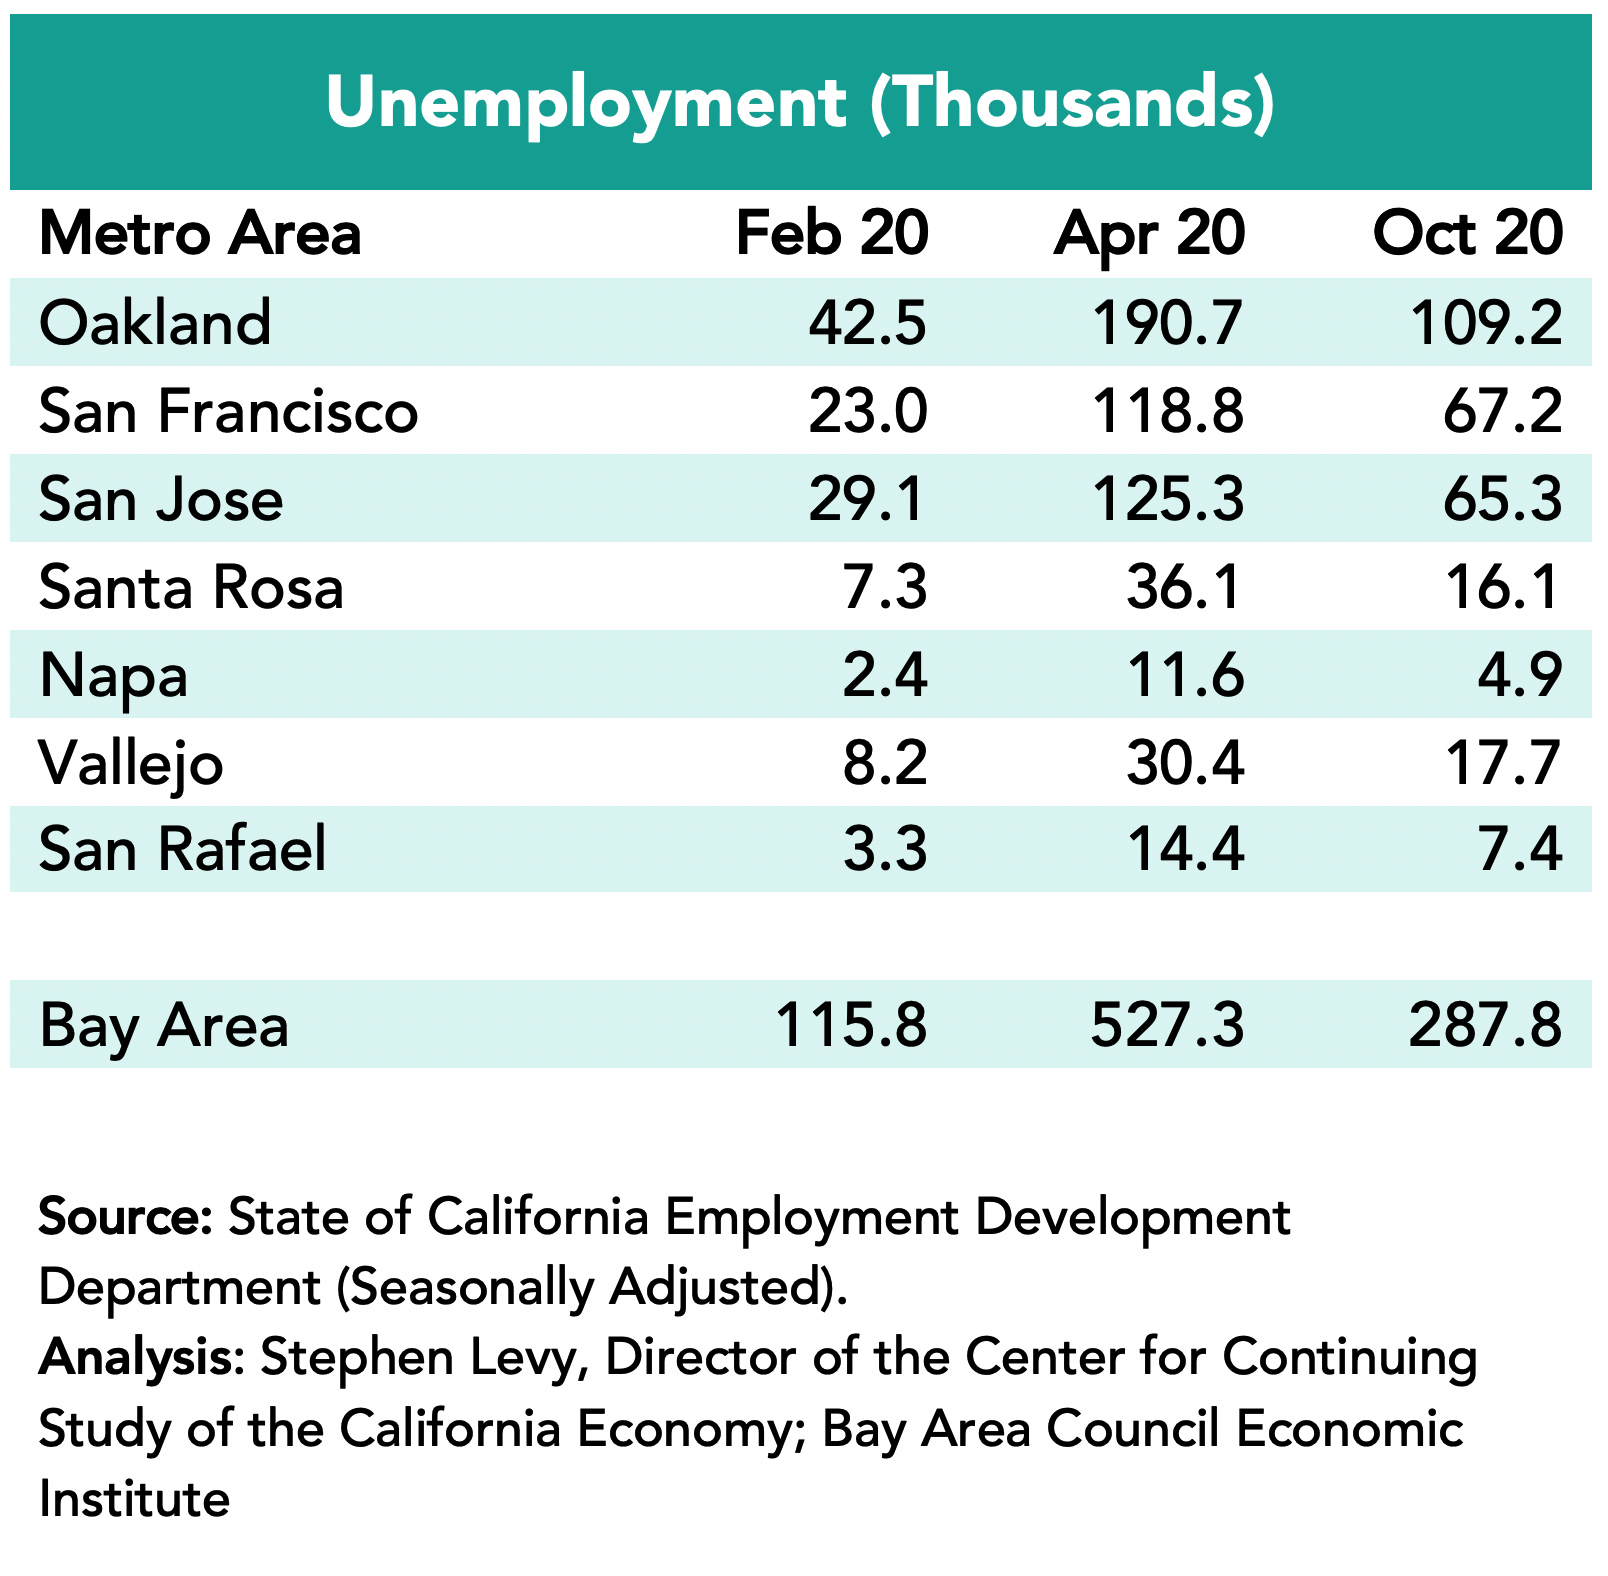
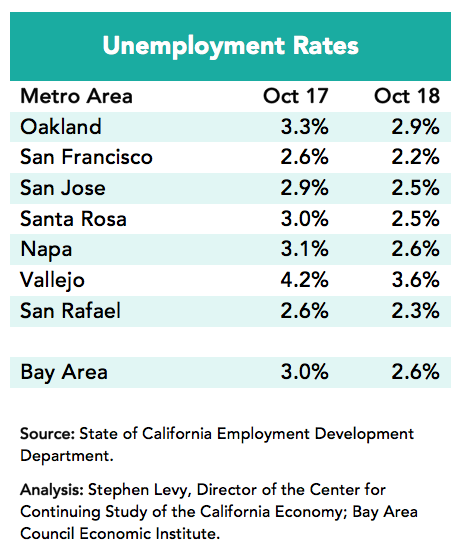
Unemployment rates ticked up in November in all metro areas but remain low by historical standards. The November 2022 rate of 2.8% for the region is just above the February 2020 pre-pandemic rate of 2.7%. And the number of unemployed residents grew in November in all metro areas reaching 115,100 up 8,000 since October.
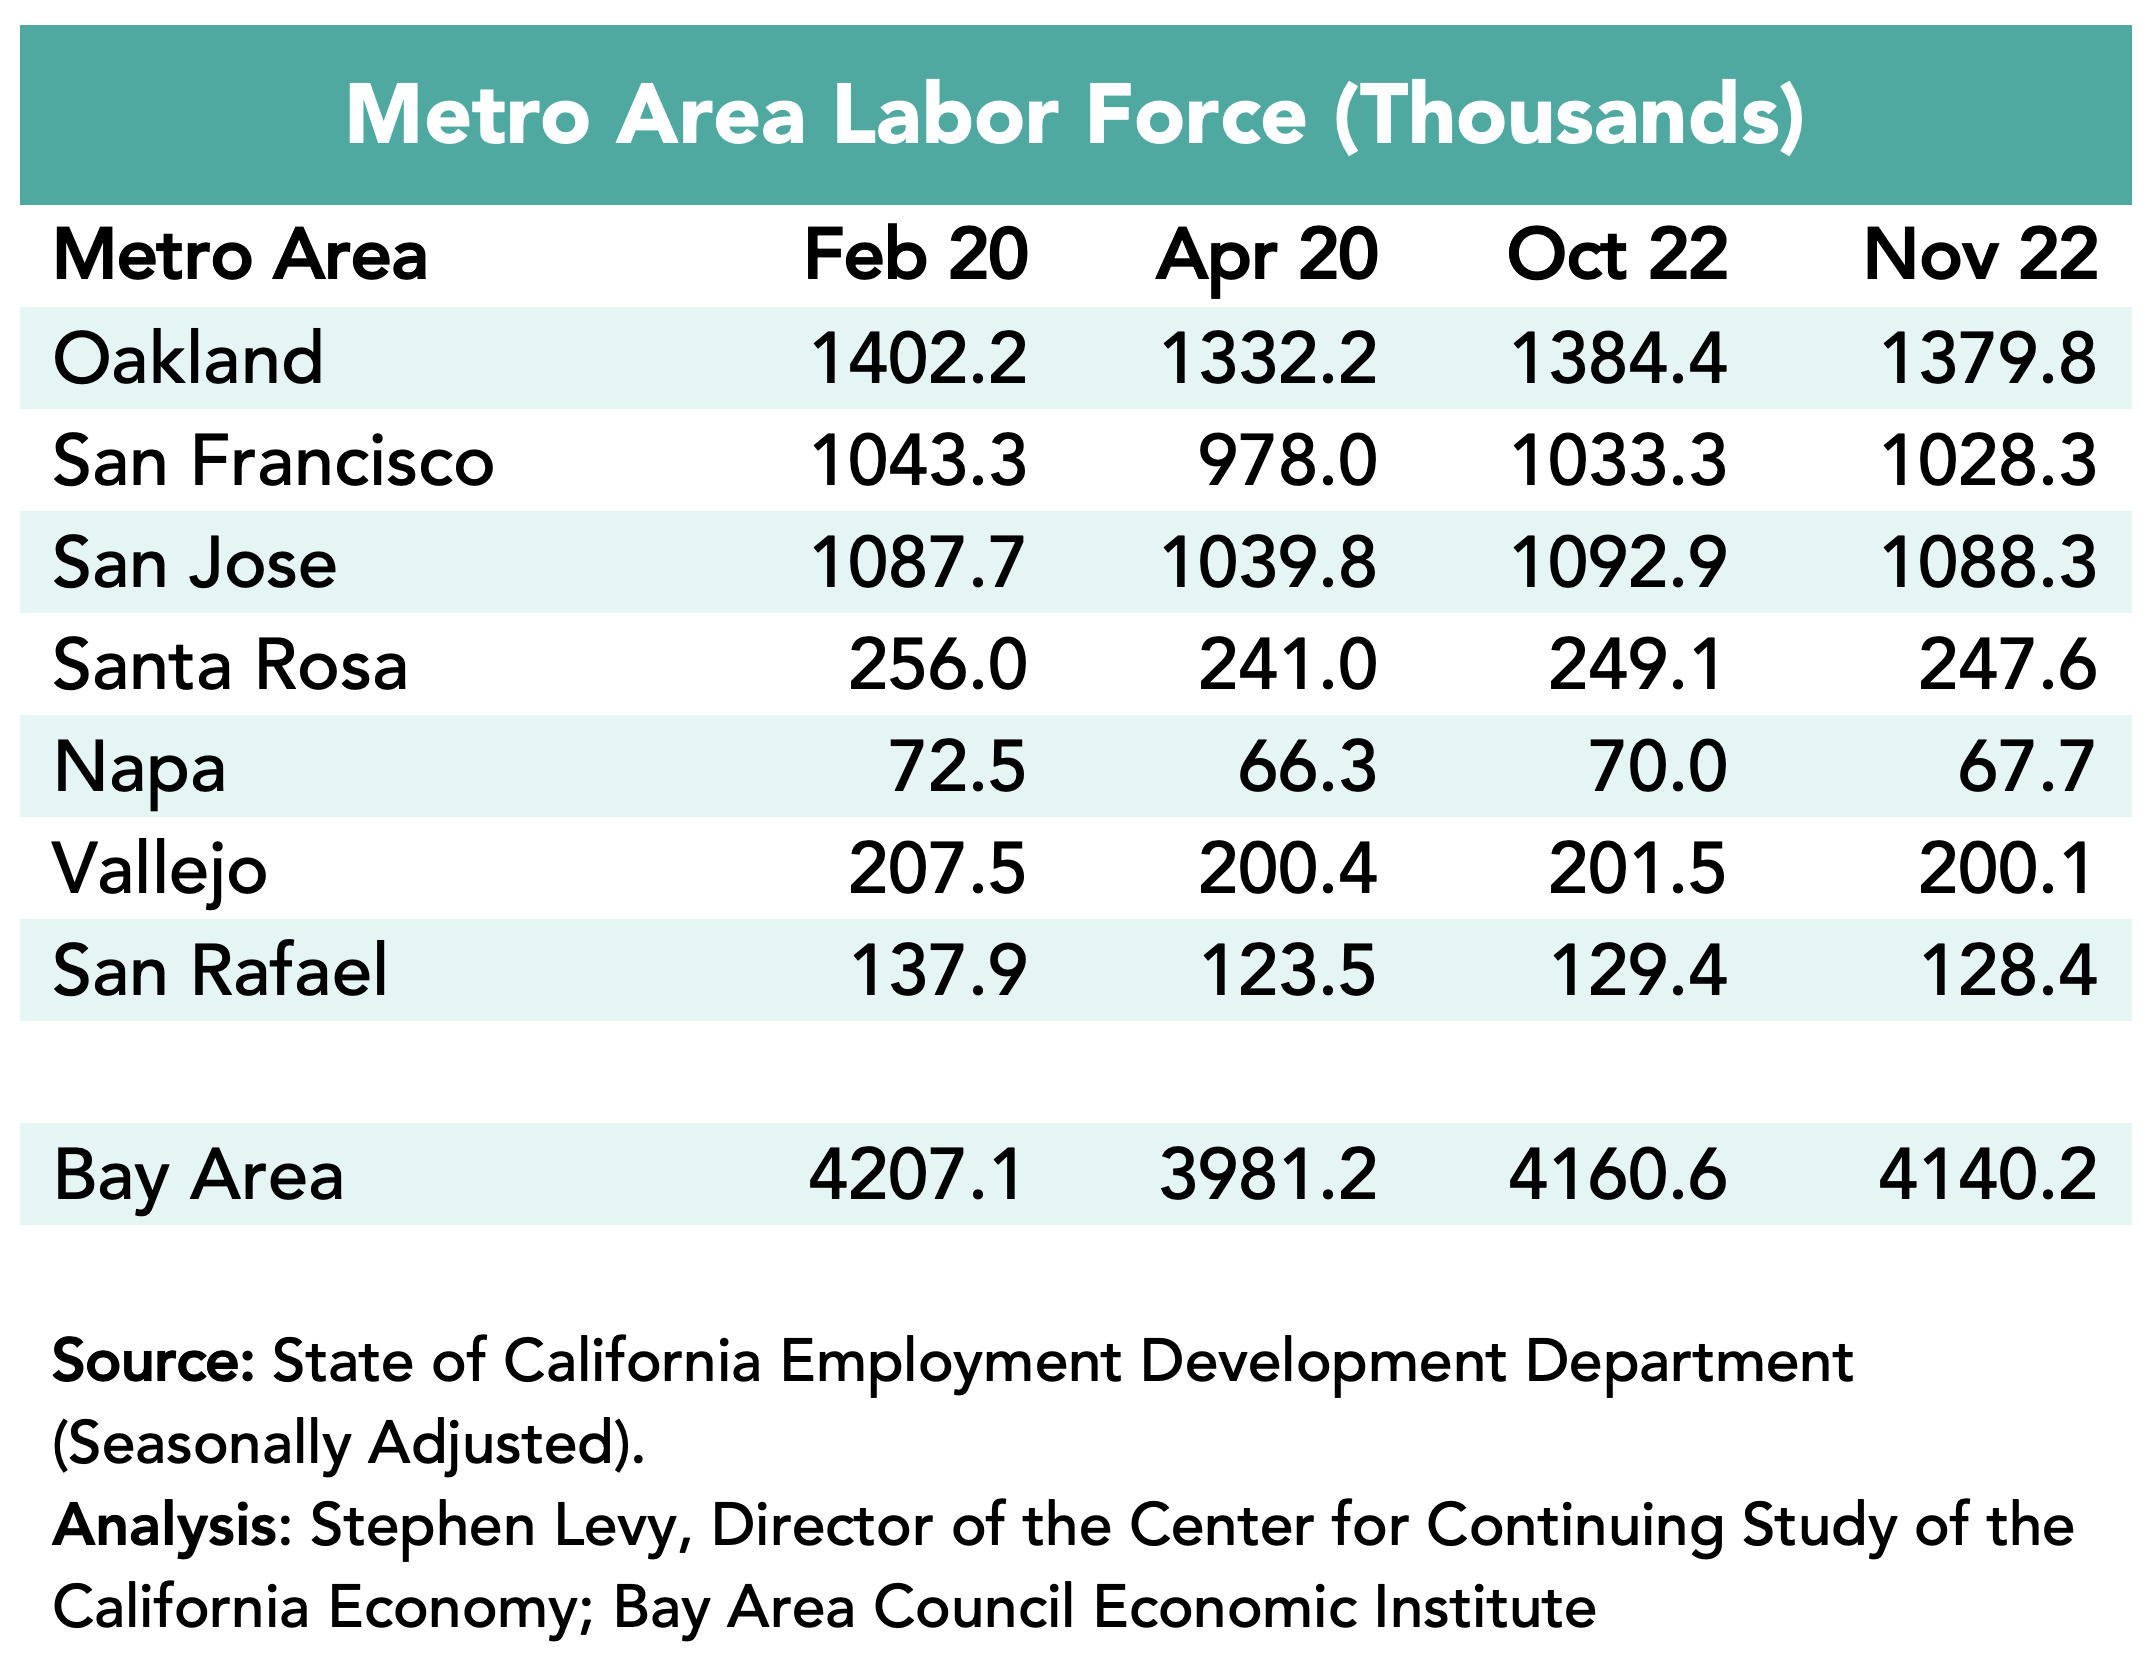
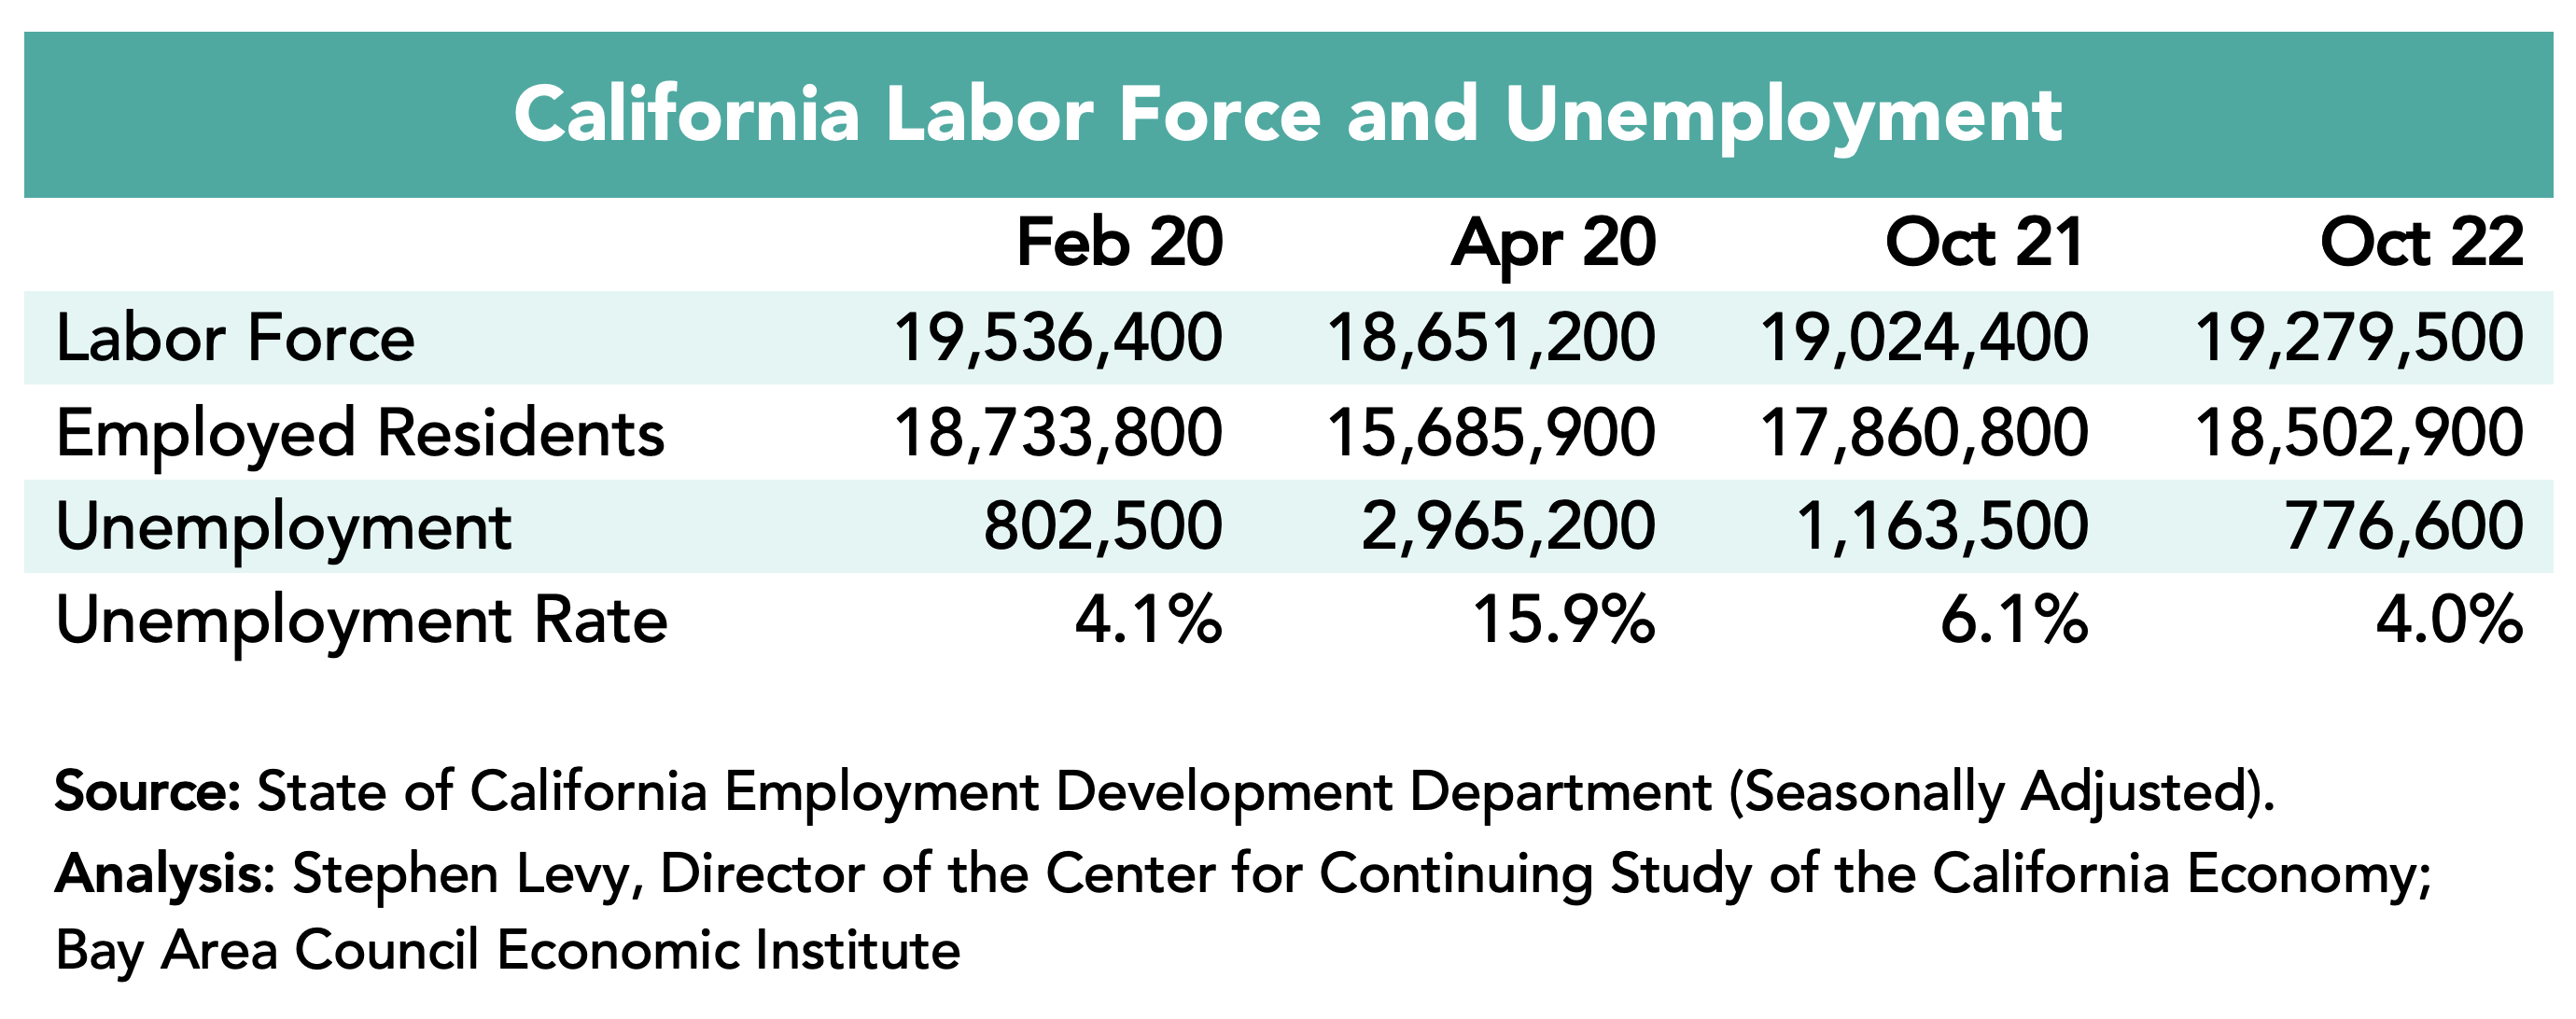
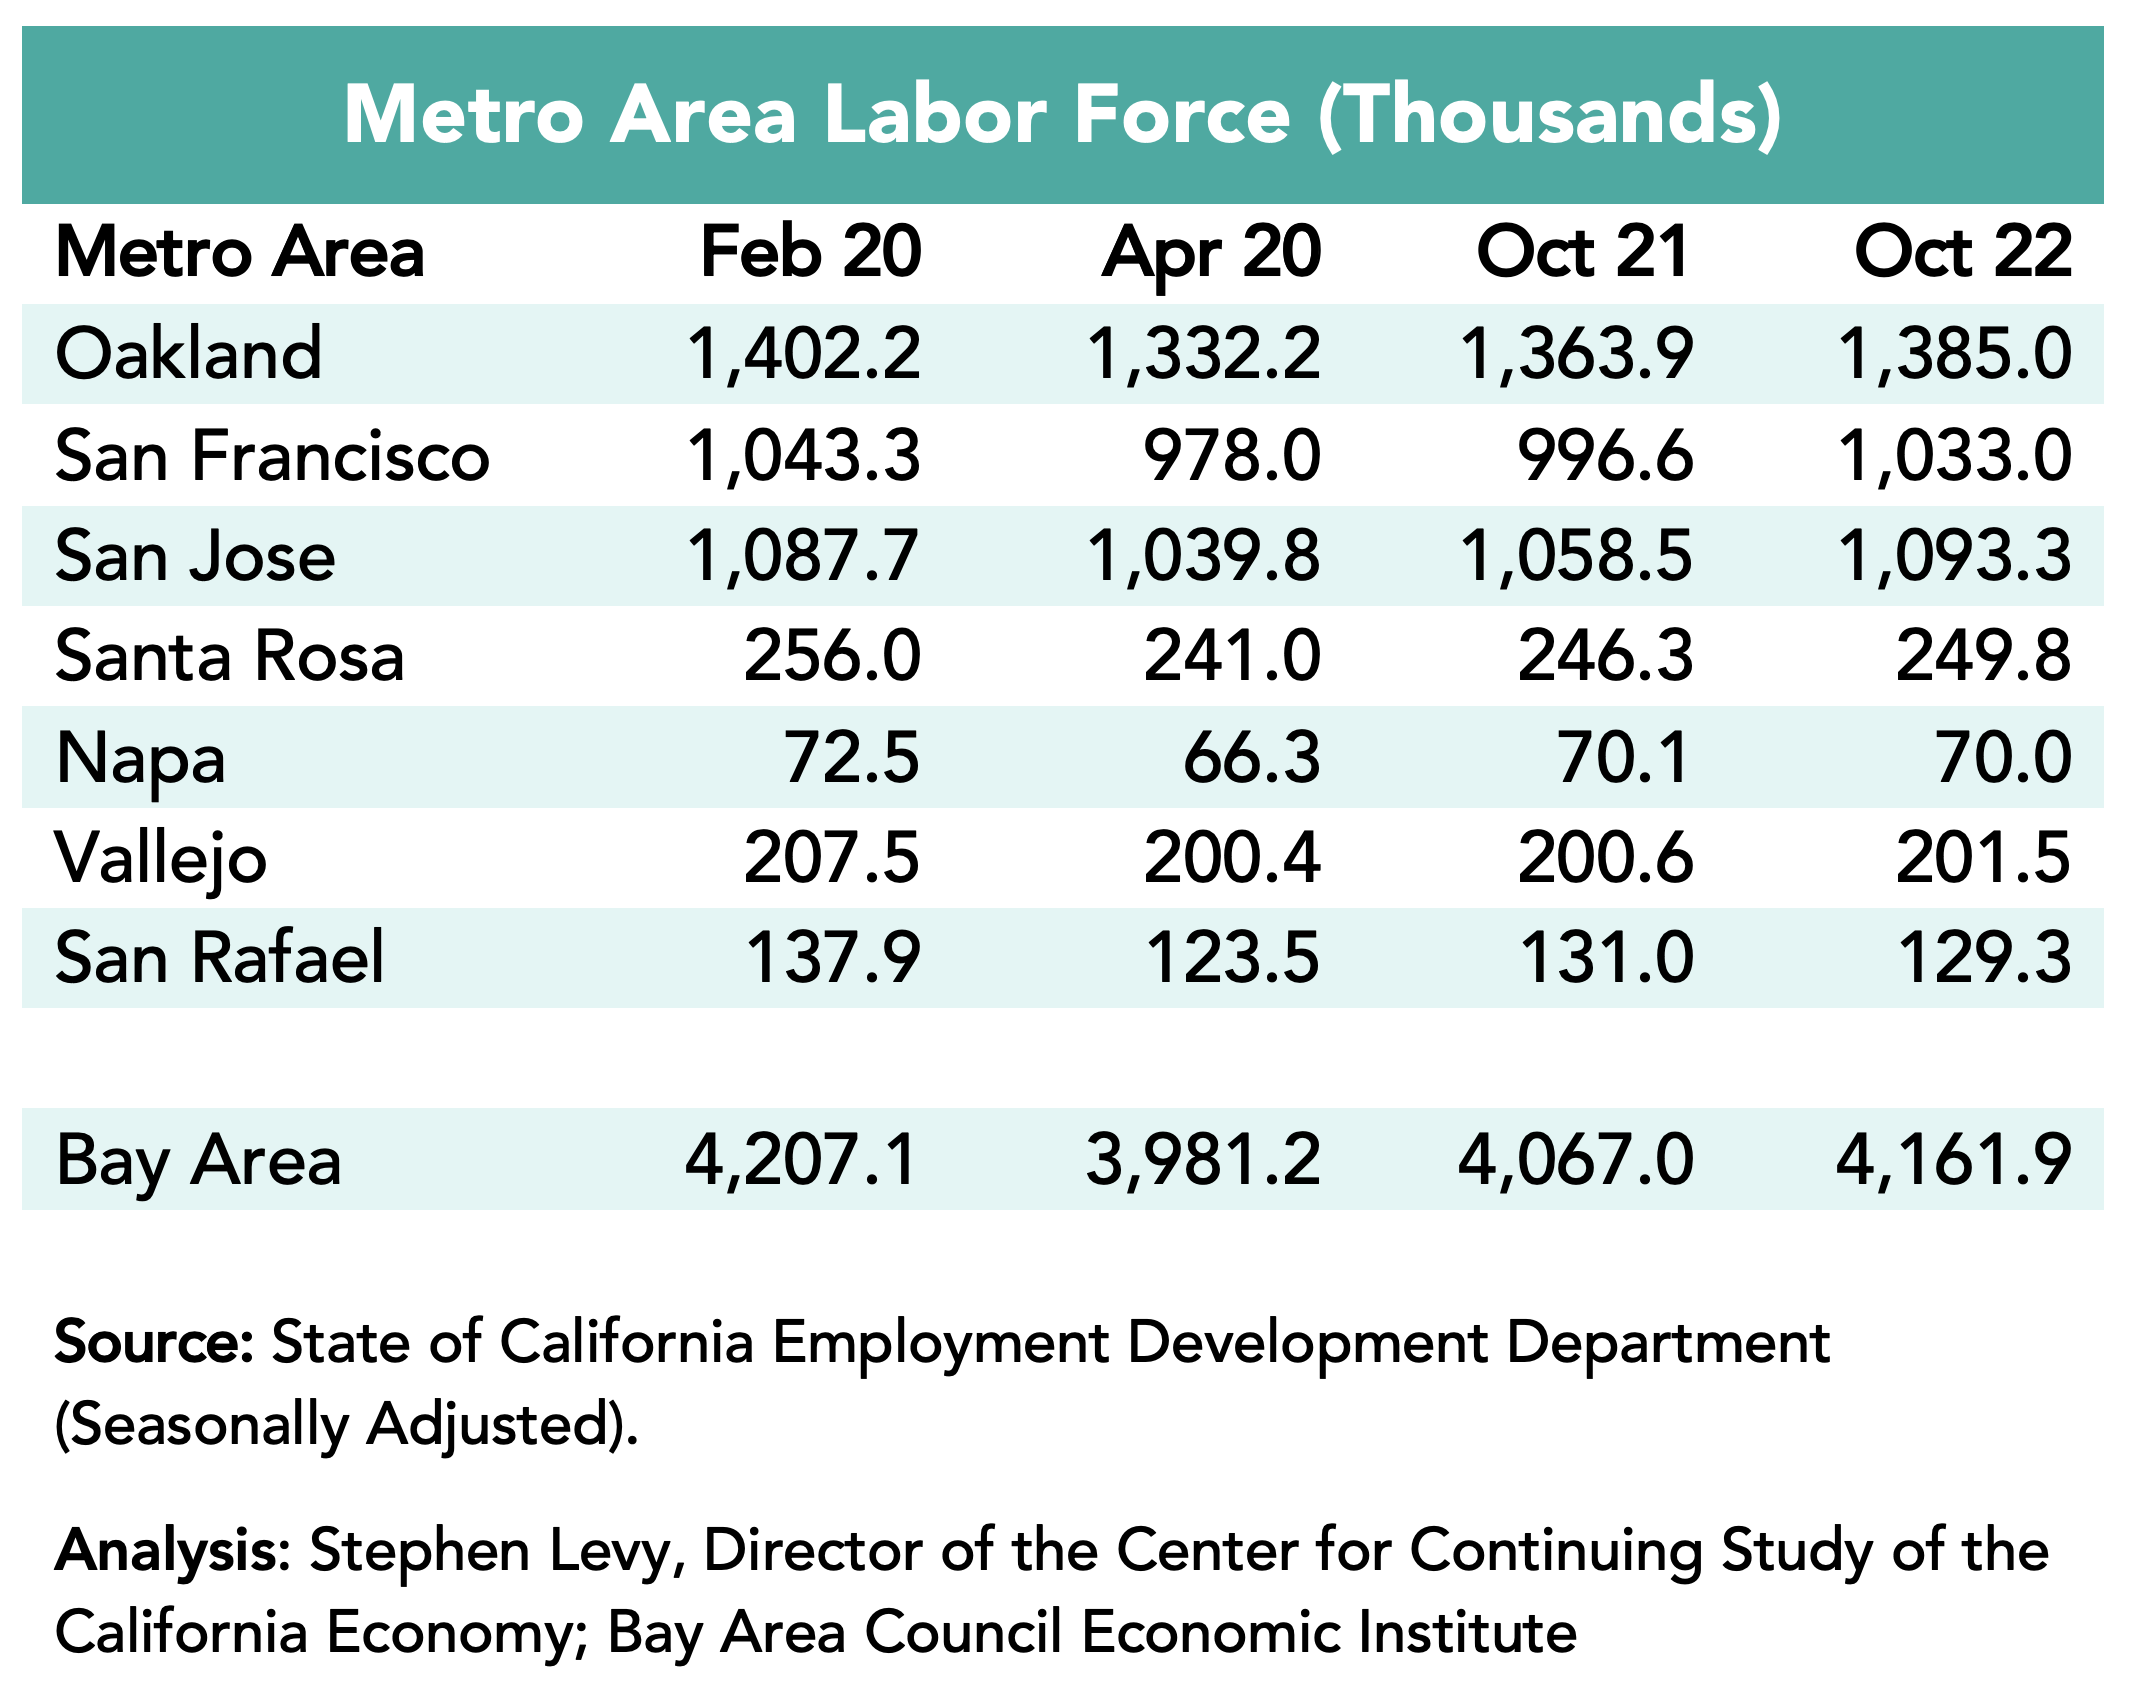
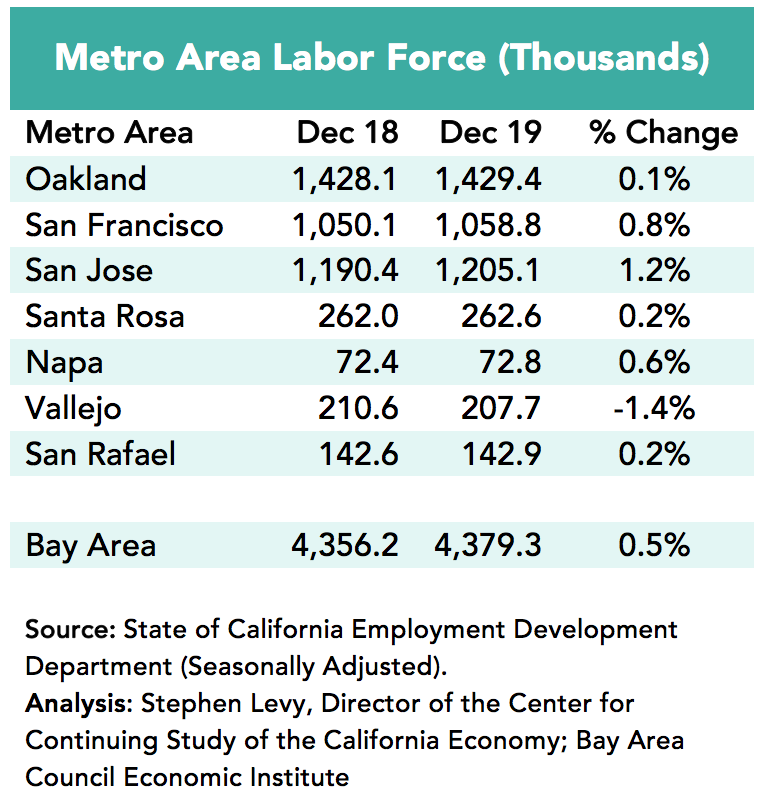
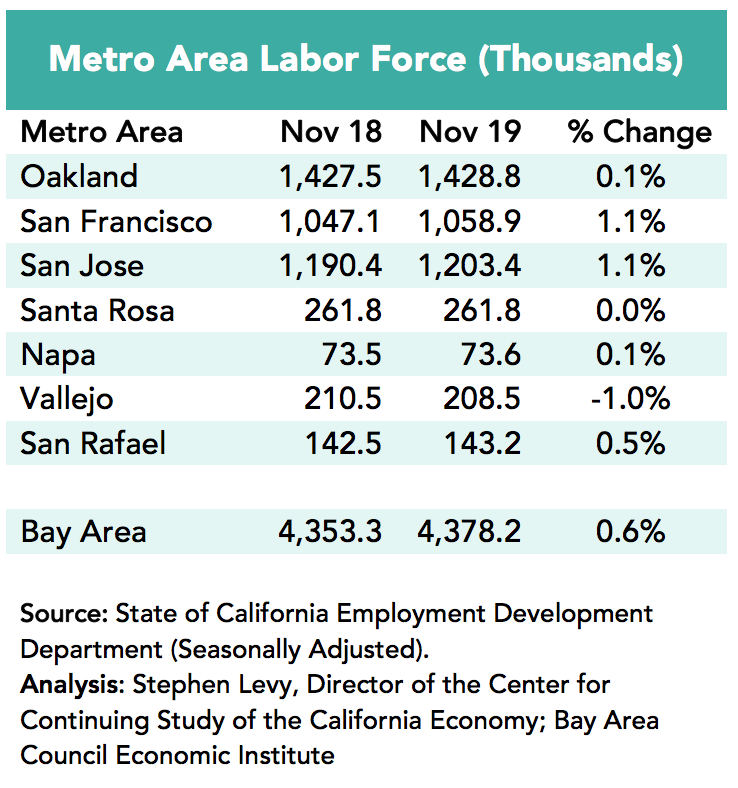
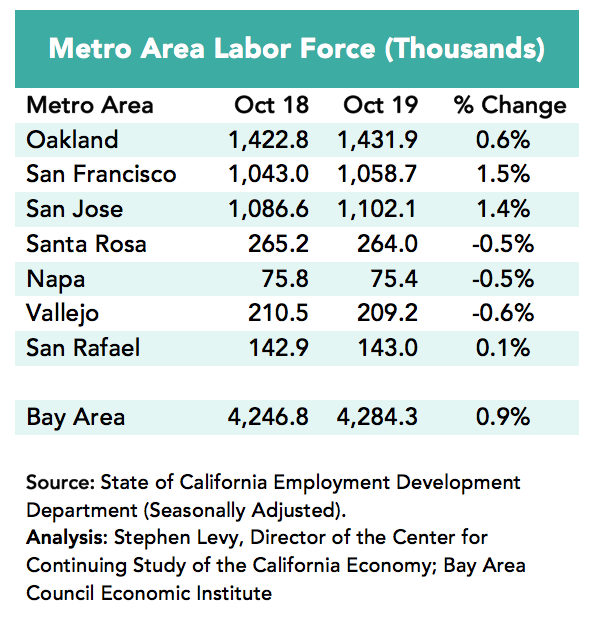
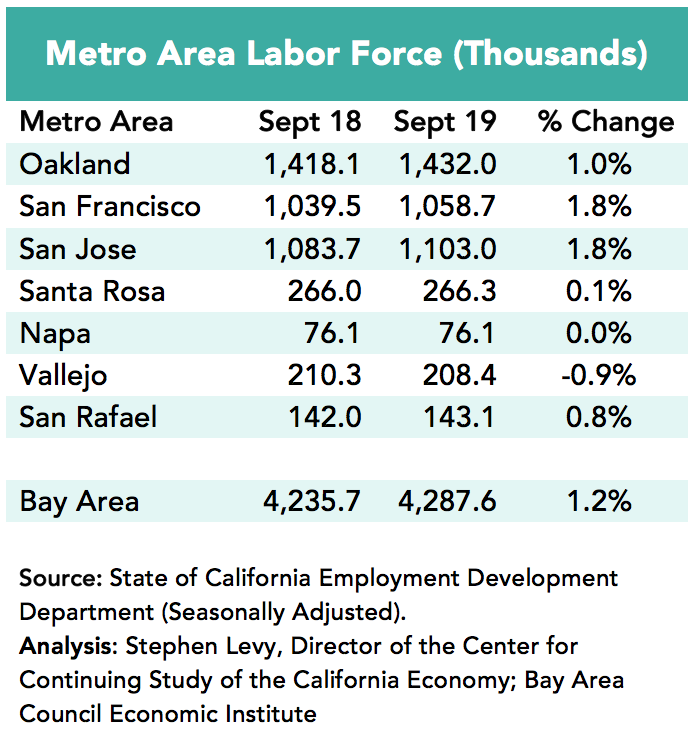
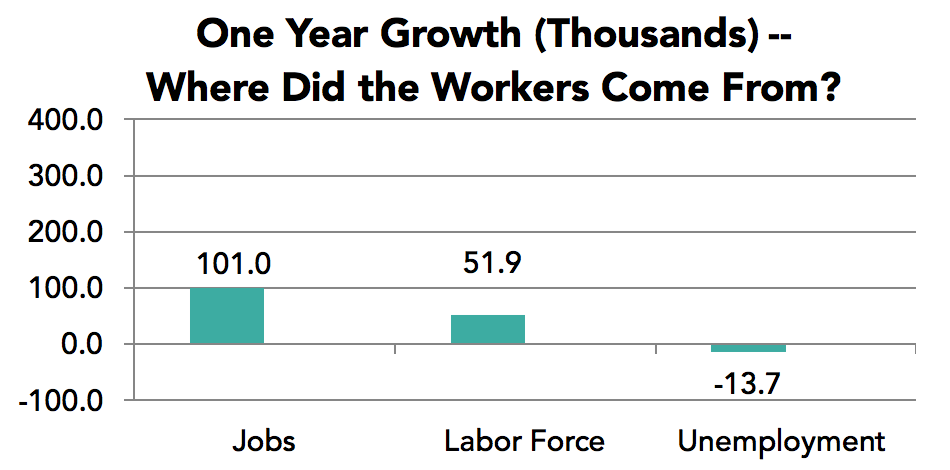
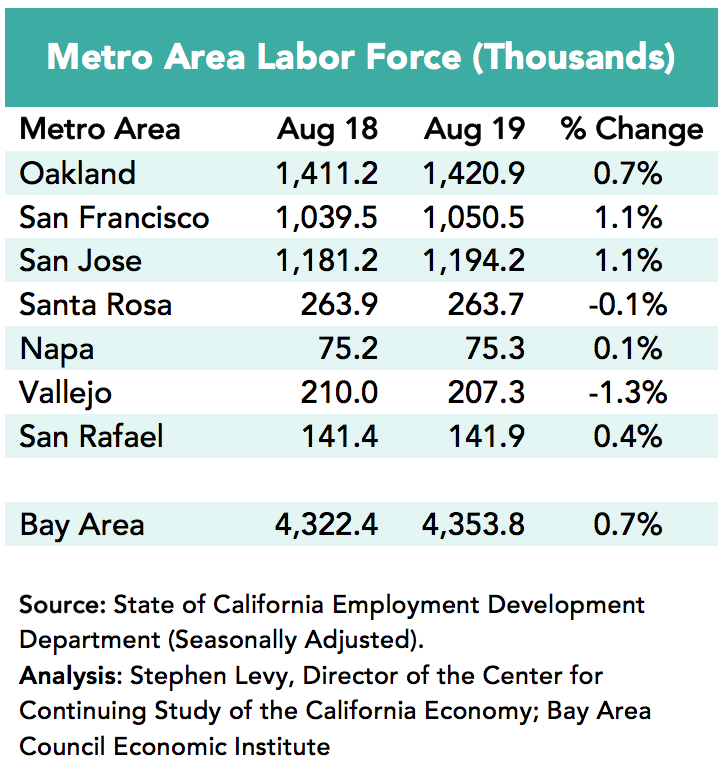
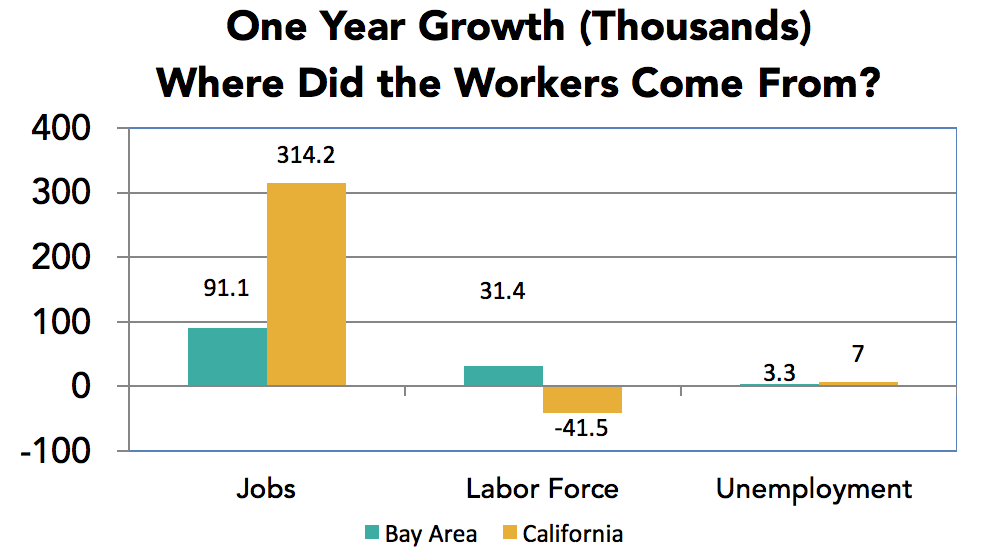
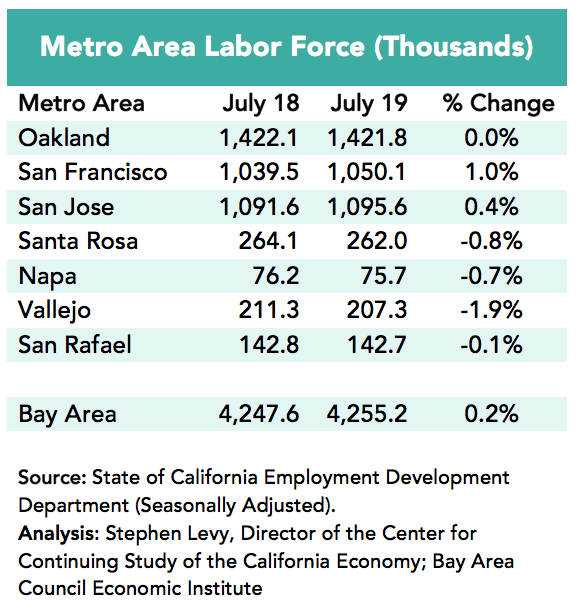
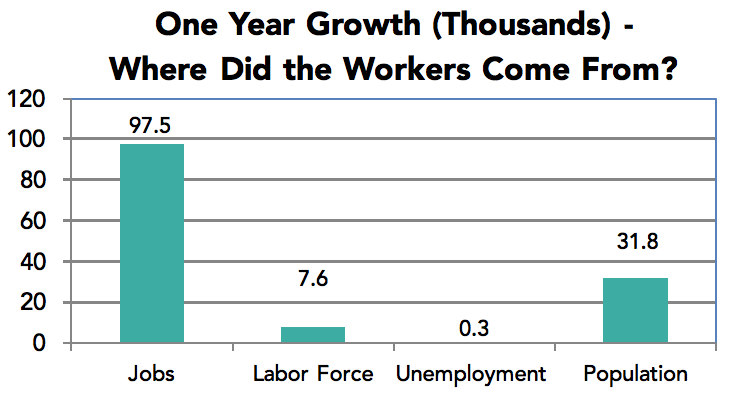
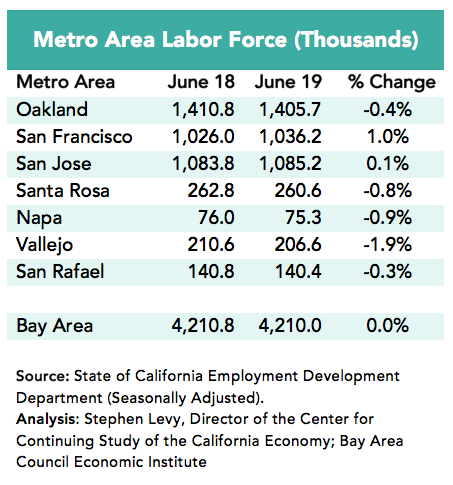
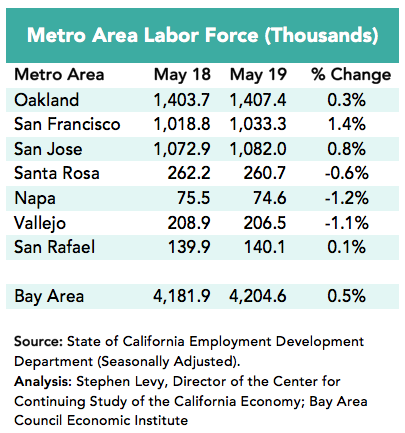
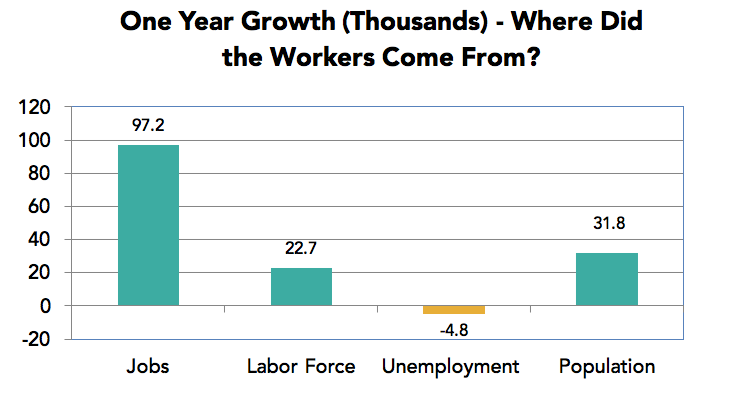
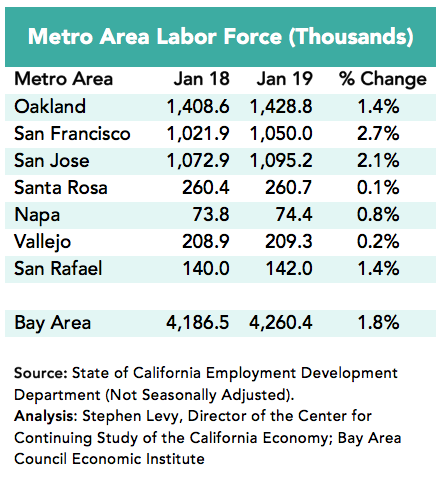
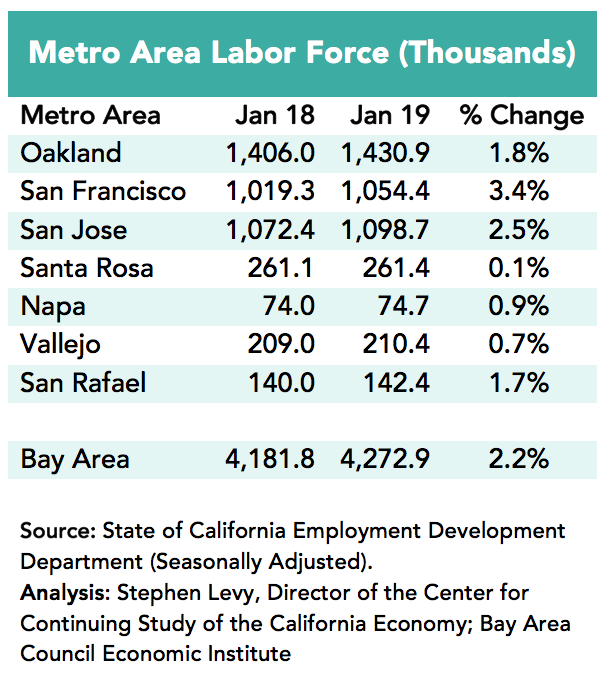
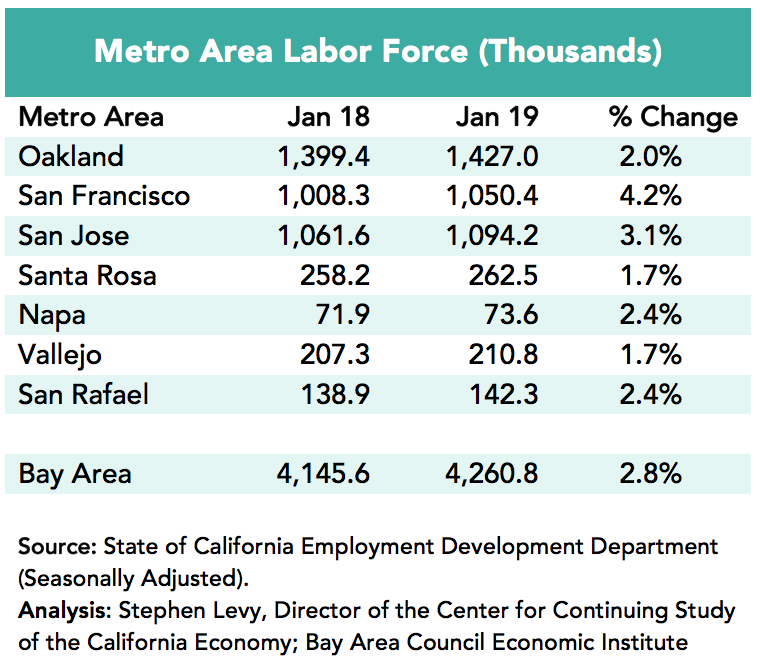
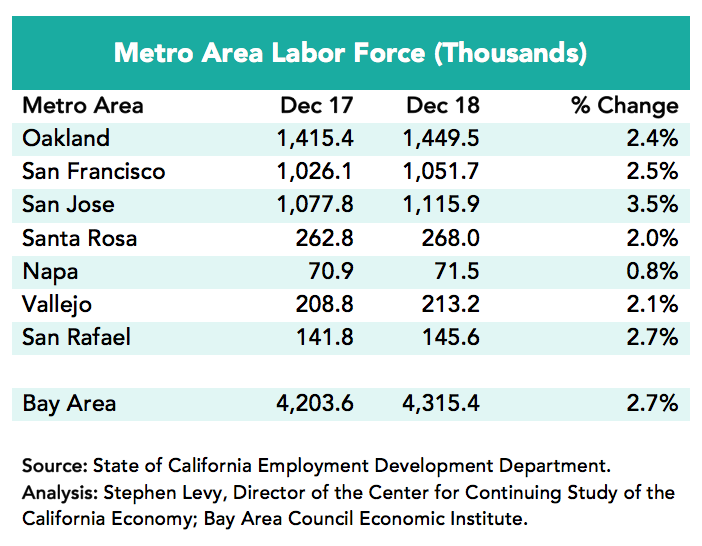
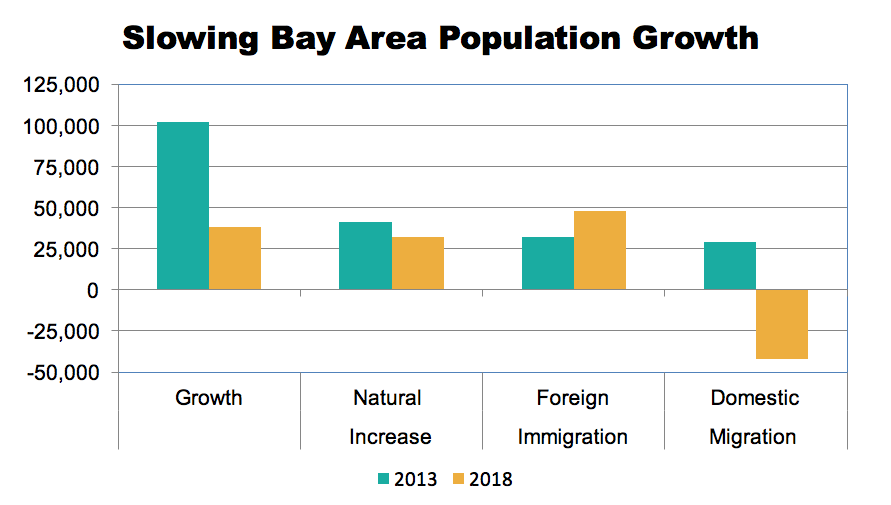
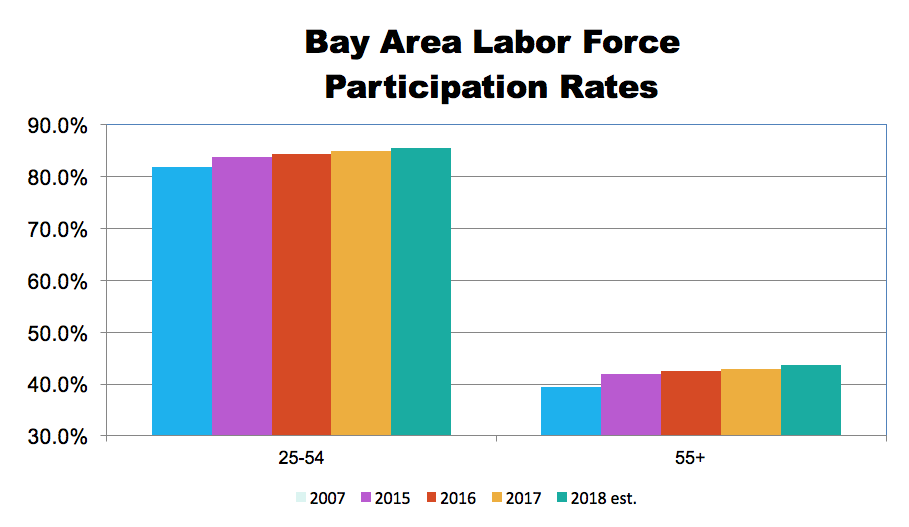
Bay Area and State Labor Force Still Below Pre-Pandemic Levels but Where Will Workforce Growth Come From.
The state has almost 300,000 fewer workers than in the month before the pandemic started and the Bay Area has almost 70,000 fewer residents in the workforce.
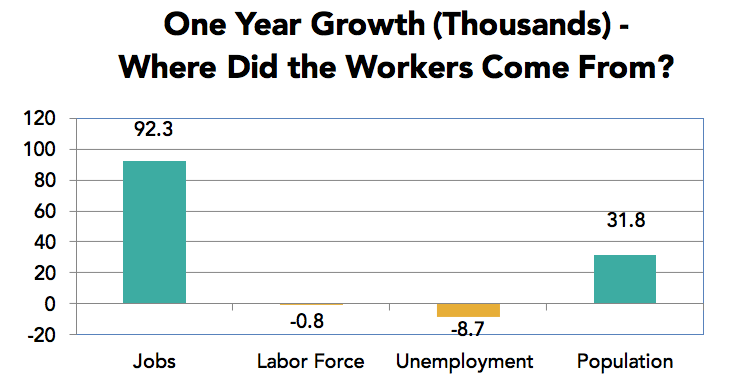
Though job growth has continued, it is not clear where new workers will come from with low unemployment already and low population growth It is possible that more workers can come from remote locations so the Bay Area and state can see job growth without more residents working. Job openings remain high and sectors like air travel are constrained by lack of enough workers. Increasing the level of immigration would be a large help to the region and state.
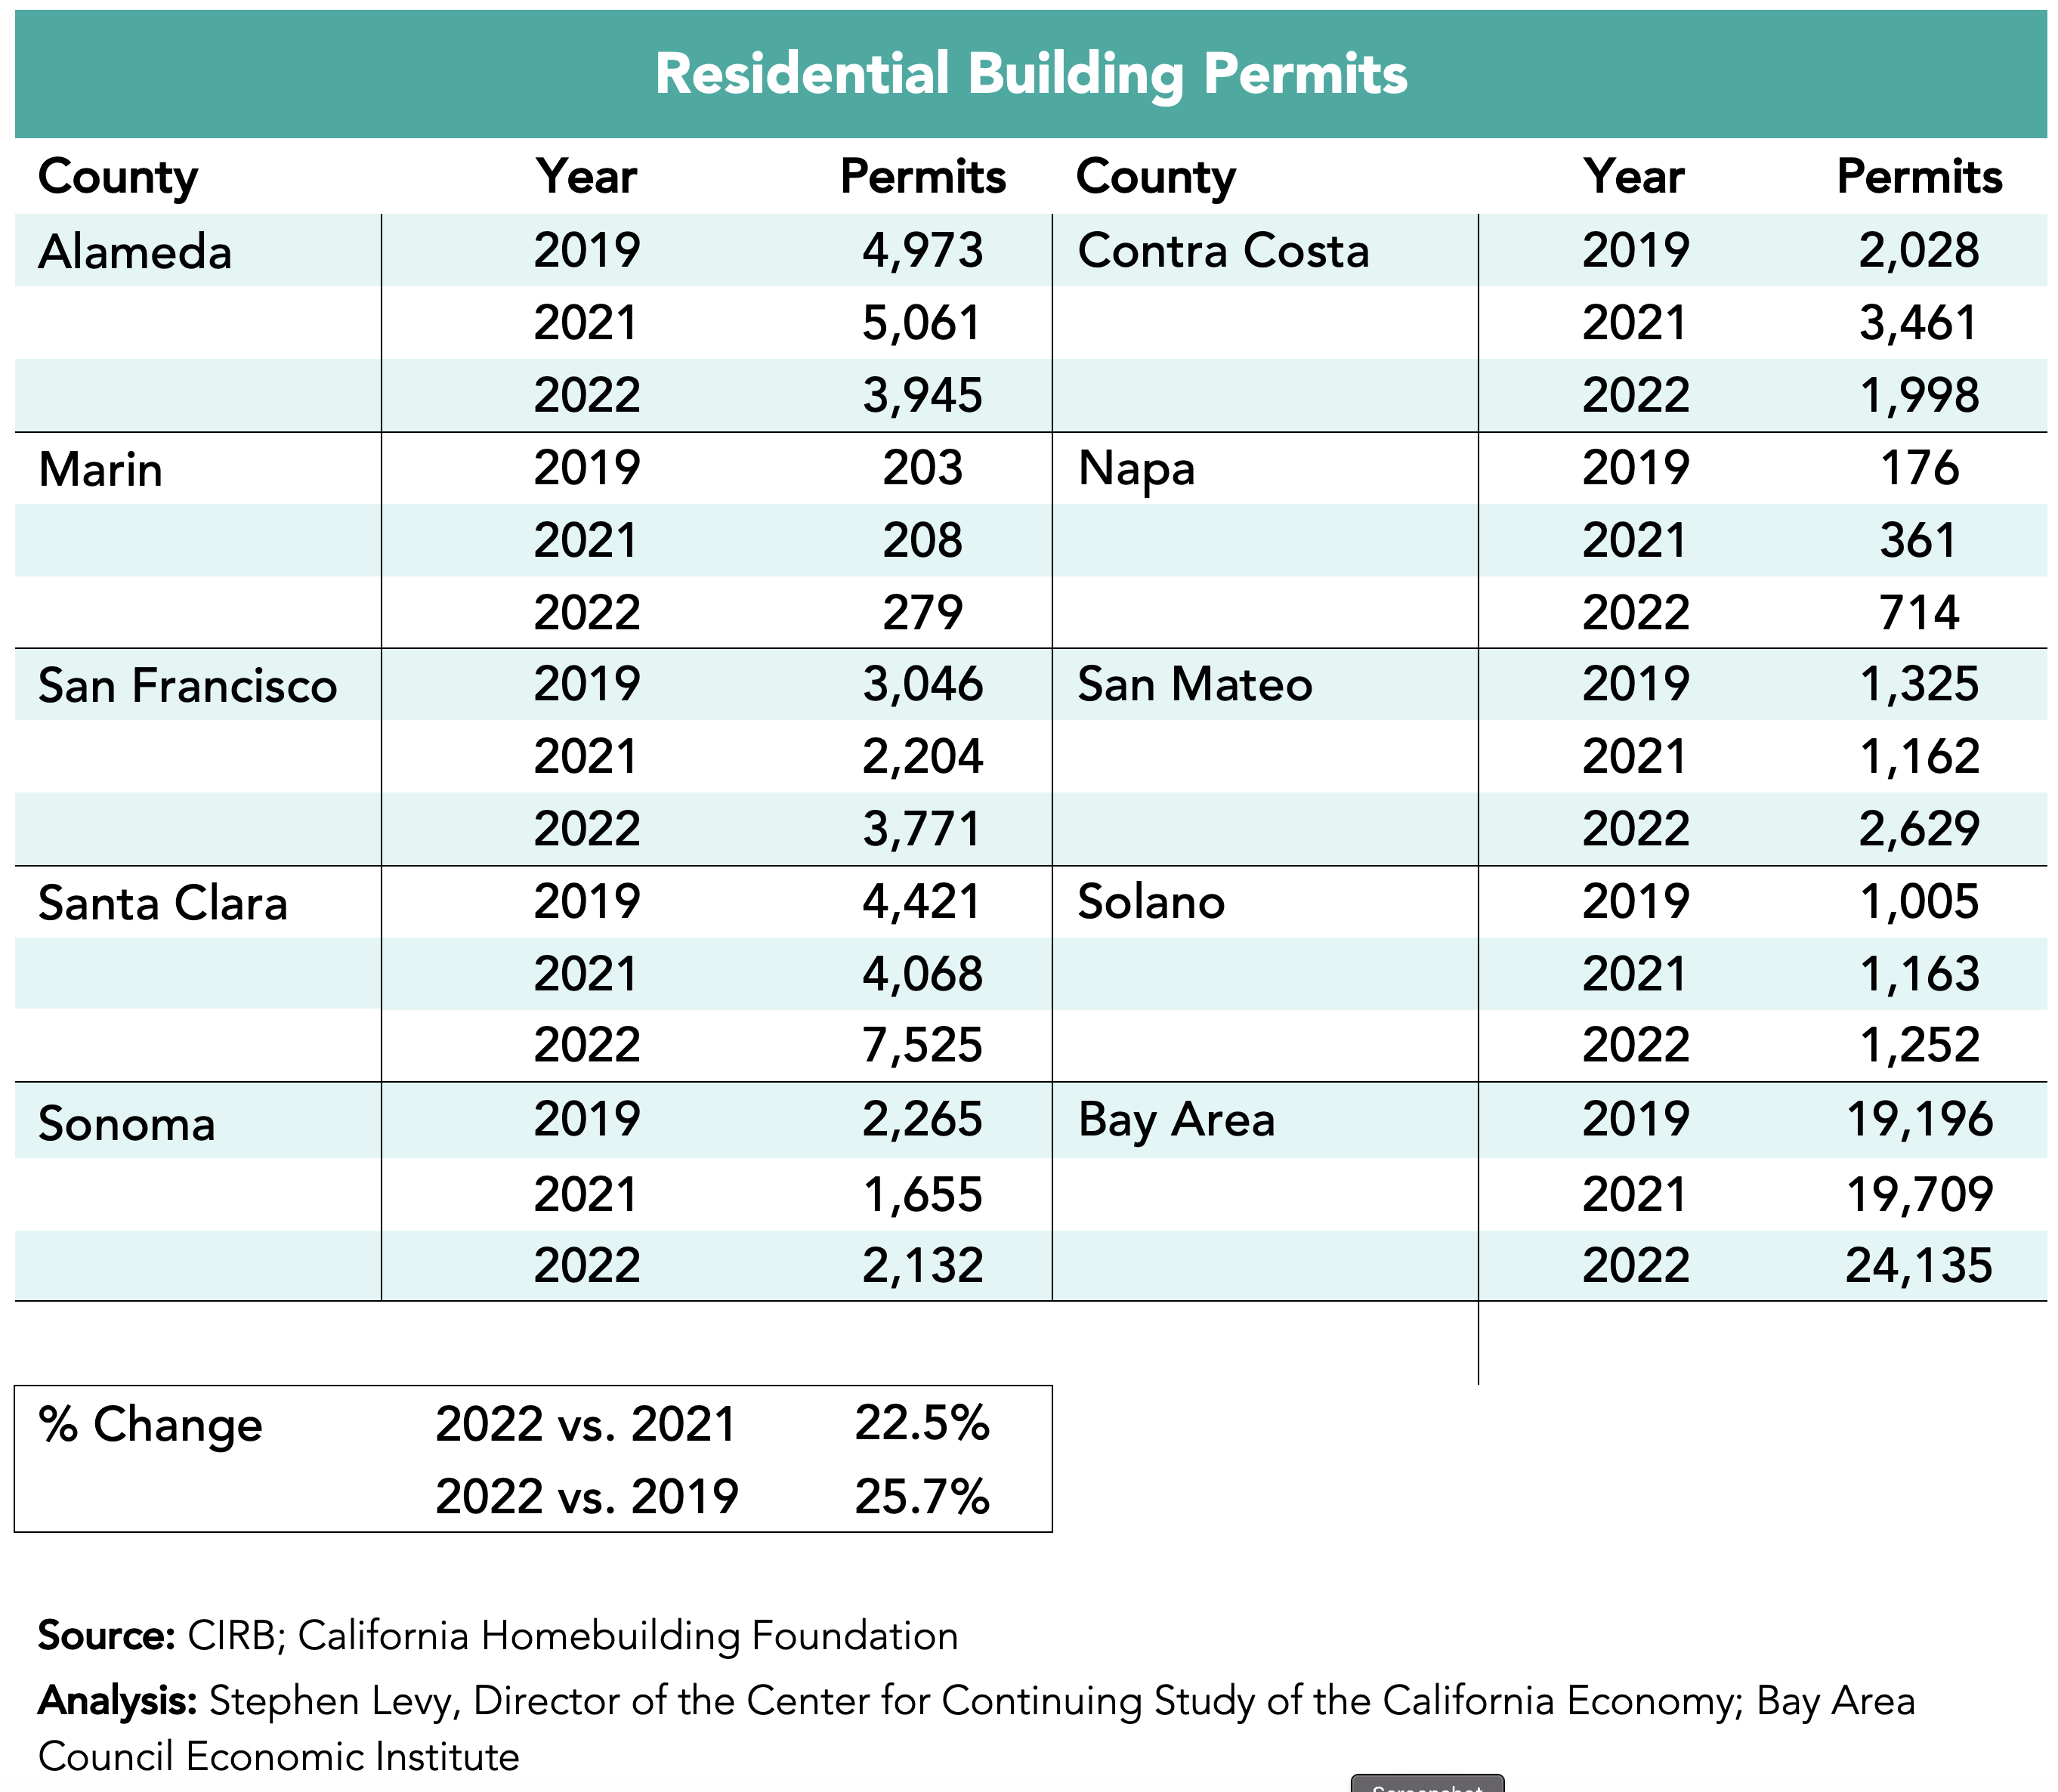
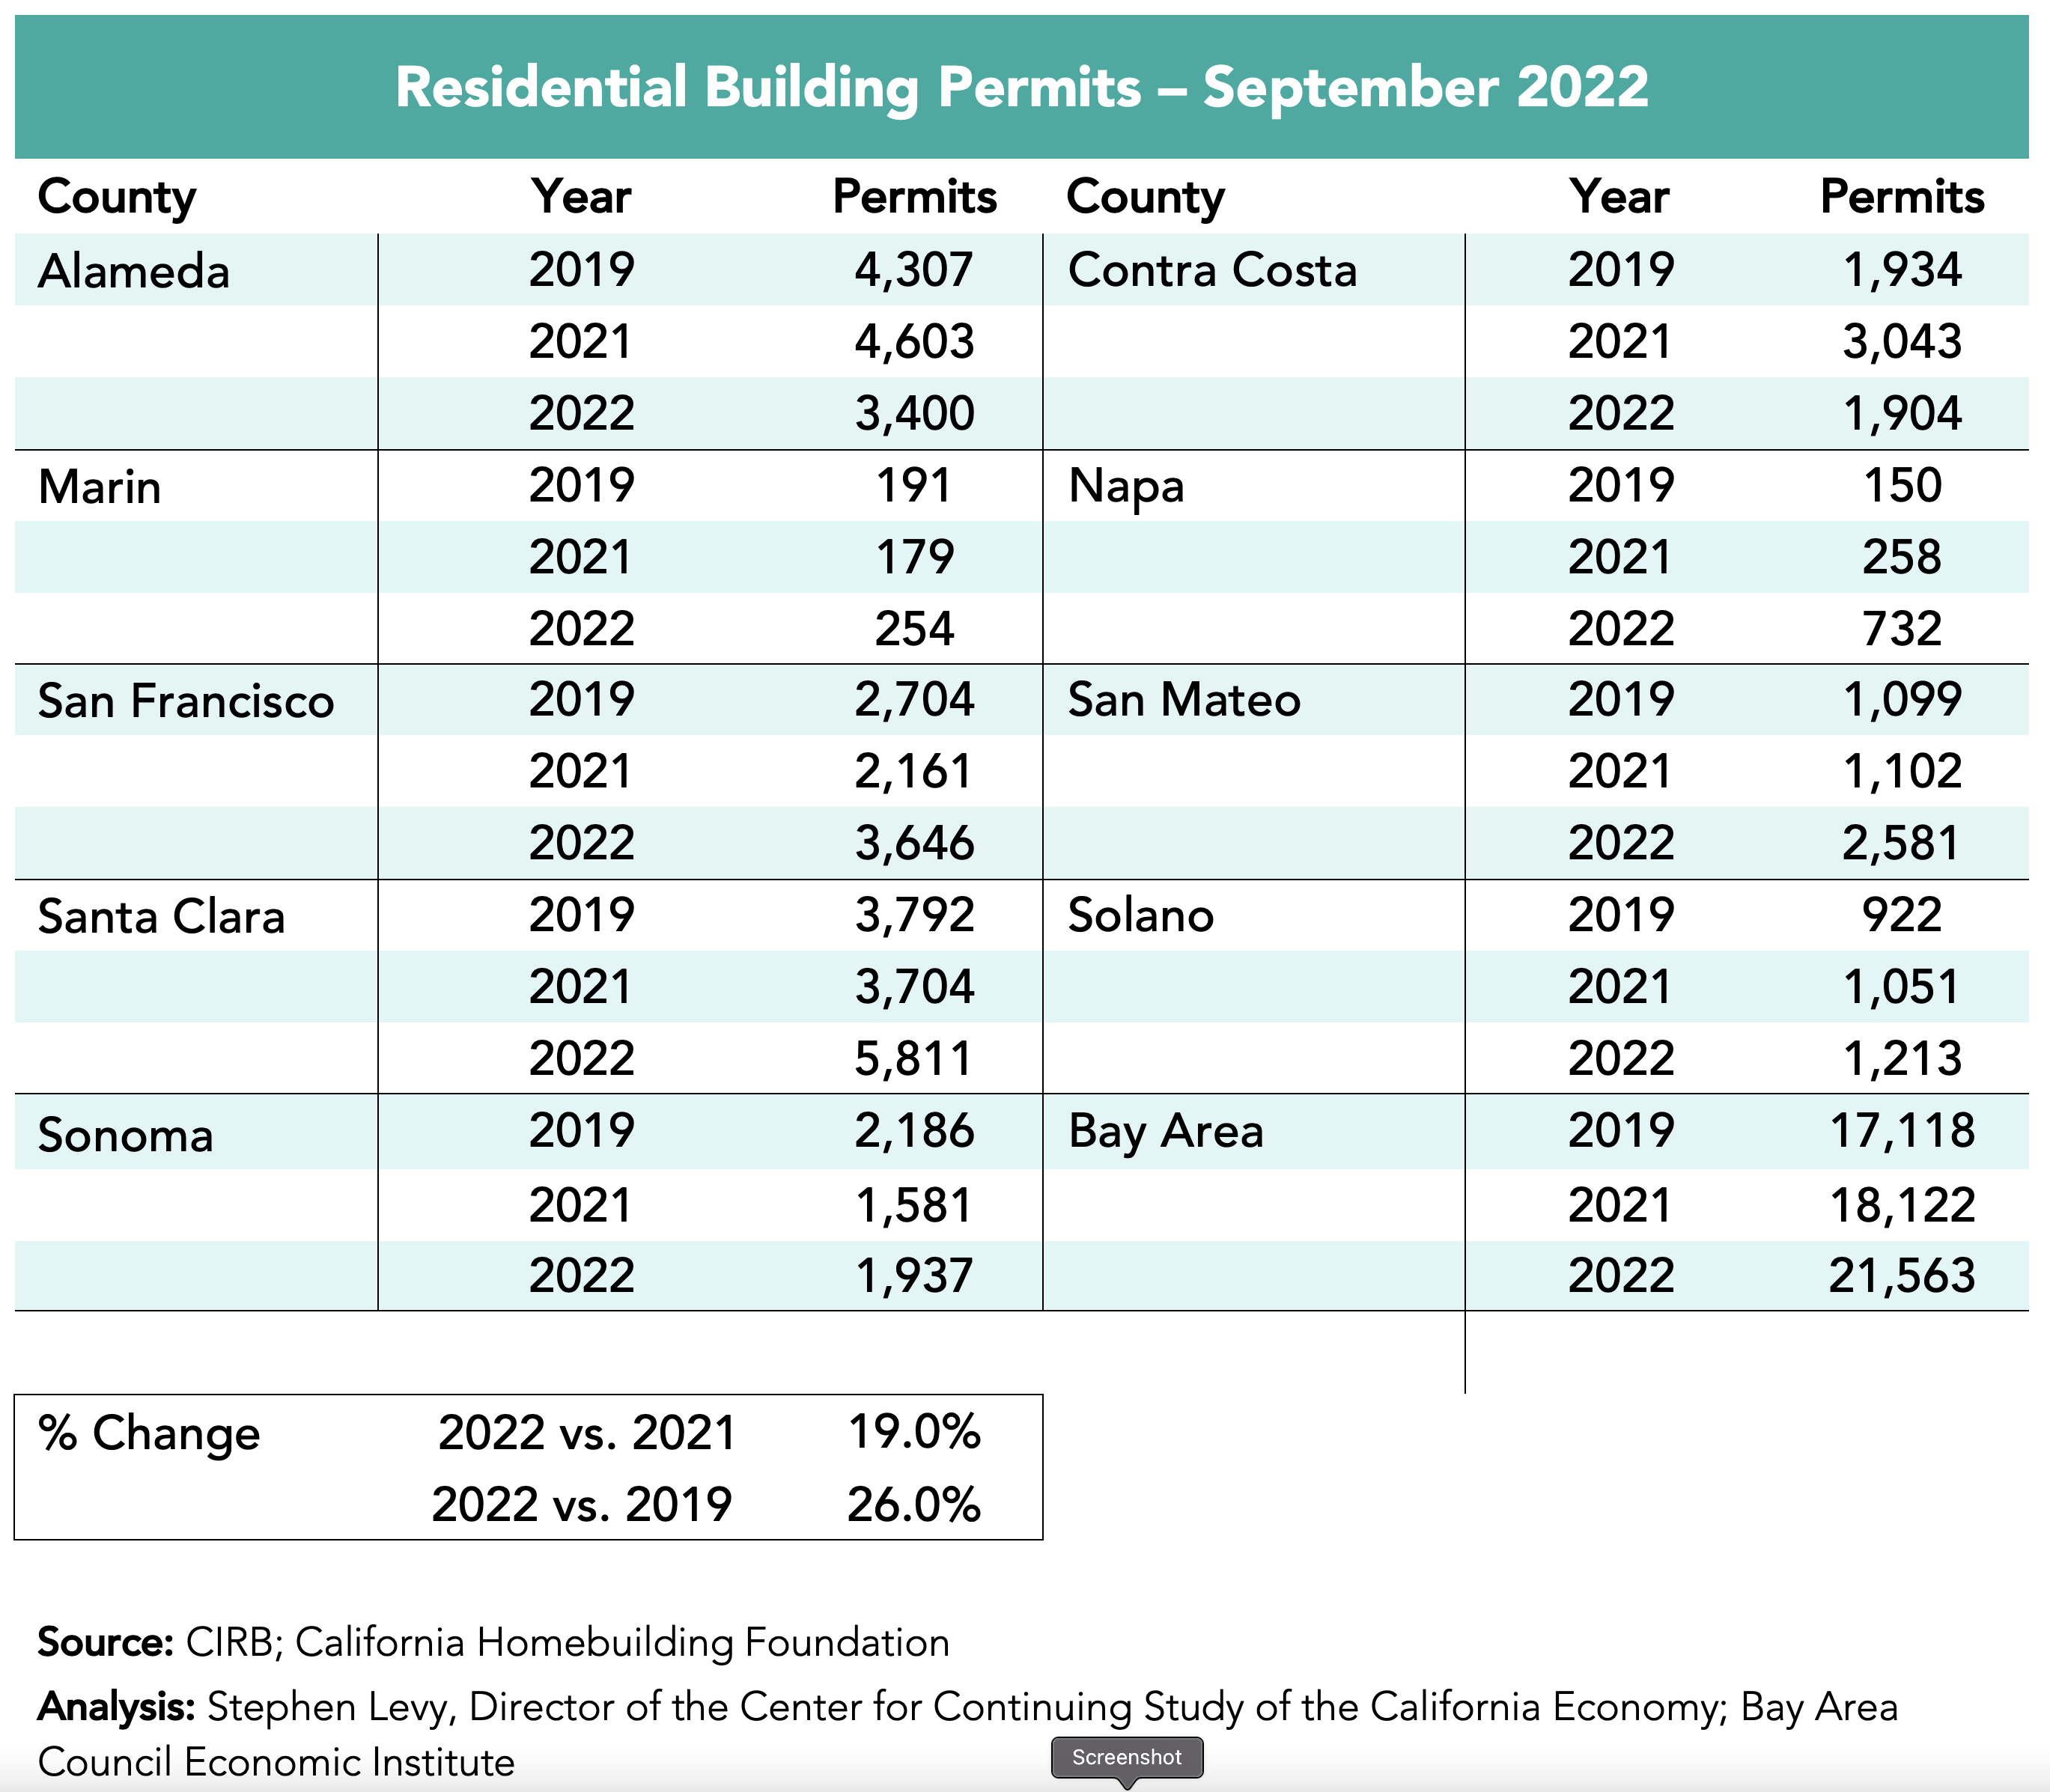
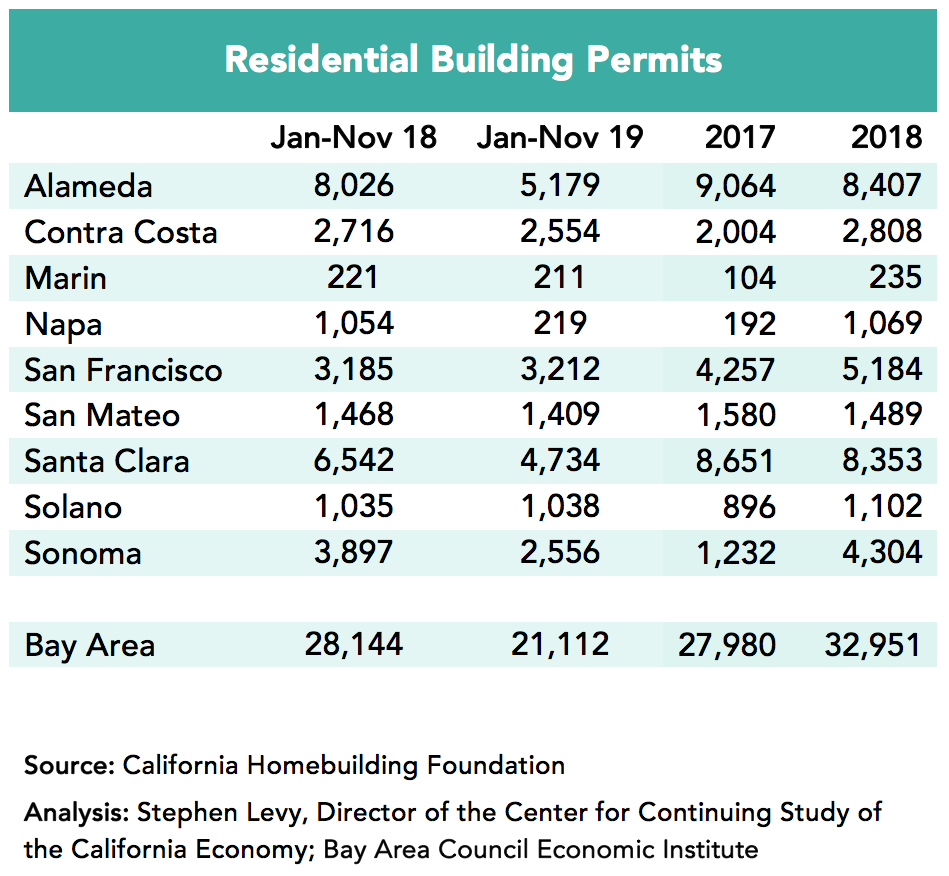
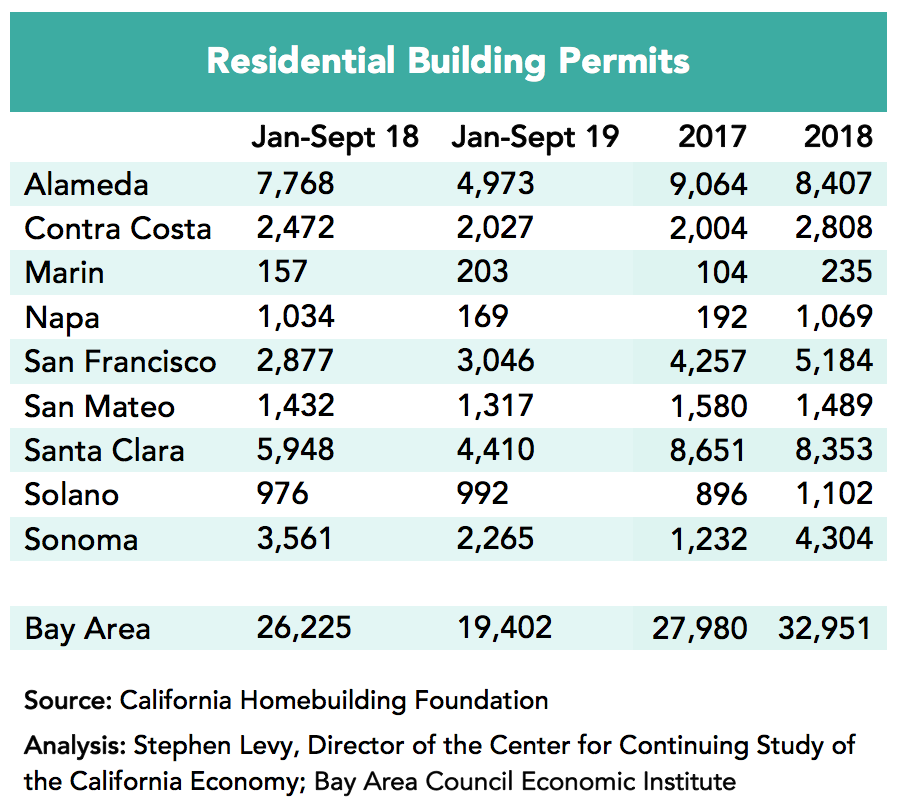
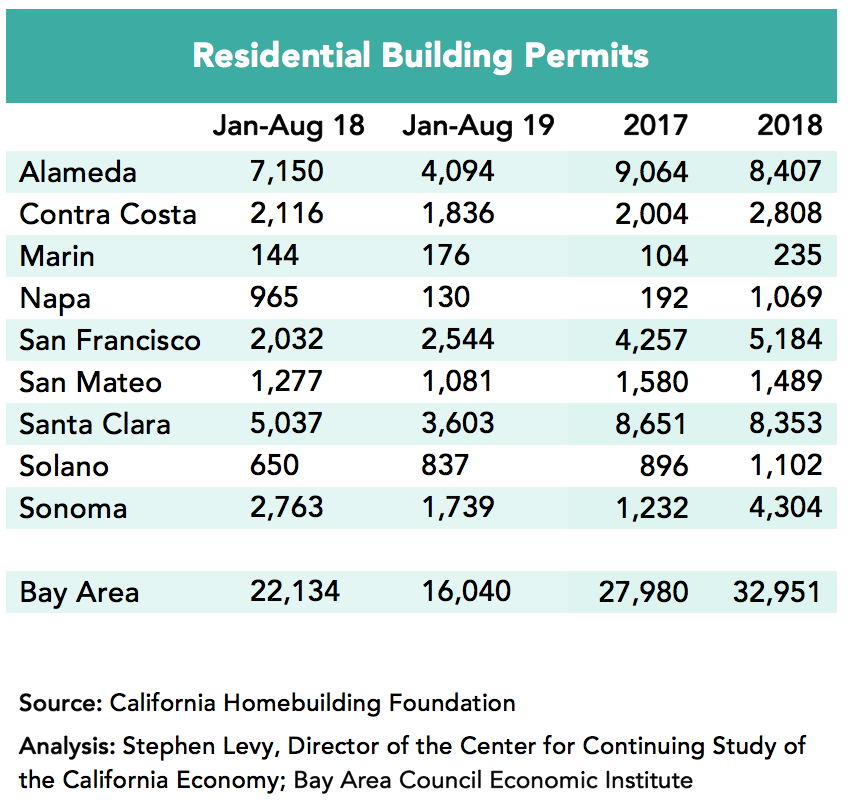
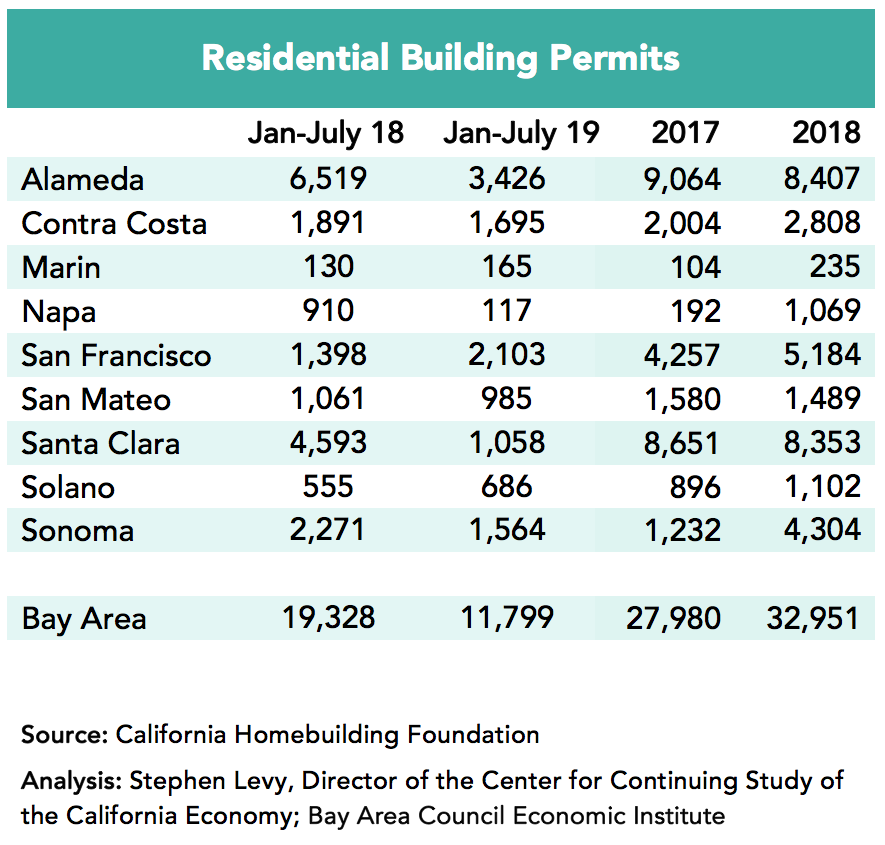
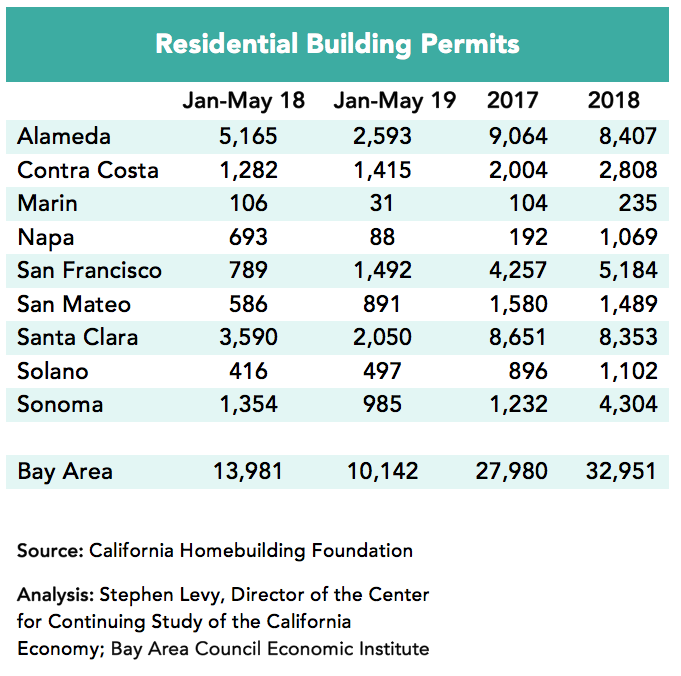
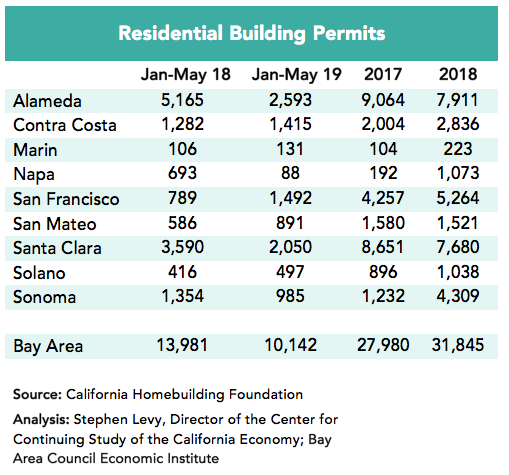
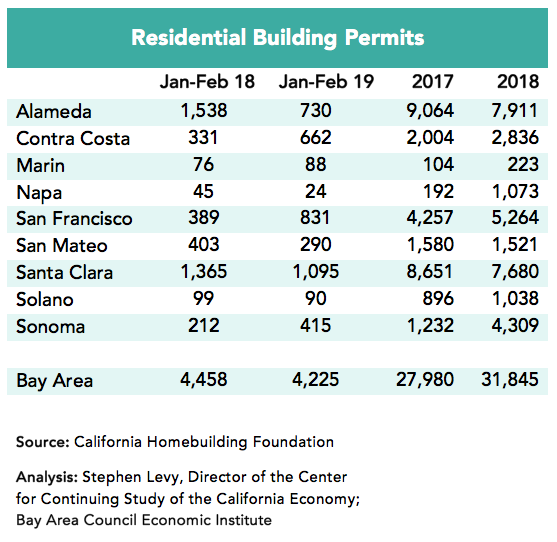
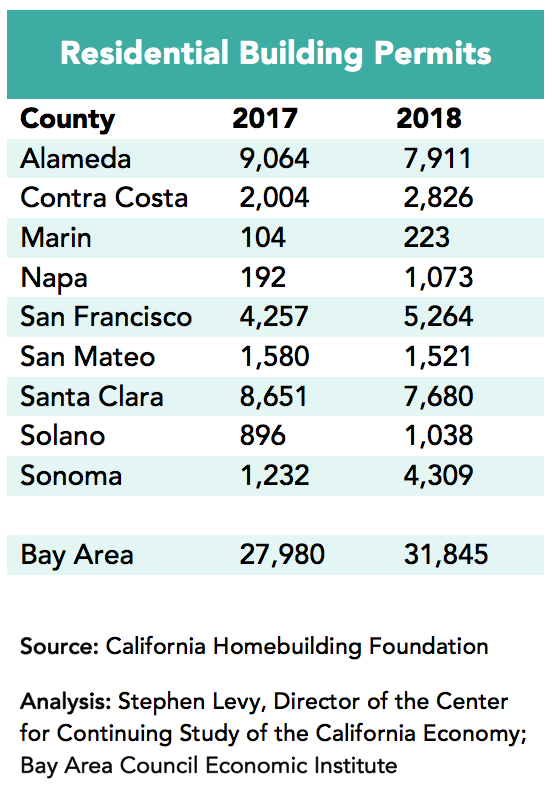
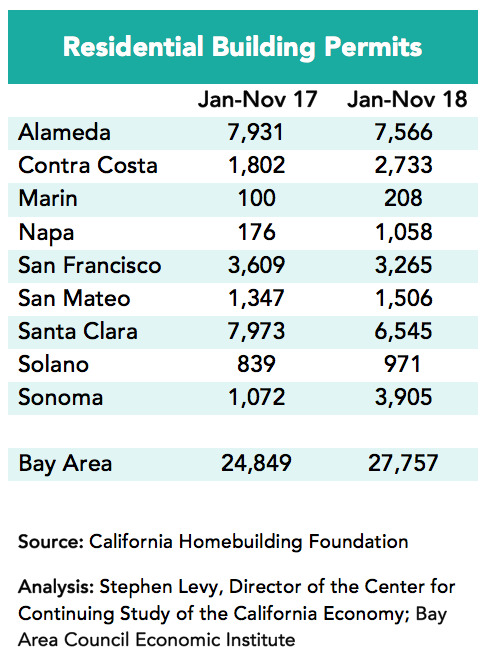
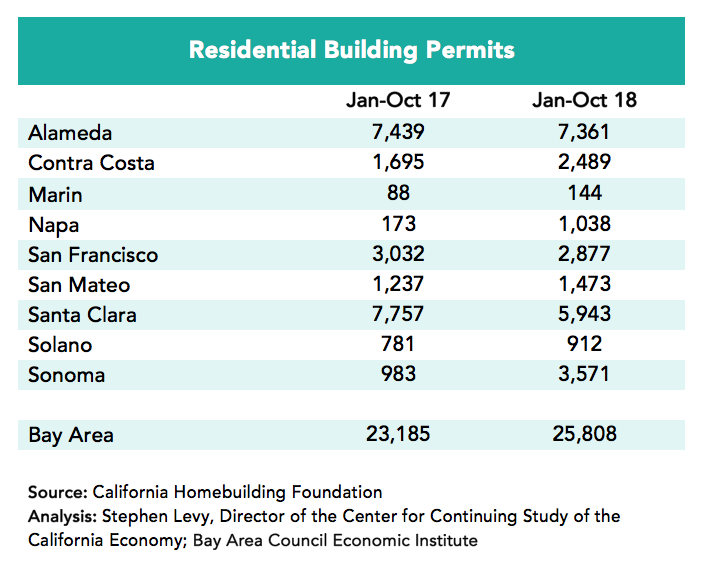
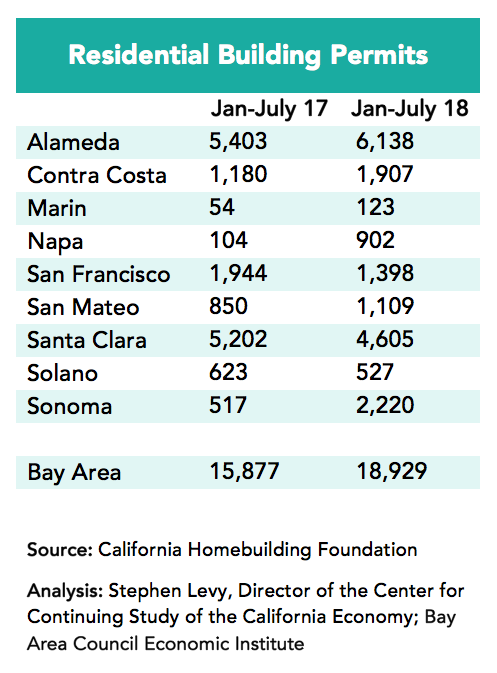
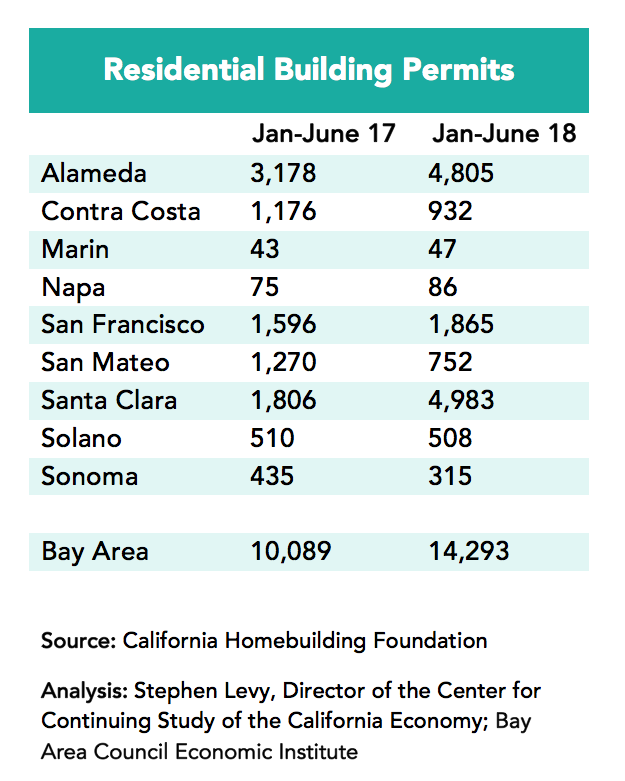
A Welcome Uptick in Housing Permits
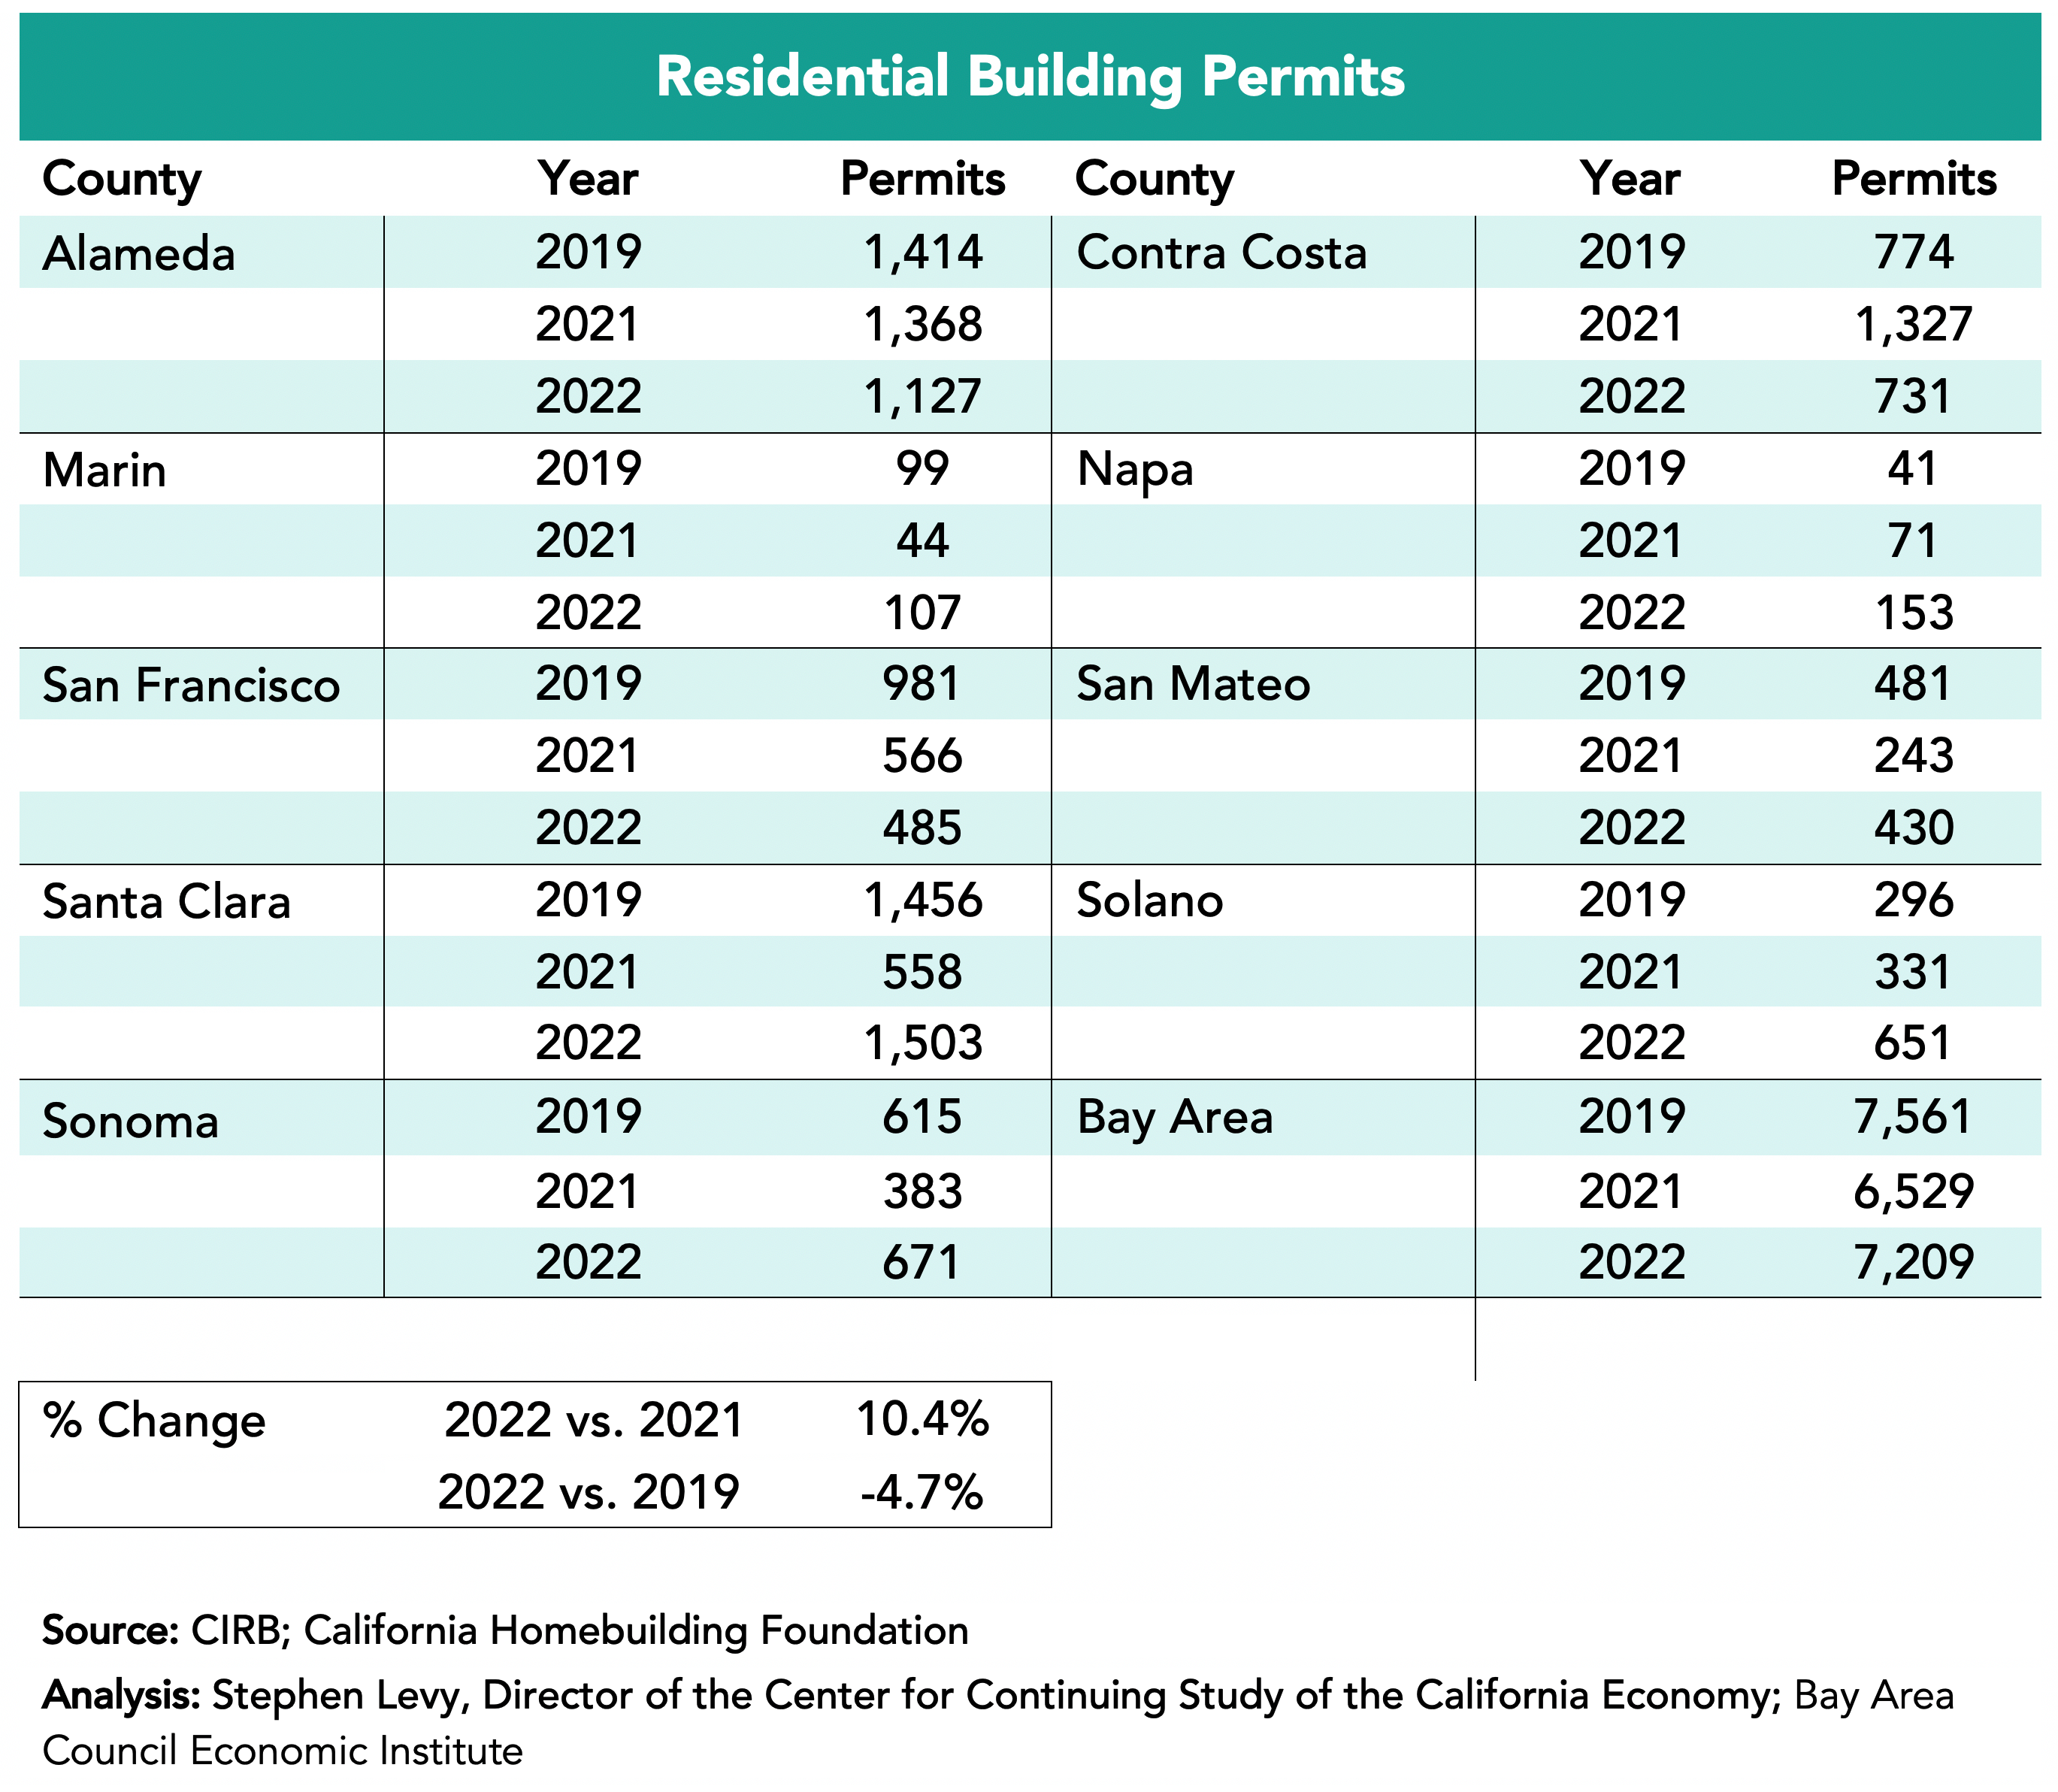
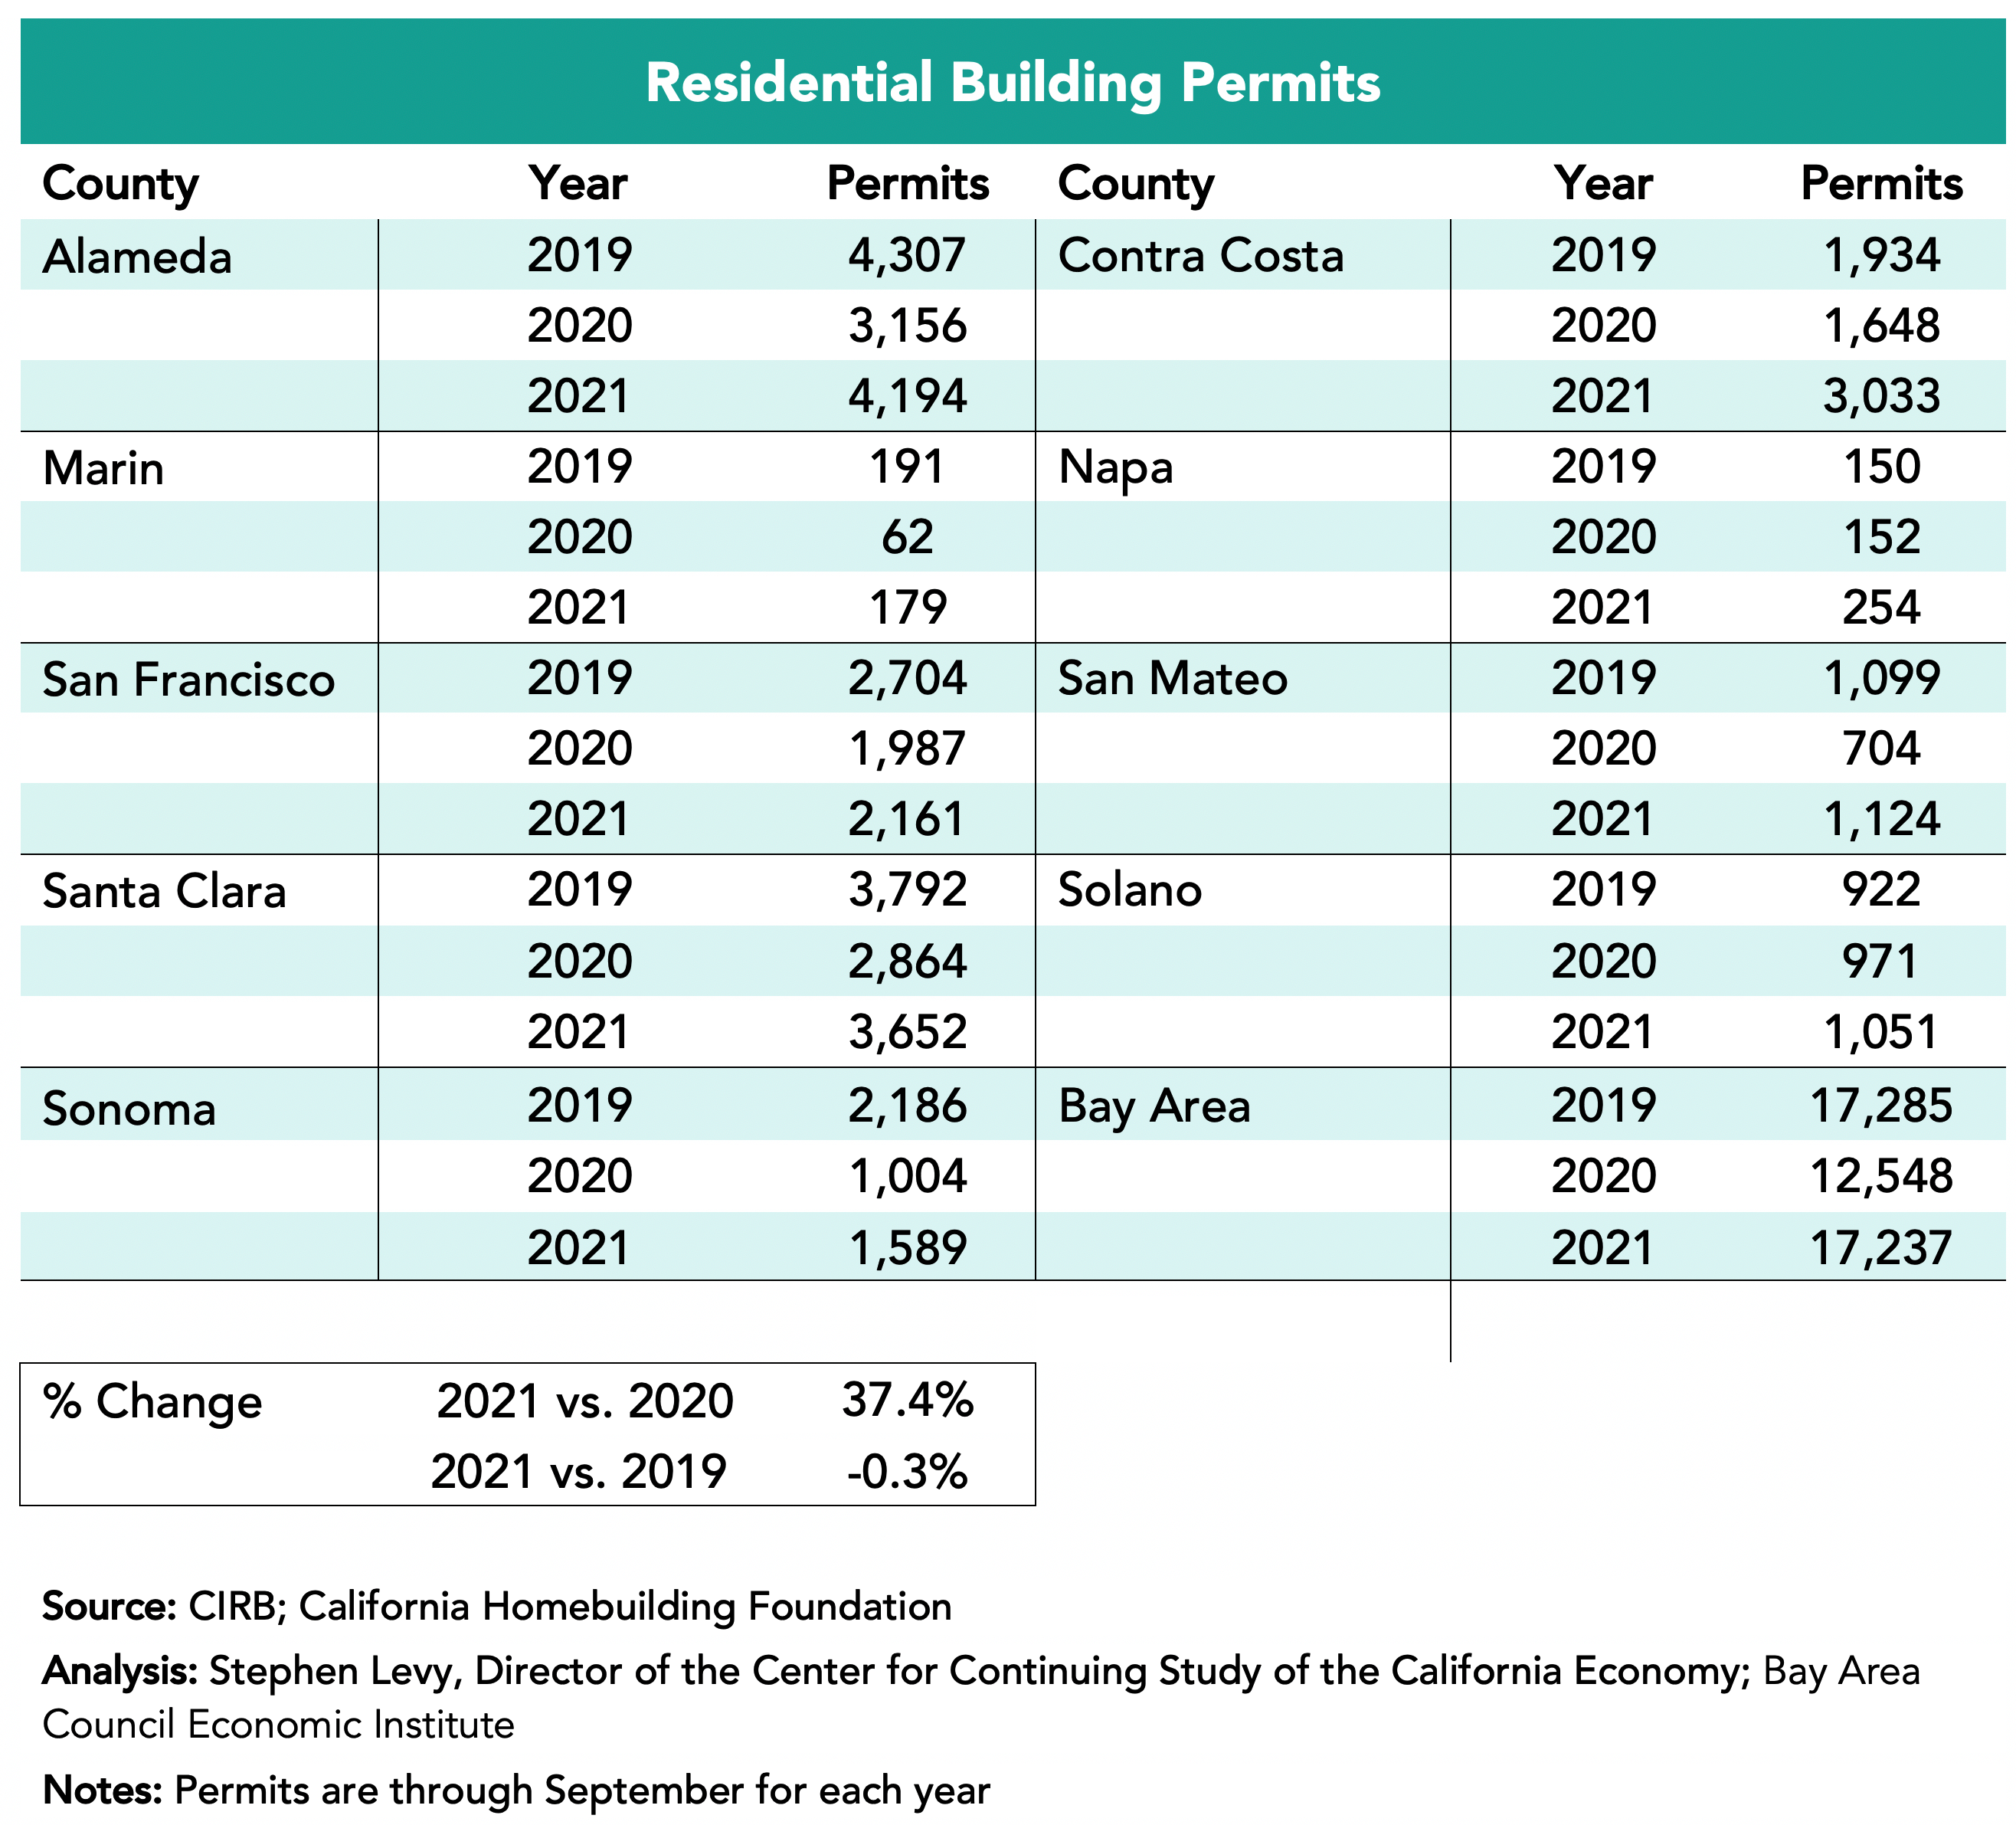
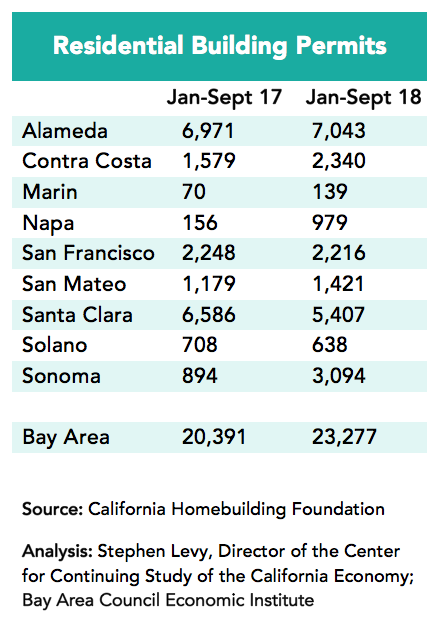
Permits levels in the first ten months of 2022 exceeded 2019 and 2021 levels though East Bay permit levels were below earlier levels. The other counties showed large year over year gains. In addition, now there are almost daily reports of new housing projects being proposed and approved though it is often a long step until these units are completed and on the market. Bay Area cities are updating their Housing Elements currently and learning about the requirements to meet their RHNA goals. It is possible that the RHNA and update process is encouraging cities to loosen development standards and to approve more projects. While the current growth in permits is a positive sign, these levels are still below the RHNA targets for the region. More needs to be done.
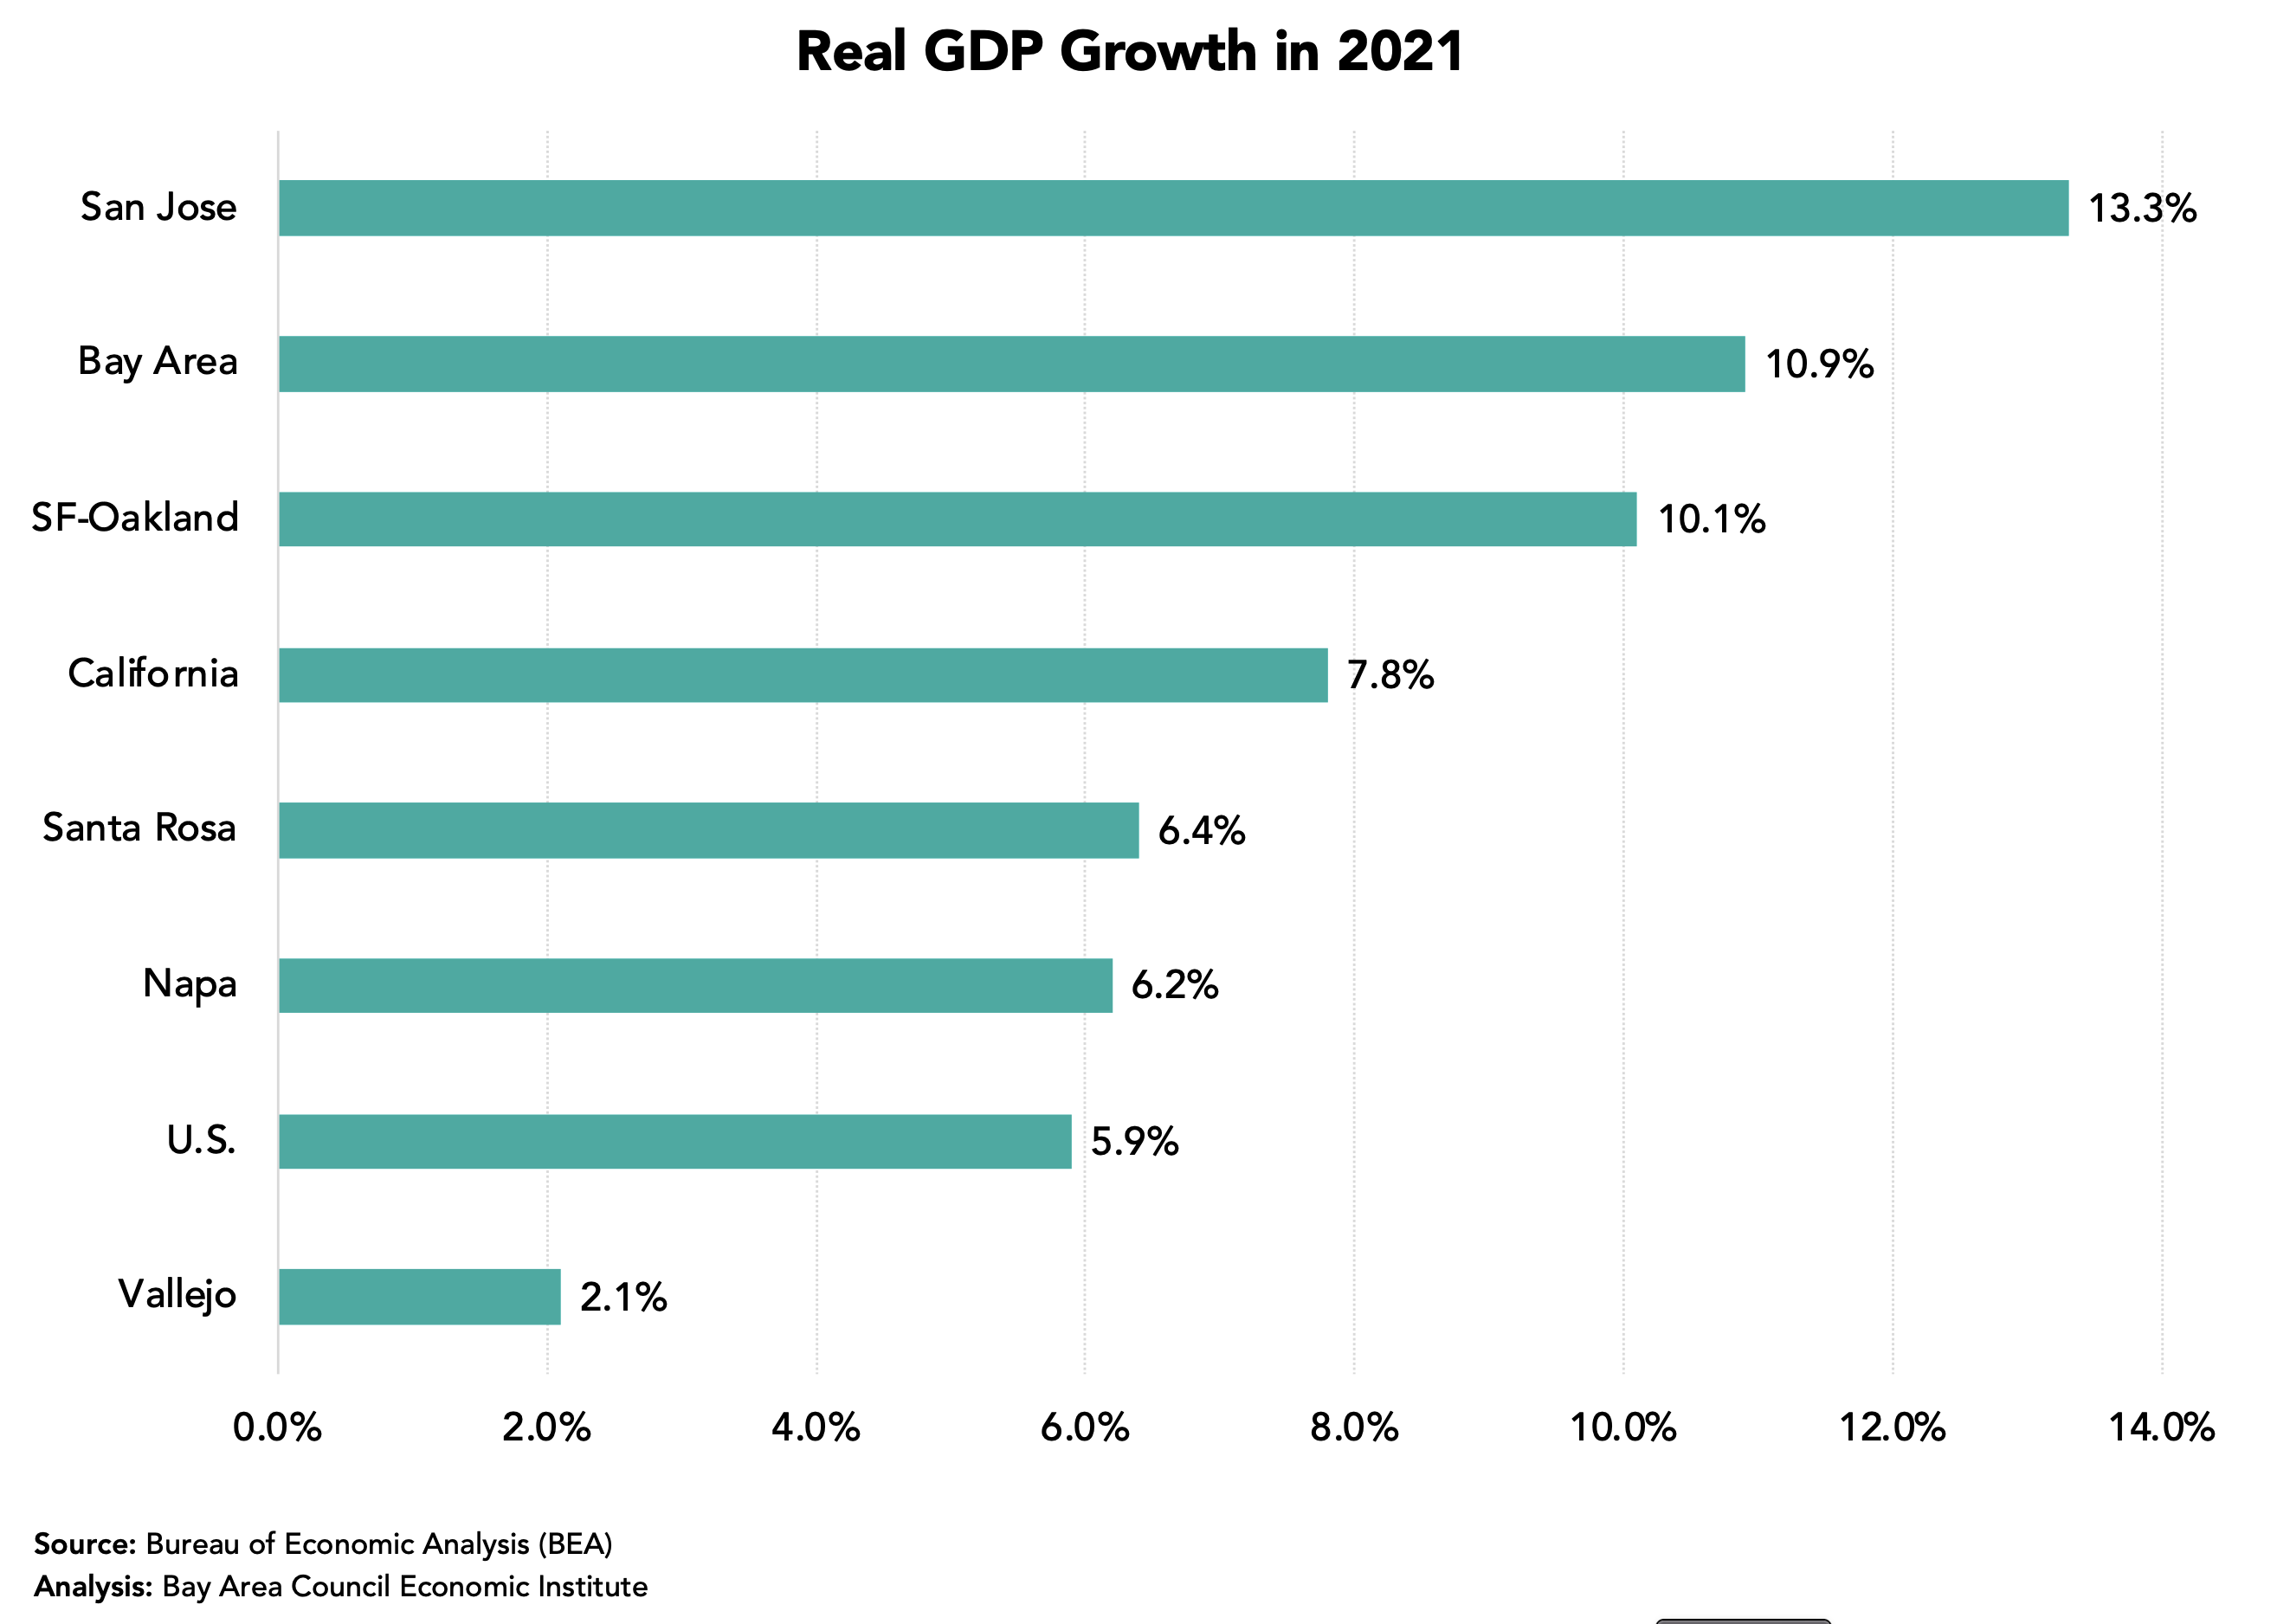
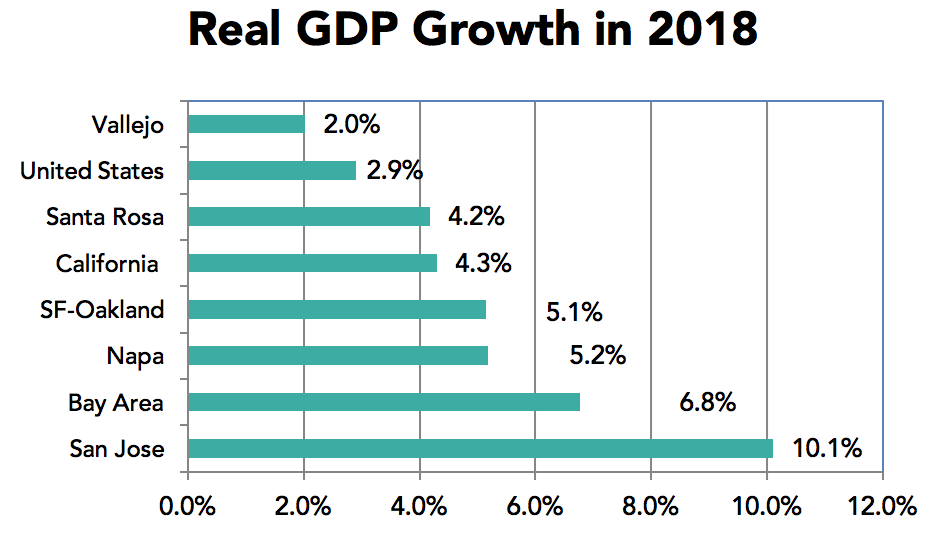
Strong GDP Gains in 2021
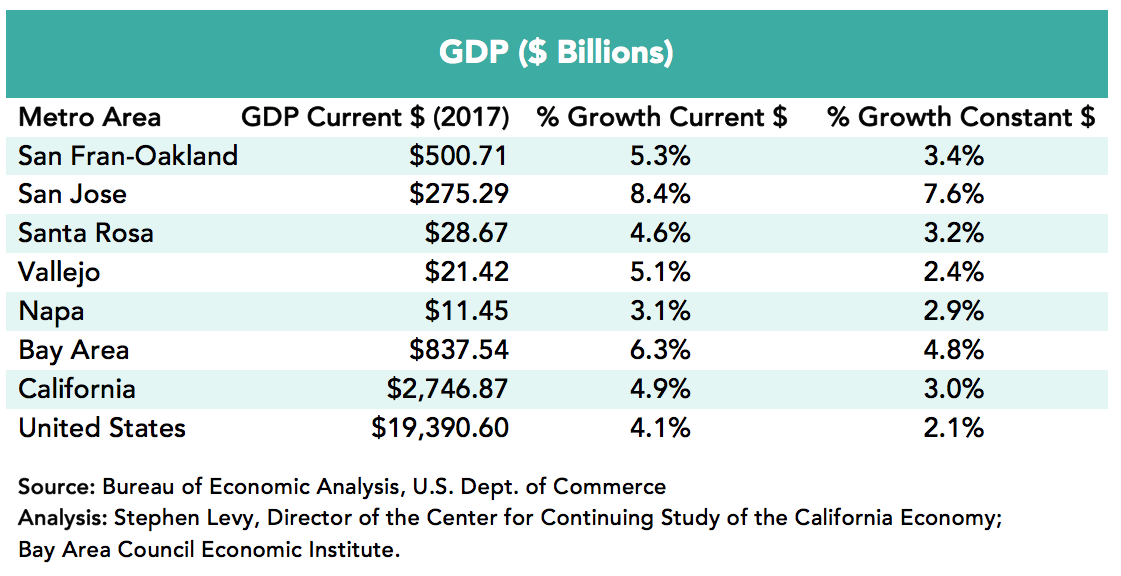
Real GDP rose by 10.9% in the region between 2020 and 2021 according to estimates released by BEA on December 8th this year.
Real GDP increased most in the San Jose metro area (+13.3%) followed by the SF-Oakland metro area that includes Marin County (+10.1%). The Napa and Santa Rose metro areas outpaced the nation while the Vallejo metro area had the region’s slowest GDP growth in 2021.
The Bay Area not only outpaced the nation in GDP growth, the region’s growth topped that of all states.
These economic updates are authored by Stephen Levy, Director of the Center for Continuing Study of the California Economy, and a member of the Bay Area Council Economic Institute board.
November 21, 2022
The highlights:
• The Bay Area added 17,600 jobs in October after two months of slow growth. Unemployment rates ticked up slightly but the region’s UE rate in October was 2.6%.
• Both the region and state showed conflicting trends between the jobs survey (up) and the household survey with rising unemployment and a decline in the labor force.
• In May Bay Area unemployment levels and unemployment rates fell to record lows.
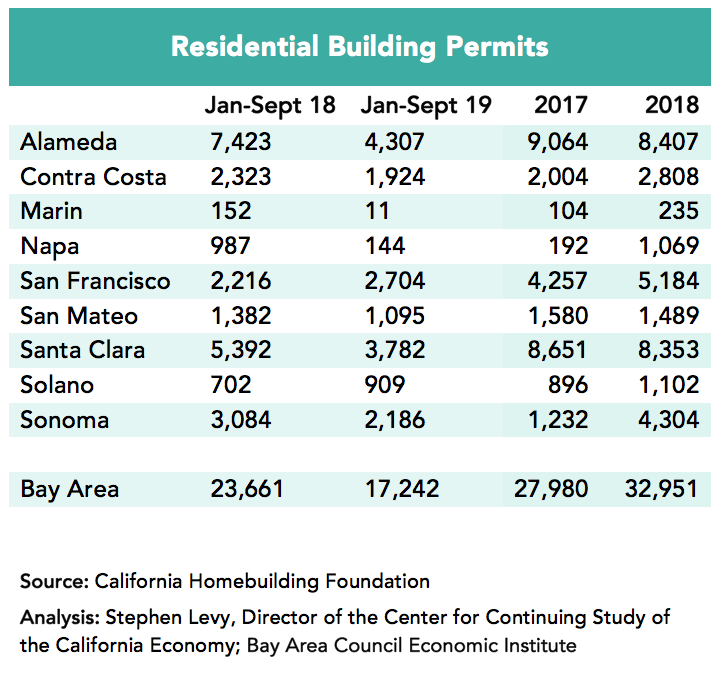
• Housing permits for the first nine months of the year surpassed both 2021 and 2019 levels though still well below the region’s new RHNA targets.
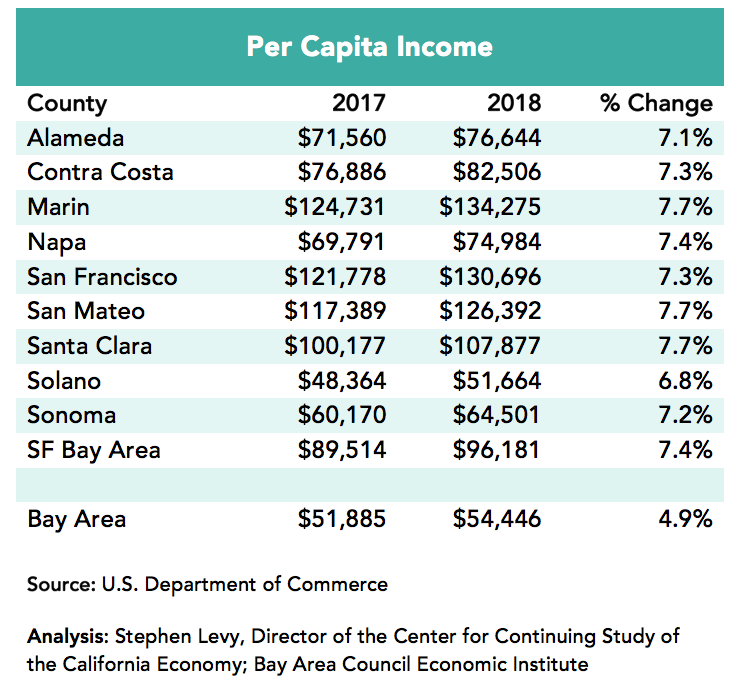
• Total and per capita income rose sharply across the region and state according to BEA estimates released this week.
• The challenges of high inflation and interest rates remain as well, as the Bay Area faces challenges of housing, transportation and supporting competitiveness.
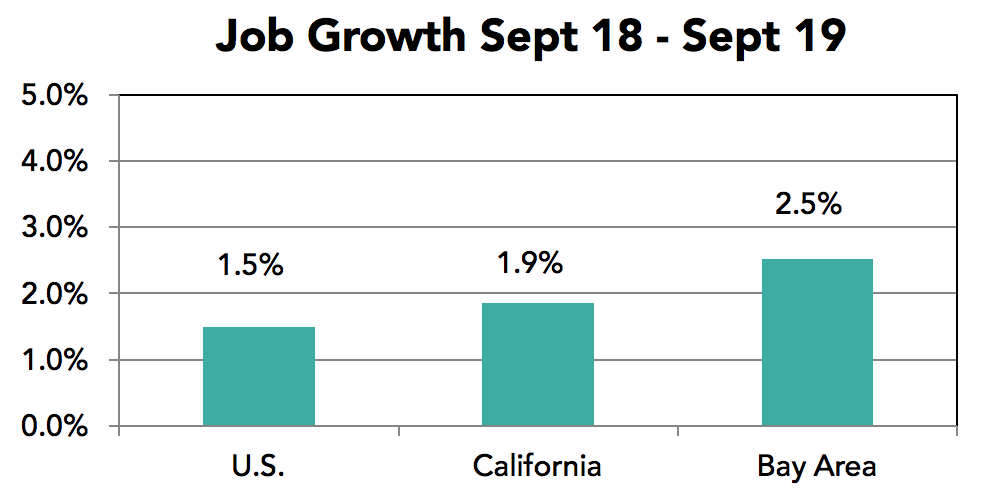
Even with the Recent Slowdown the Bay Area and State Posted Above Average Job Growth During the Past 12 Months
All regions in the state except the San Joaquin Valley outpaced the nation in job growth during the past 12 months led by the Bay Area and San Diego.
The chart below gets wide media attention and focuses on our region’s below-average job recovery rate. The chart above indicates that the Bay Area is catching up.
Payroll Job Growth Shows the San Jose Metro Area Leads the Region
The Bay Area added 178,000 jobs in the past year (+4.6%) led by a gain of 67,300 in the San Francisco metro area though SF has recovered just 91.3% of the jobs lost between February and April 2020. The San Jose metro area added 53,700 jobs and by October 2022 had recovered 104.2% of the payroll jobs lost between February and April 2020. The Oakland metro area added 42,800 jobs during the past year. Other metro areas have been slower to recover lost jobs.
Unemployment Trends
Unemployment rates ticked up a small amount in October but remain low by historical standards. The October 2022 rate of 2.6% for the region is below the February 2020 pre-pandemic rate of 2.7%.
Bay Area and State Labor Force Still Below Pre-Pandemic Levels but Where Will Workforce Growth Come From.
The state has more than 200,000 fewer workers than in the month before the pandemic started and the Bay Area has more than 50,000 fewer residents in the workforce.
Though the recent pace of job growth has been encouraging, it is not clear where new workers will come from with low unemployment already and low population growth. Perhaps the new school year going back towards normal will allow parents who dropped out to return to the workforce. And it is possible that more workers can come from remote locations so the Bay Area and state can see job growth without more residents working. Job openings remain high and sectors like air travel are constrained by lack of enough workers. Increasing the level of immigration would be a large help to the region and state.
A Welcome Uptick in Housing Permits
Permits levels in the first nine months of 2022 exceeded 2019 and 2021 levels though East Bay permit levels were below earlier levels. The other counties showed large year over year gains. In addition, now there are almost daily reports of new housing projects being proposed and approved though it is often a long step until these units are completed and on the market. Bay Area cities are updating their Housing Elements currently and learning about the requirements to meet their RHNA goals. It is possible that the RHNA and update process is encouraging cities to loosen development standards and to approve more projects. While the current growth in permits is a positive sign, these levels are still below the RHNA targets for the region. More needs to be done.
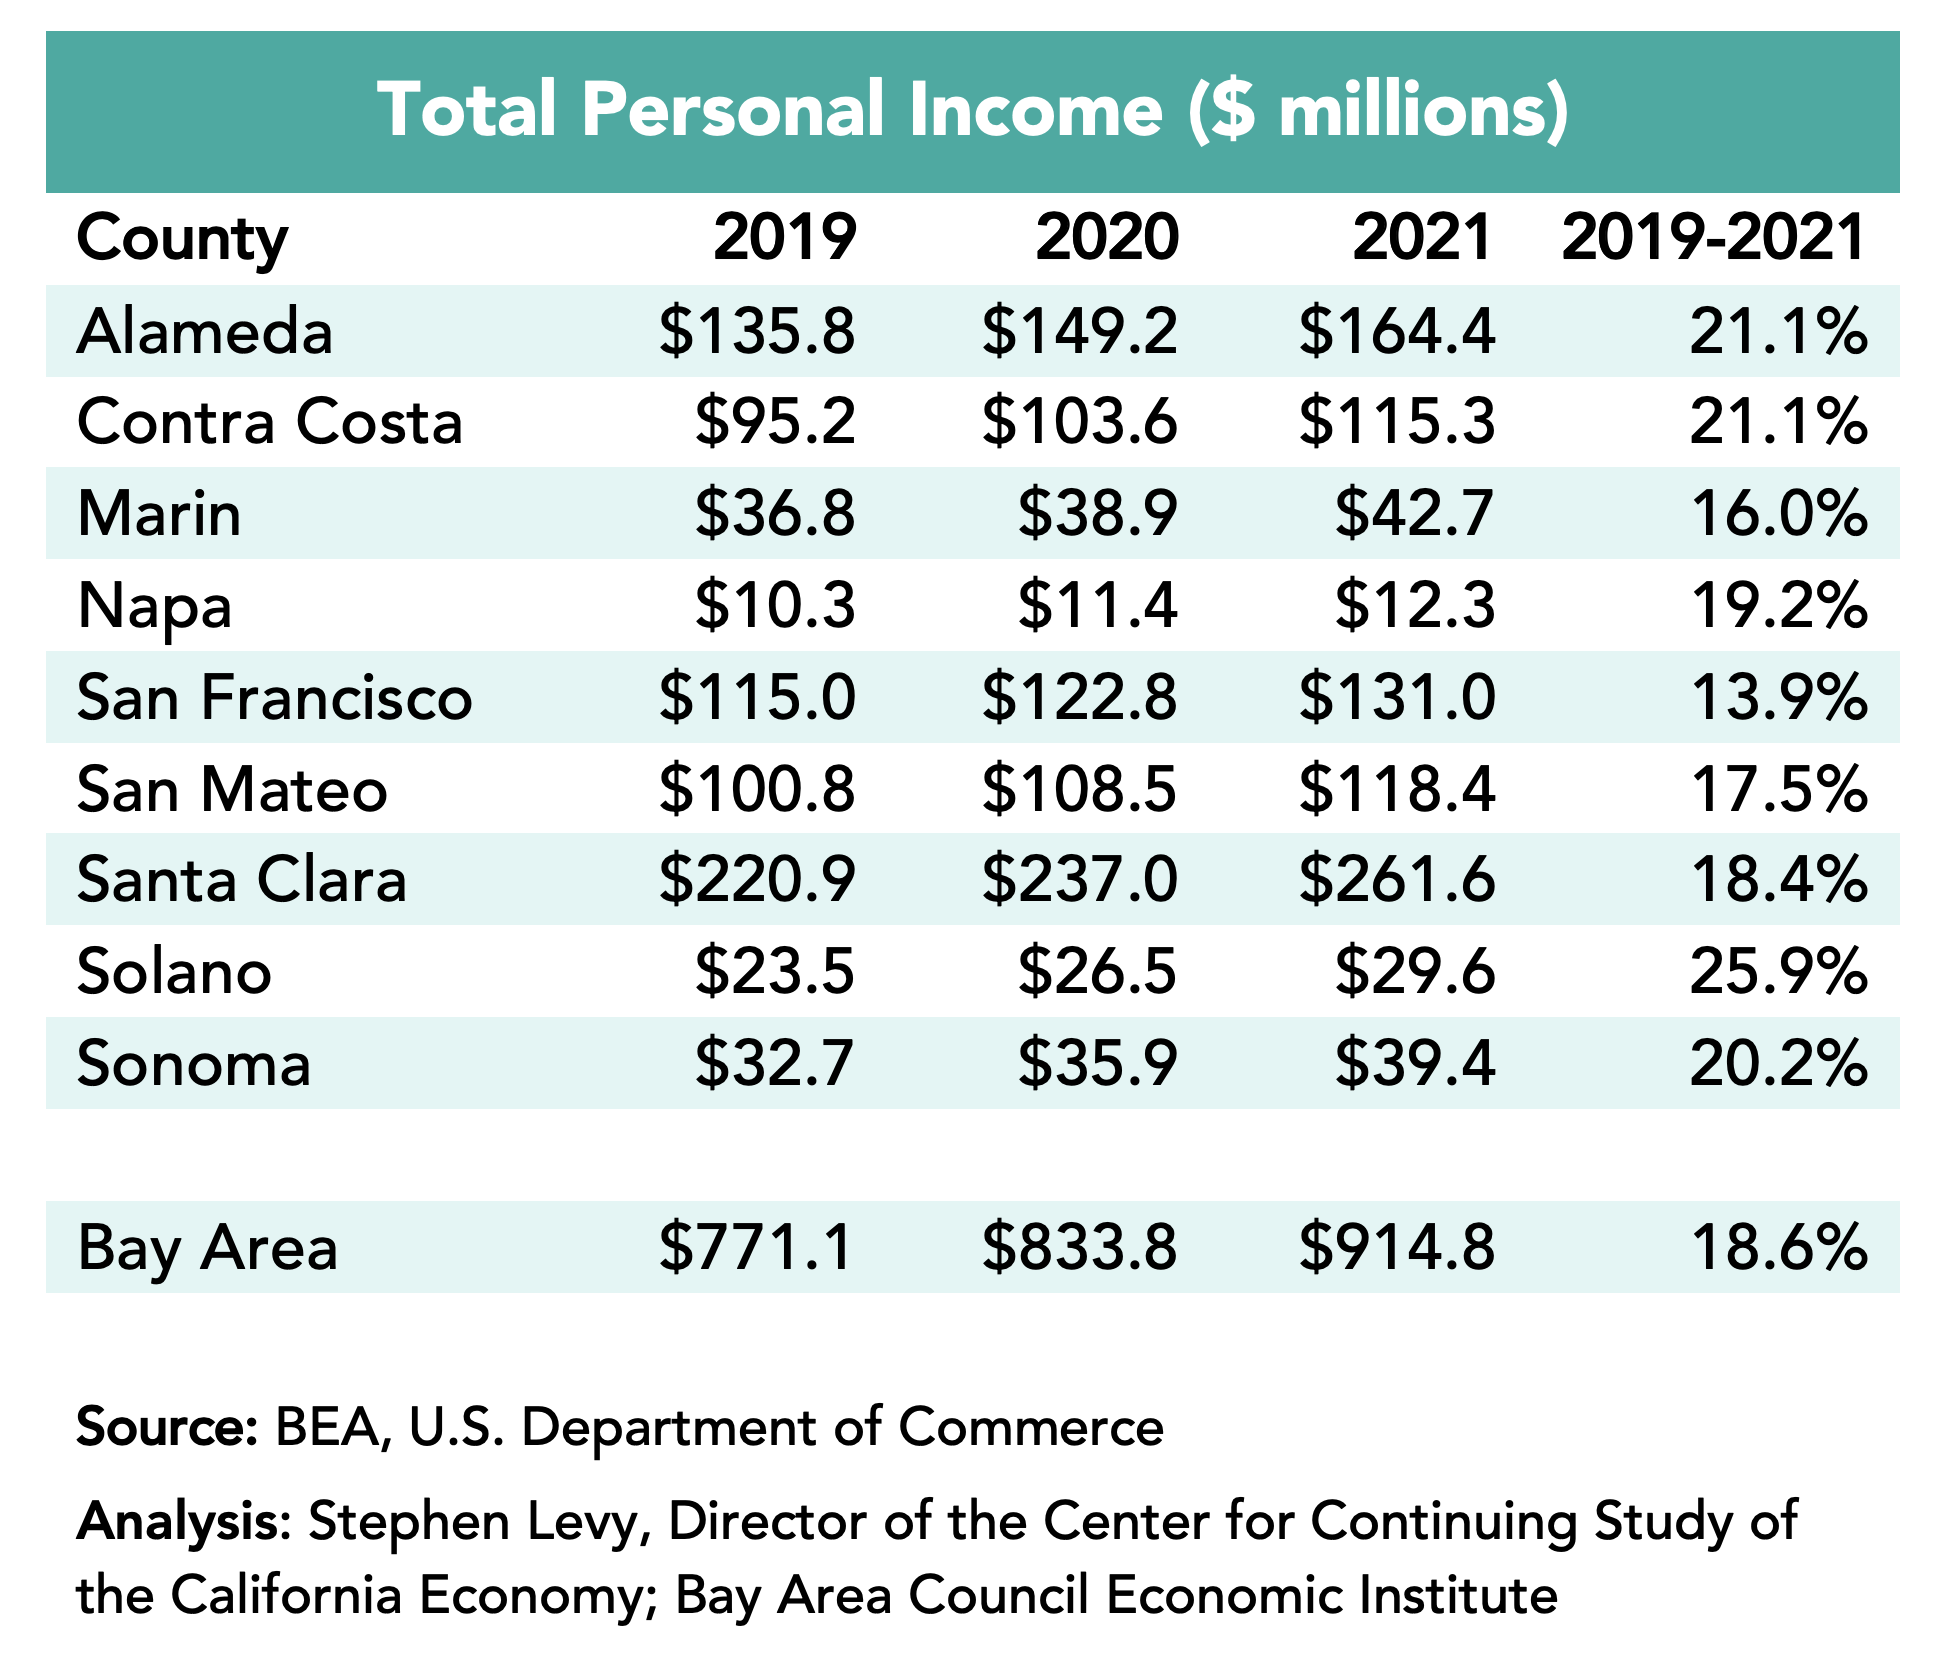
Strong Gains in Income in 2021
Total Personal Income rose by 18.6% in the region between 2019 and 2021 according to estimates released by BEA on November 16th this year. And per capita income rose by even more as most counties lost population during this period.
These economic updates are authored by Stephen Levy, Director of the Center for Continuing Study of the California Economy, and a member of the Bay Area Council Economic Institute board.
We scored regions on 15 different datapoints across 5 different metrics: Jobs, People, Investment, EconomicActivity, and Costs. We use Metropolitan Statistical Areas (MSAs) as defined by the U.S. Office of Management and Budget (OMB). The San Francisco-Oakland-BerkeleyMSA includes San Francisco, Alameda, Marin, Contra Costa, and San Mateo counties. The San Jose-Sunnyvale-Santa Clara MSA includes Santa Clara and San Benito counties.
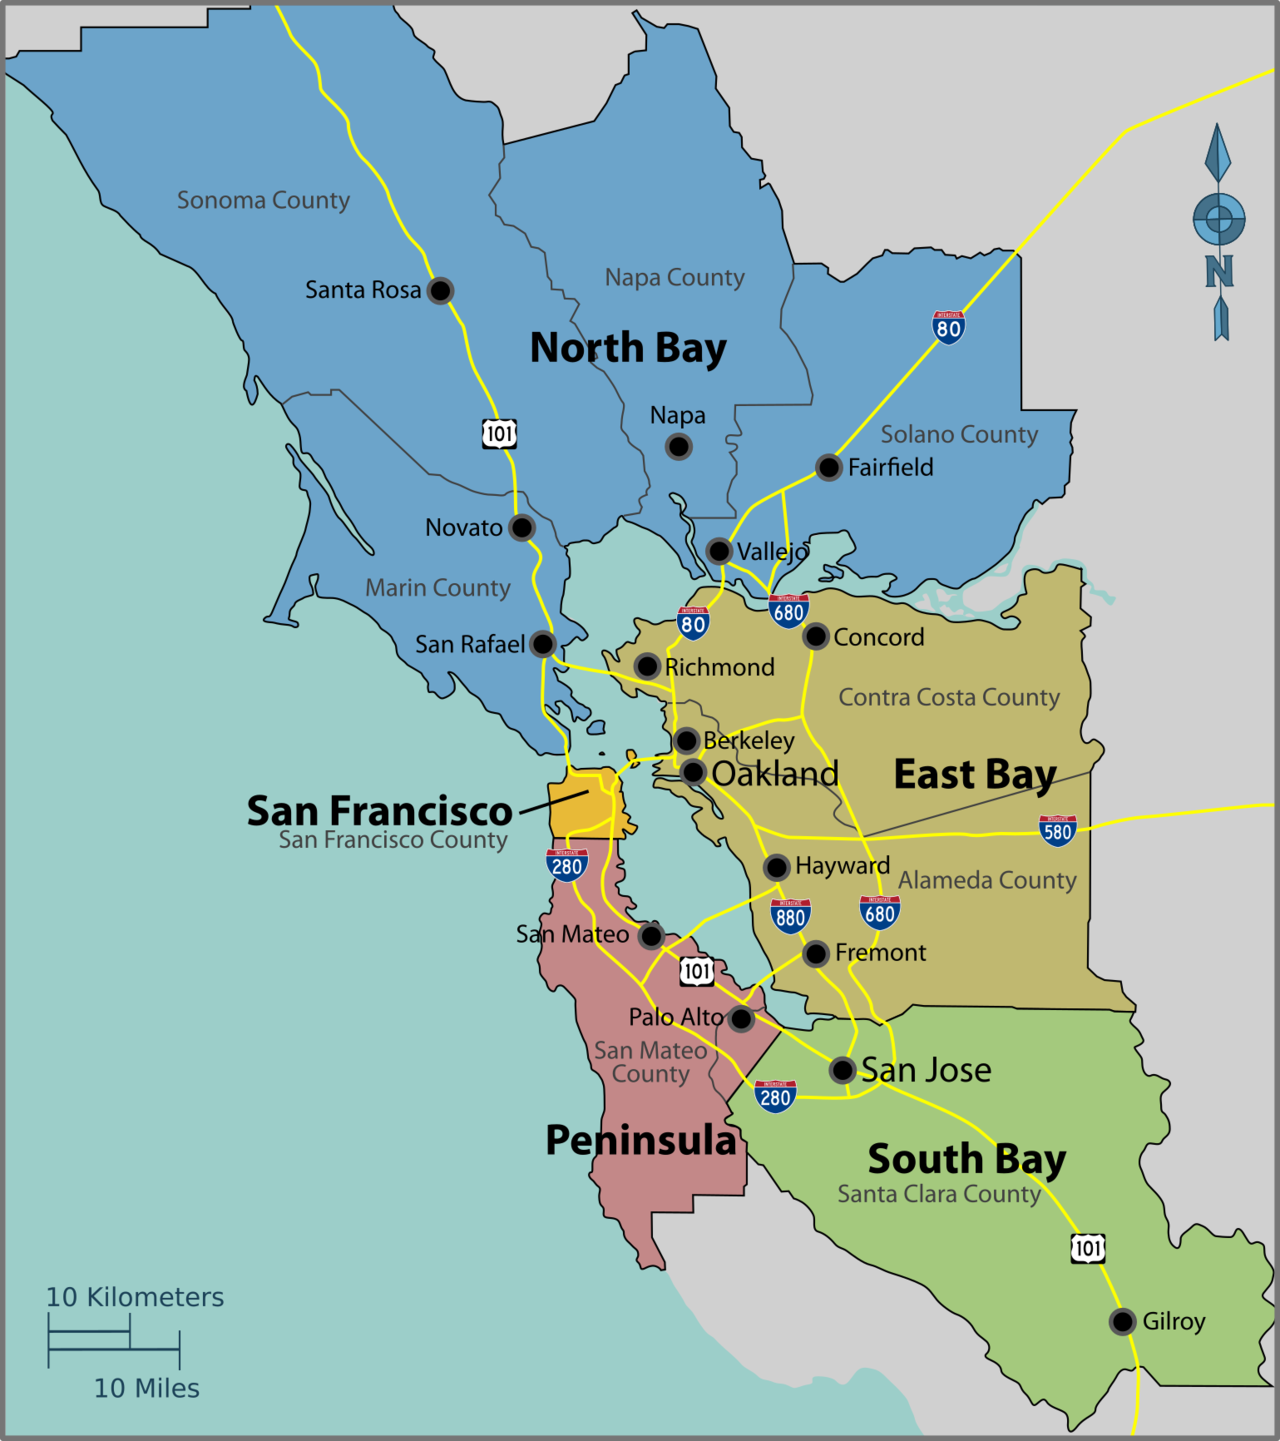
The Bay Area, which is referenced in other parts of our study, refers the the 9-county region (San Francisco, Alameda, Marin, Contra Costa, San Mateo, Santa Clara, Solano, and Sonoma counties).
The 9-county Bay Area
Each region was scored on 15 different metrics across 5 different categories. Percentile ranks were calculated for each metric (wherein 0 is the lowest rank, 100 is the highest), and then averaged across each category. Not all metrics were weighted equally, see the table below for a list of sources and weights.
Austin, Texas ranked first across the 25 regions in our study, scoring an average of 86 (out of 100) across the 15 metrics we evaluated. Within these metrics, it ranked first (100/100) on 6 metrics: job growth, “knowledge worker” growth, population growth, labor force growth, net absorption, and new housing units per capita. It also scored high (second only to Denver) on change in sales tax revenue – experiencing an increase of $33 million (or 13%) from 2019 to 2021. These figures speak to the dramatic resilience and growth Austin, and Texas as a whole, experienced during the pandemic, while coastal cities like San Francisco and New York continue to suffer losses.
Why did we pick the metro areas in our analysis?
To create a list of “peer” regions to the San Francisco metropolitan area, we gathered a list of the 25 largest regional economies, based on the latest GDP numbers available at the time:
Explore charts of every metric that went into the index:
Jobs:
People:
Investment:
Economic Activity:
Affordability:
August 29, 2022
The highlights:
• The Bay Area added 20,000+ jobs in both June and July and led all regions in California with a 5.2% 12-month job increase.
• Bay Area unemployment levels and unemployment rates remained low even with the normal summer uptick and the state unemployment rate, which is seasonally adjusted, fell to a record low of 3.9%.
• In May Bay Area unemployment levels and unemployment rates fell to record lows.
• Housing permits for the first six months of the year surpassed both 2021 and 2019 levels though still well below the region’s new RHNA targets. Air travel levels picked up though Bay Area passenger levels remain well below pre-pandemic levels.
• August 2022 brings major challenges to the global, national and regional economy with the Russian invasion of Ukraine, increases in interest rates amidst continuing high inflation, and the Bay Area challenges of housing, transportation and competitiveness. Positive signs are that inflation may be slowing, Ukrainian grain is hitting the market, COVID cases have started to decline and K-12 schools are in a more normal school year.
• Another challenge, discussed below, is where will employers find workers for continued job growth.
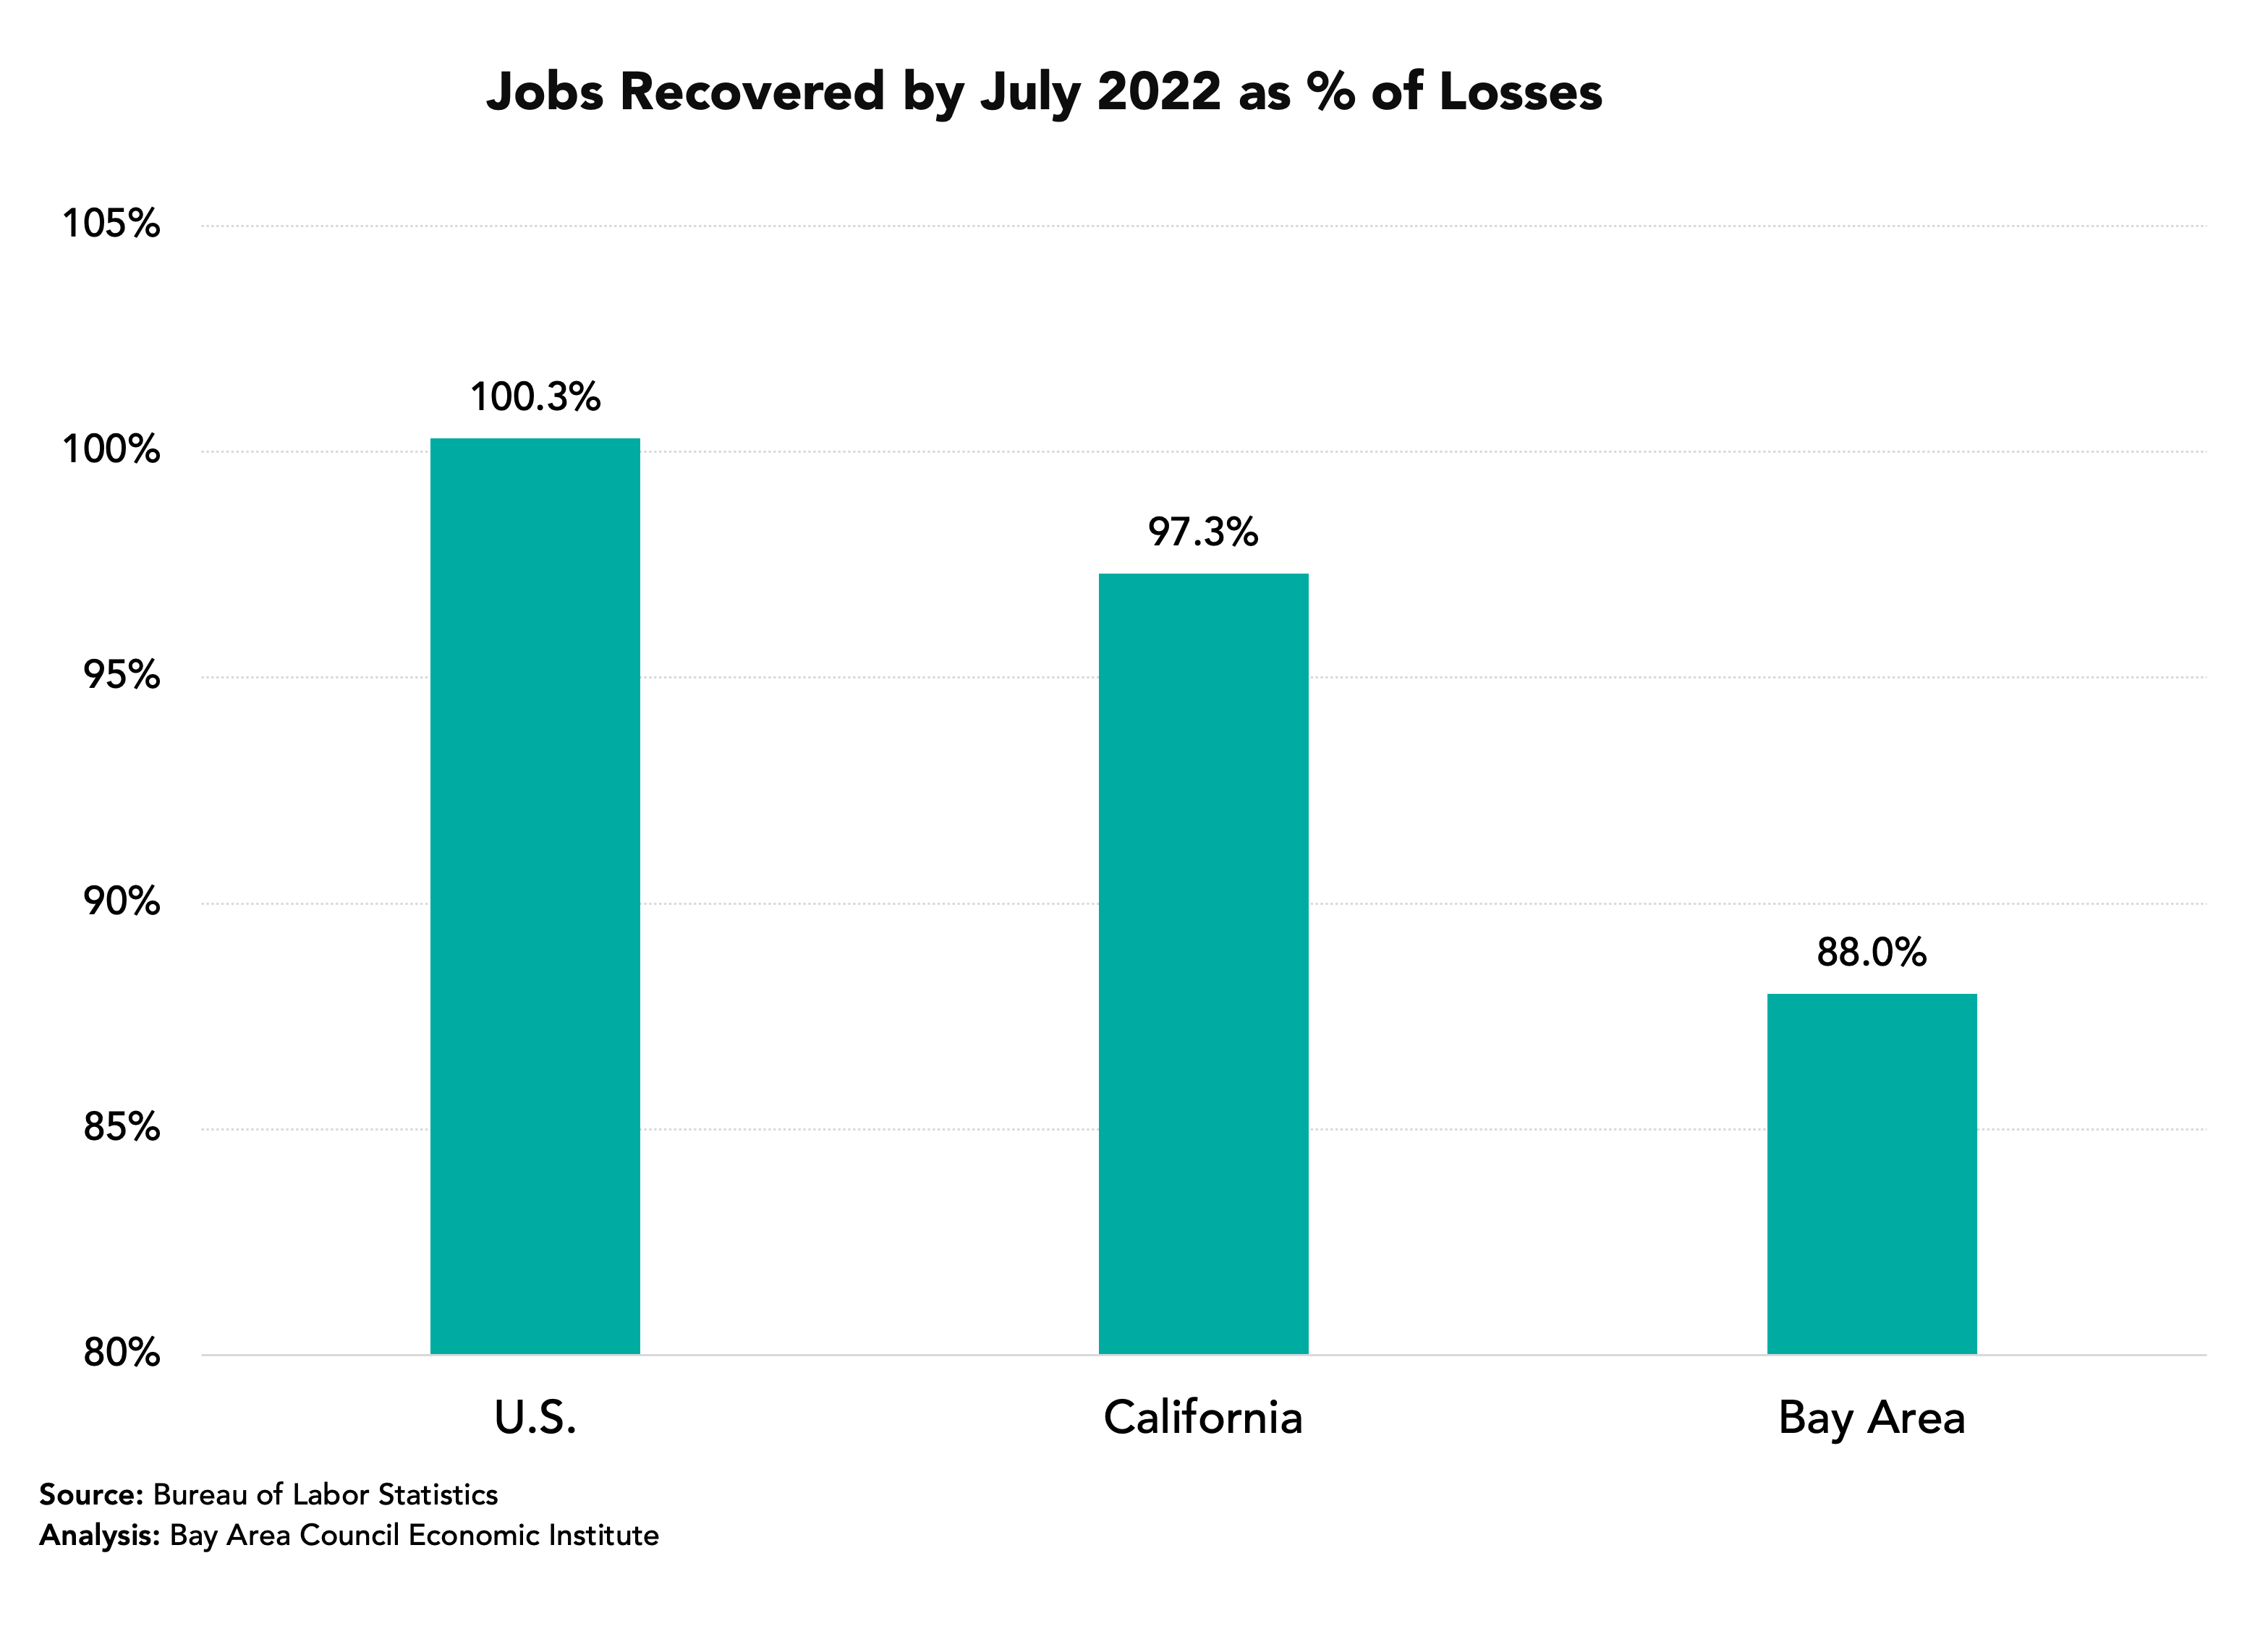
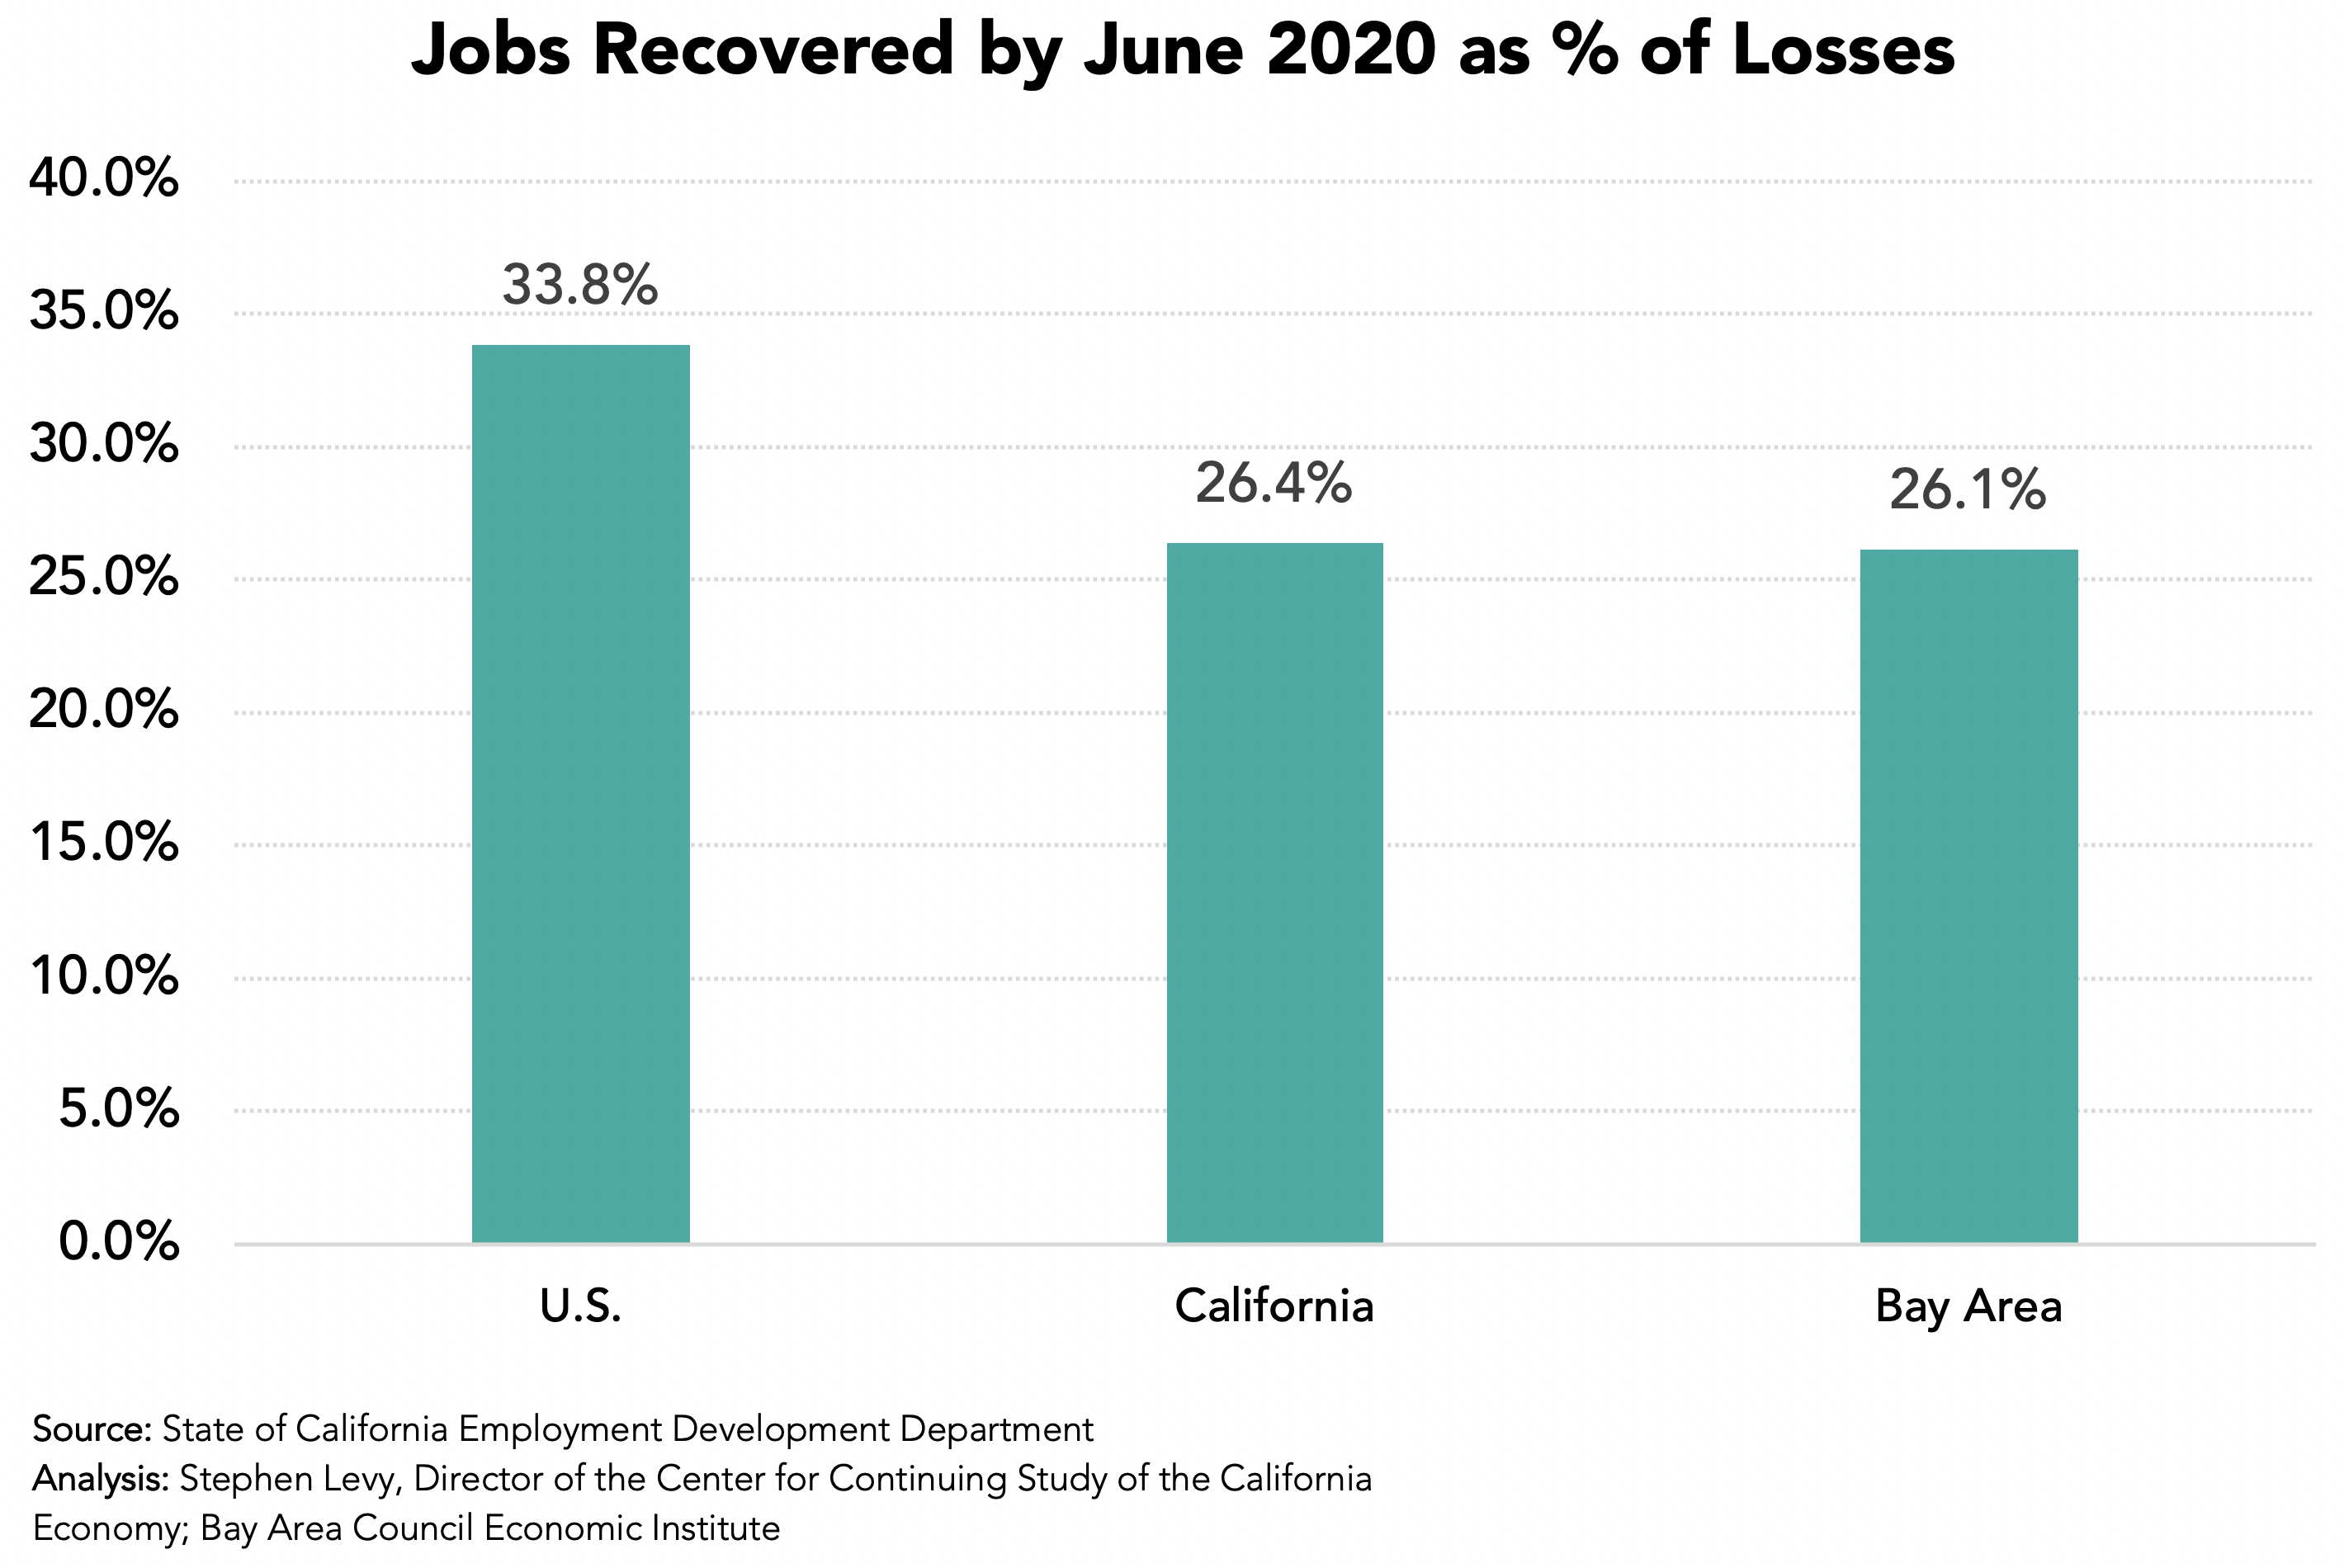
The Bay Area Trails the State and Nation in Payroll Job Recovery but the Gap is Shrinking
This is the chart that gets wide media attention and focuses on our region’s below-average job recovery rate. It is accurate and shows the better U.S. and California data. But look at the next chart to see the Bay Area catching up.
The Bay Area’s 5.2% growth rate topped all the other major economic regions in the state as well as the state and national job growth rate.
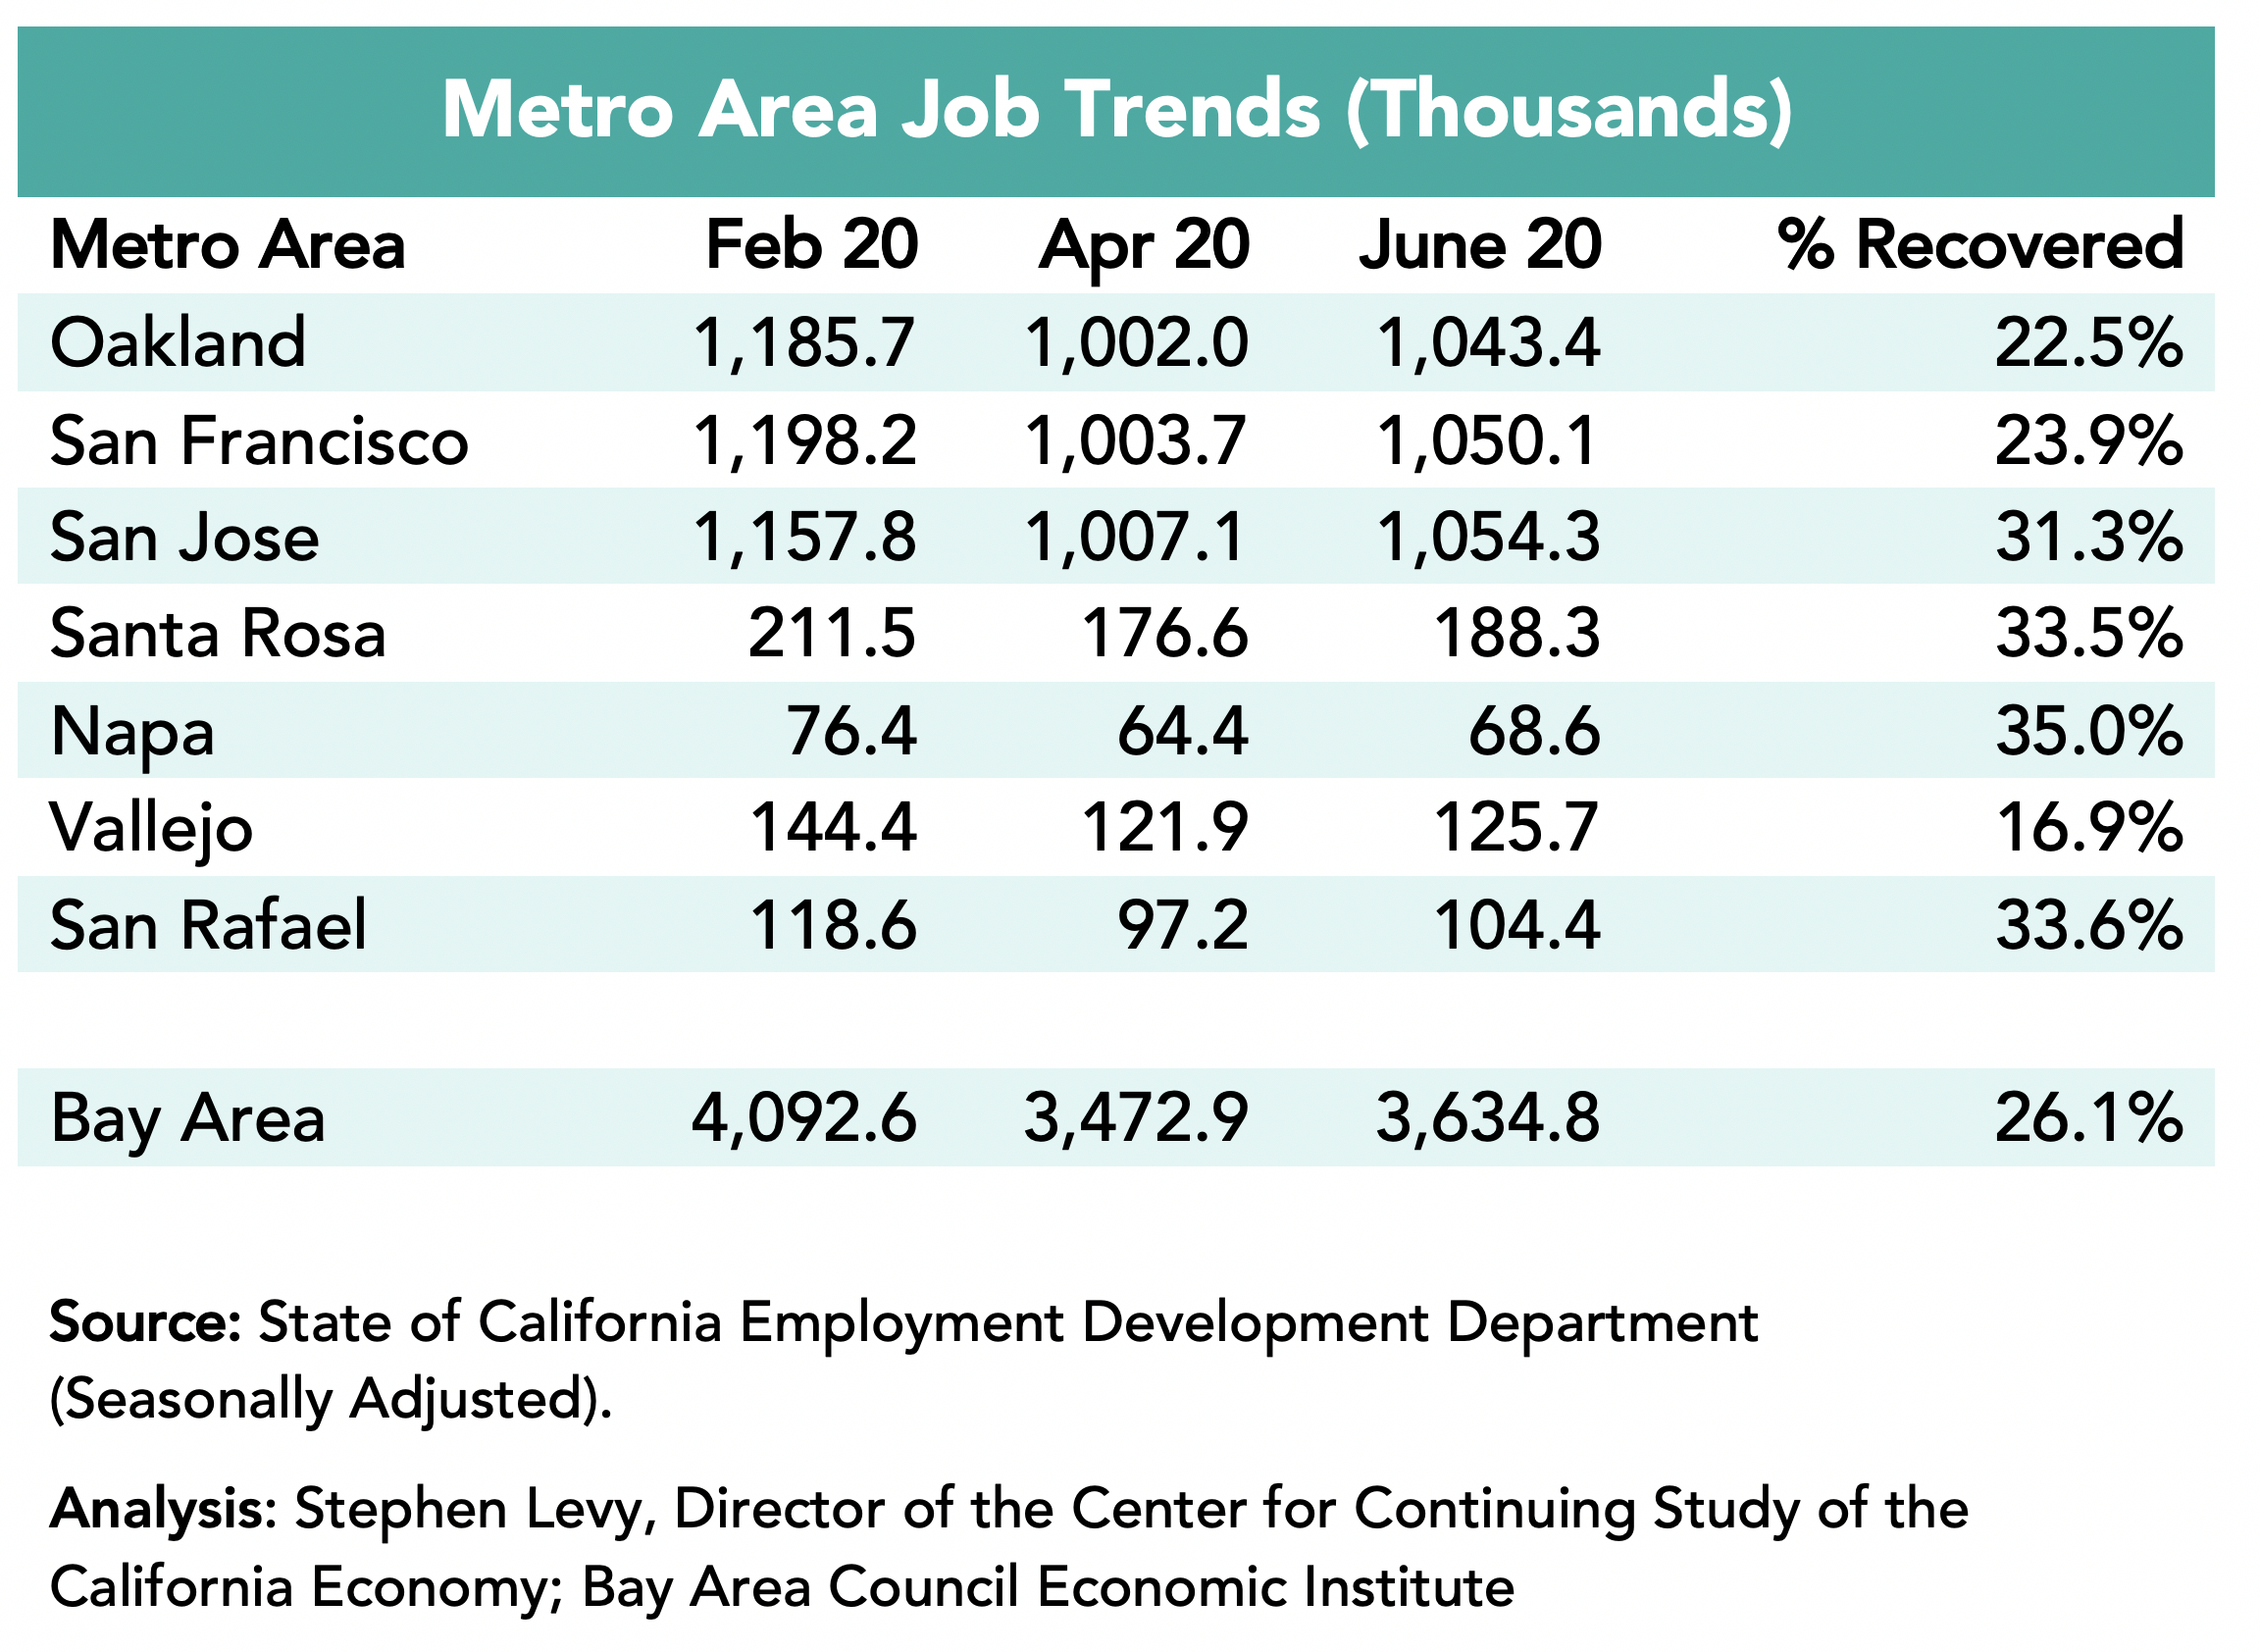
Payroll Job Growth Shows Even Recovery by Metro Area
The Bay Area added 199,200 jobs in the past year (+5.5%) led by a gain of 76,200 in the San Francisco metro area though SF has recovered just 85.8% of the jobs lost between February and April 2020. The San Jose metro area added 62,000 jobs and by July 2022 had recovered 97.0% of the payroll jobs lost between February and April 2020. The Oakland metro area added 44,800 jobs during the past year. Other metro areas have been slower to recover lost jobs.
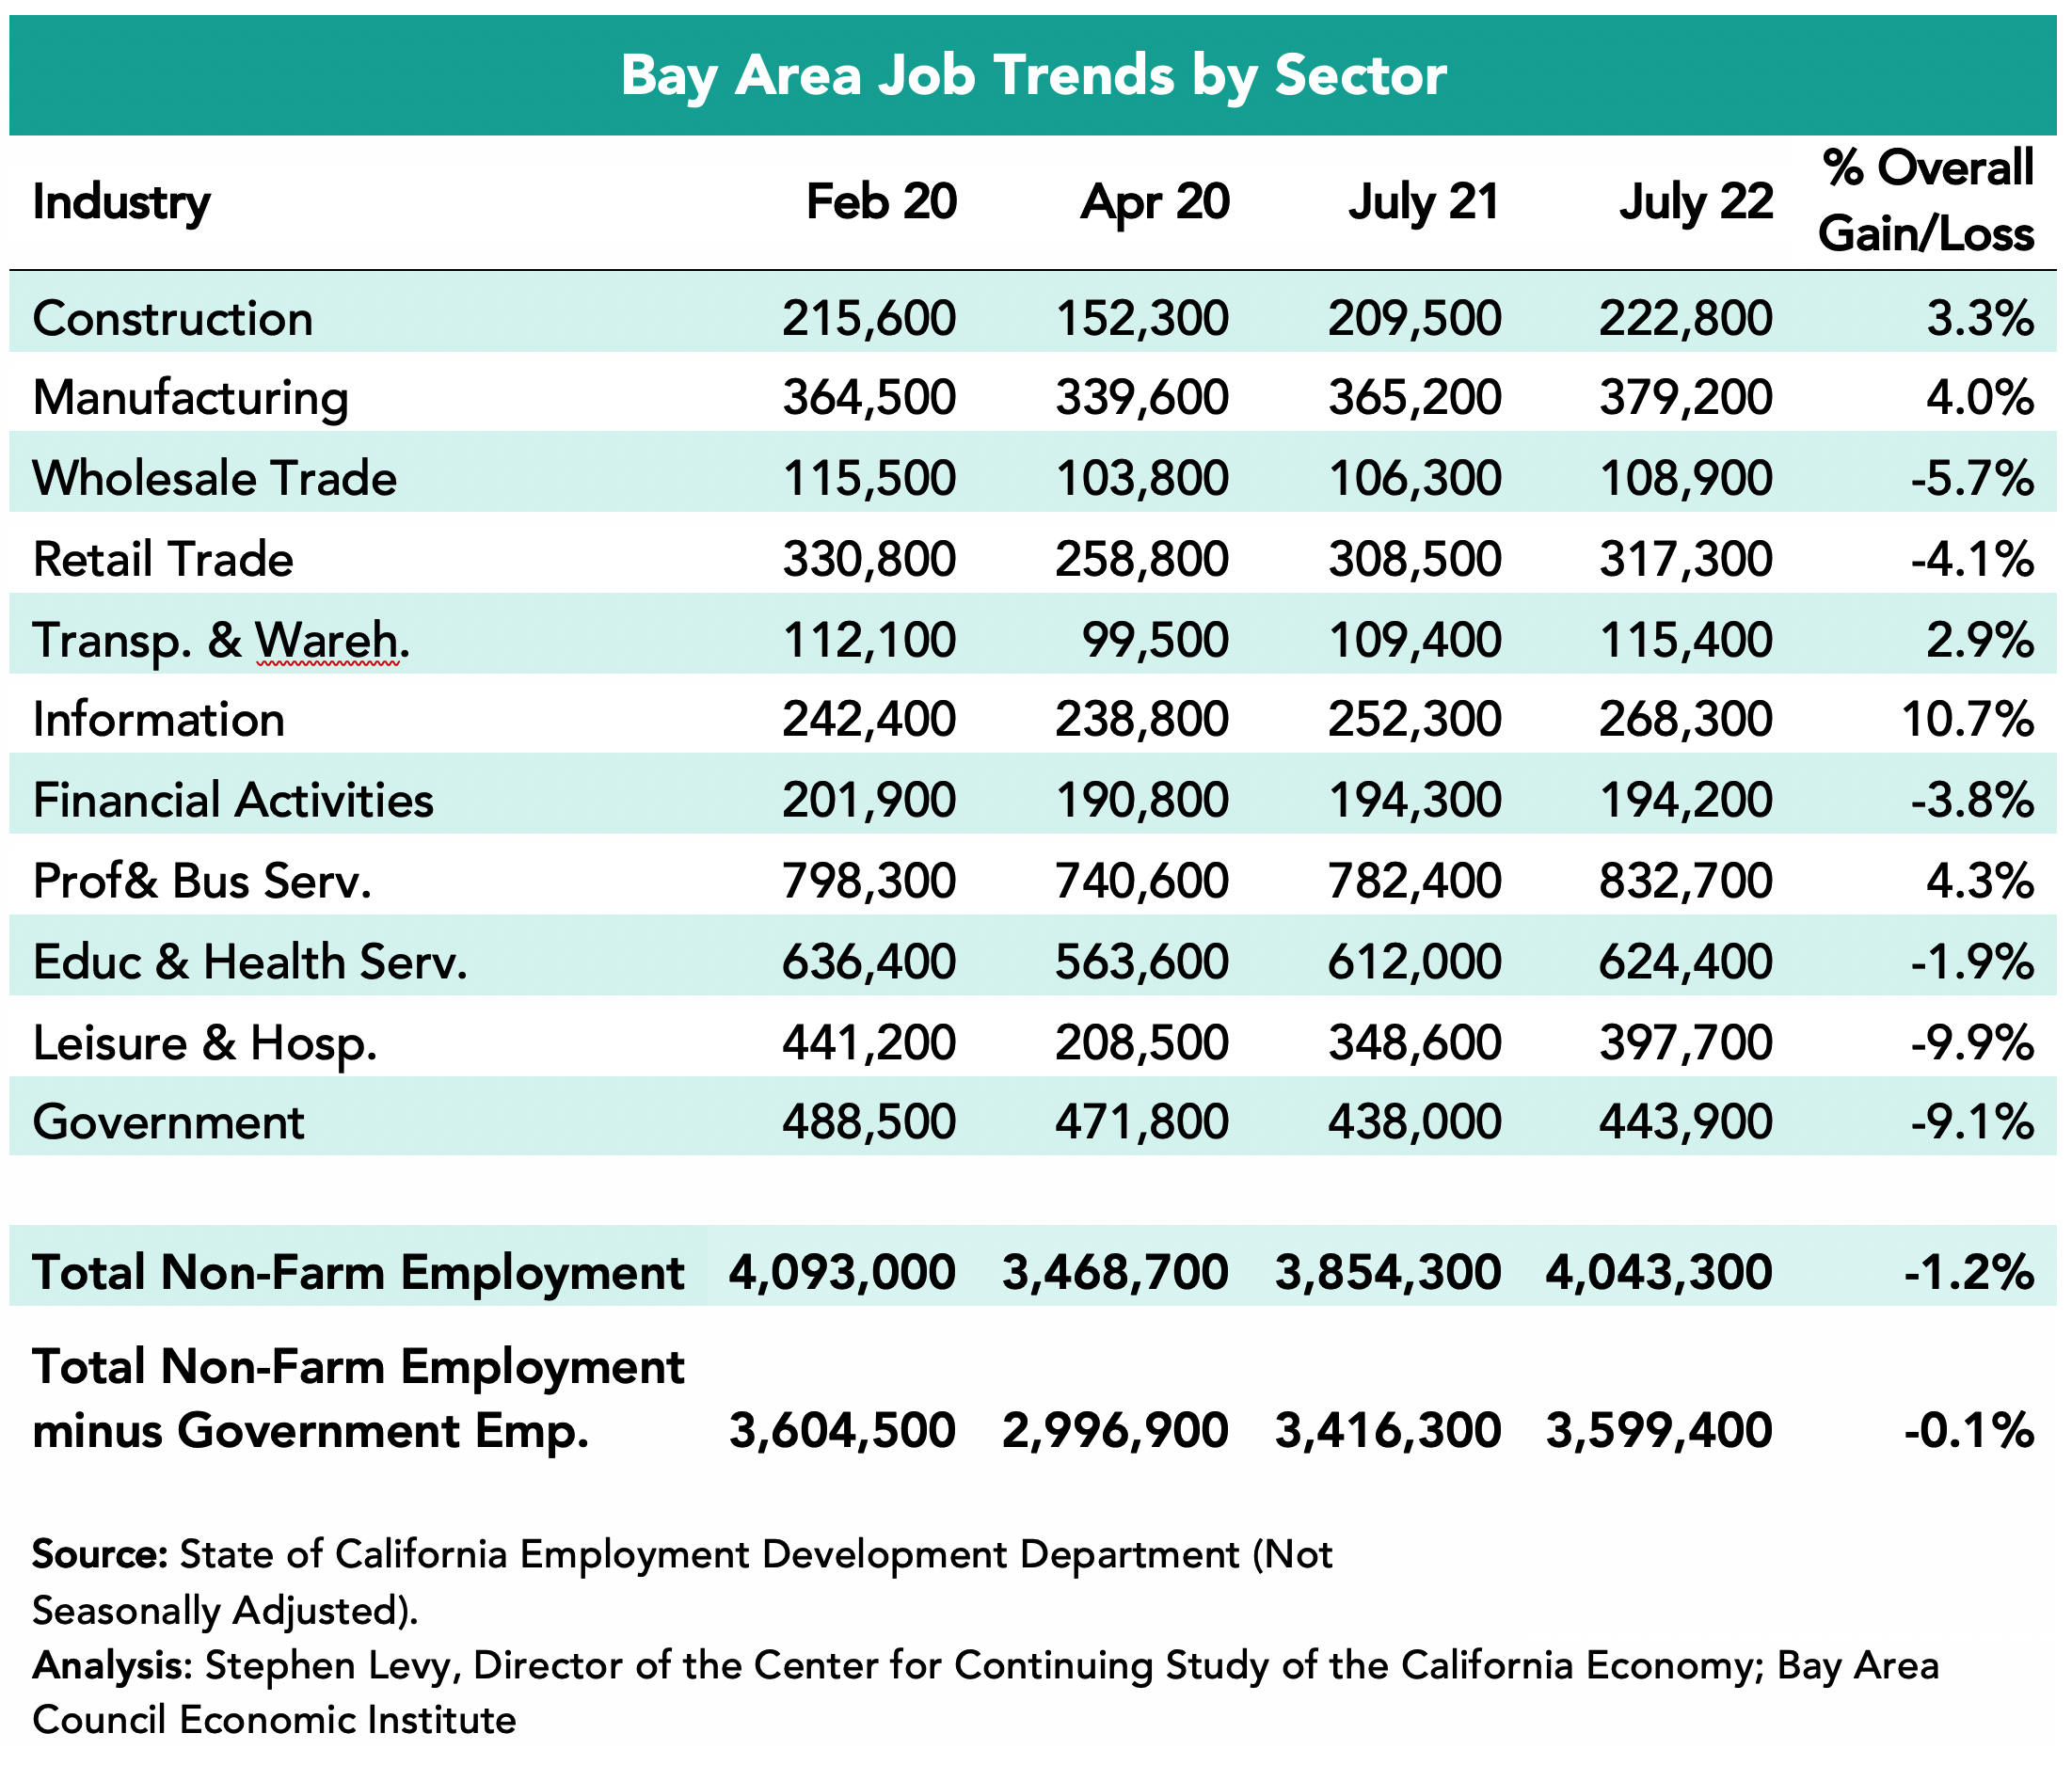
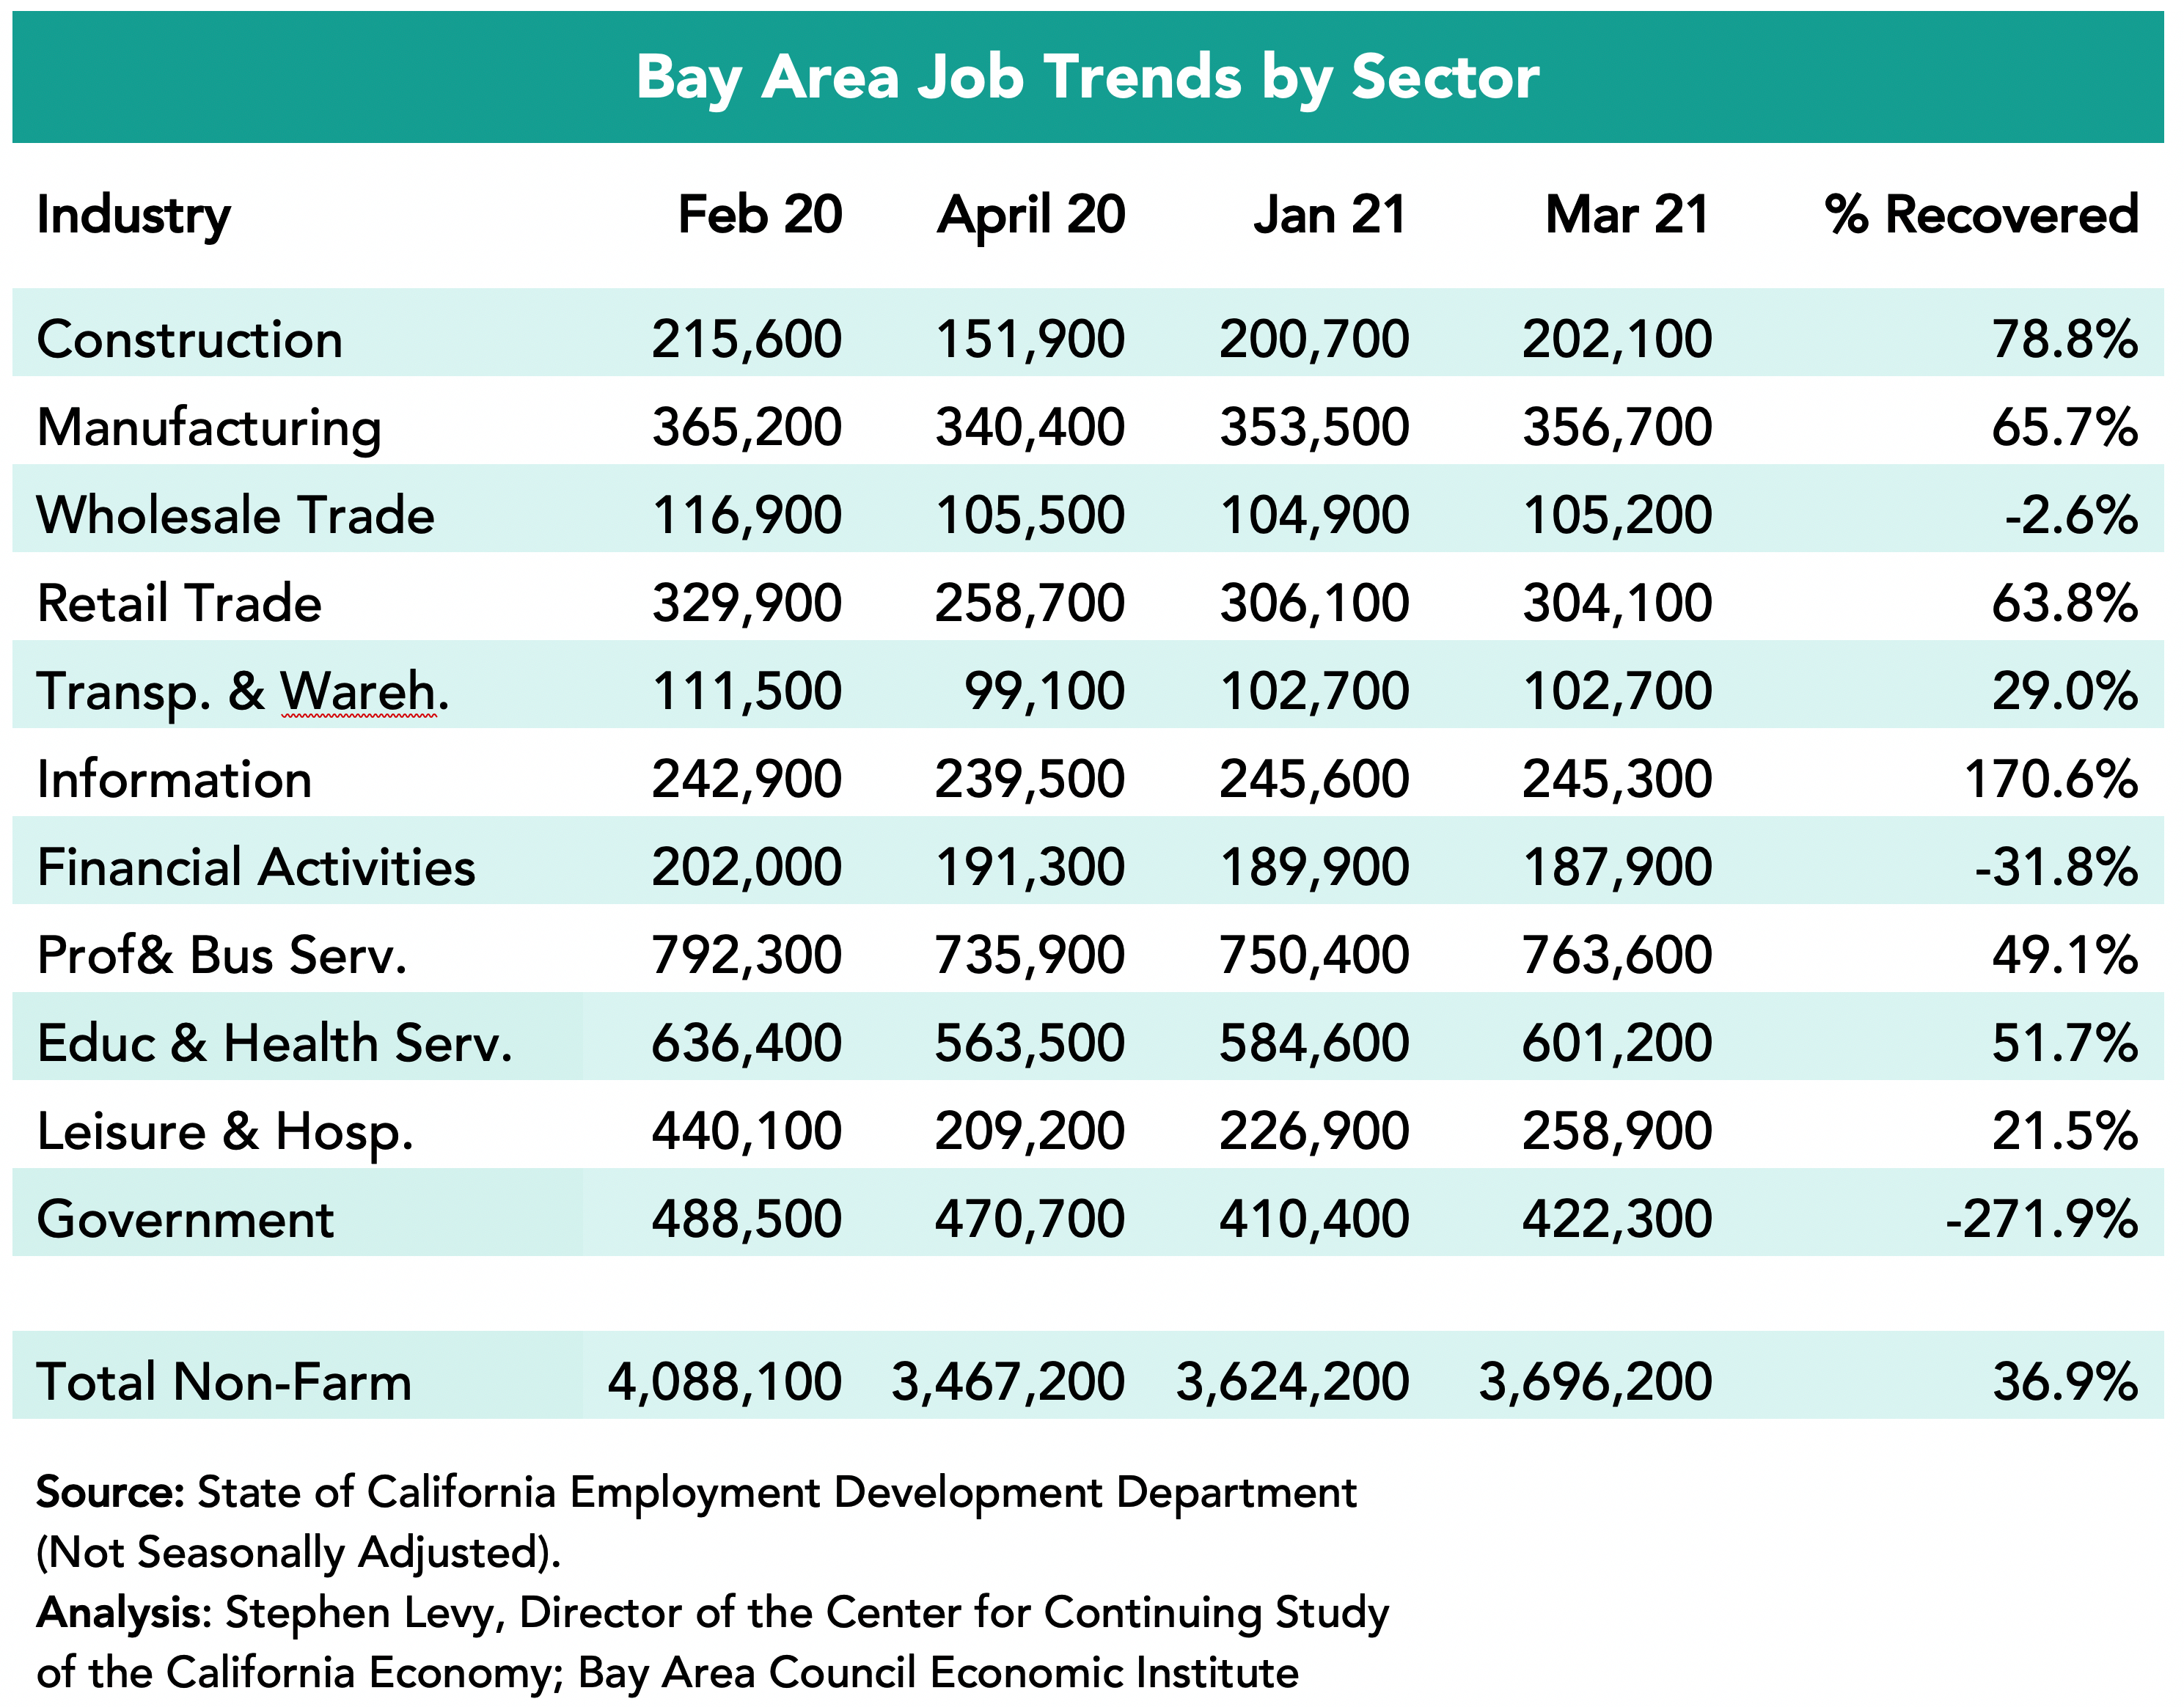
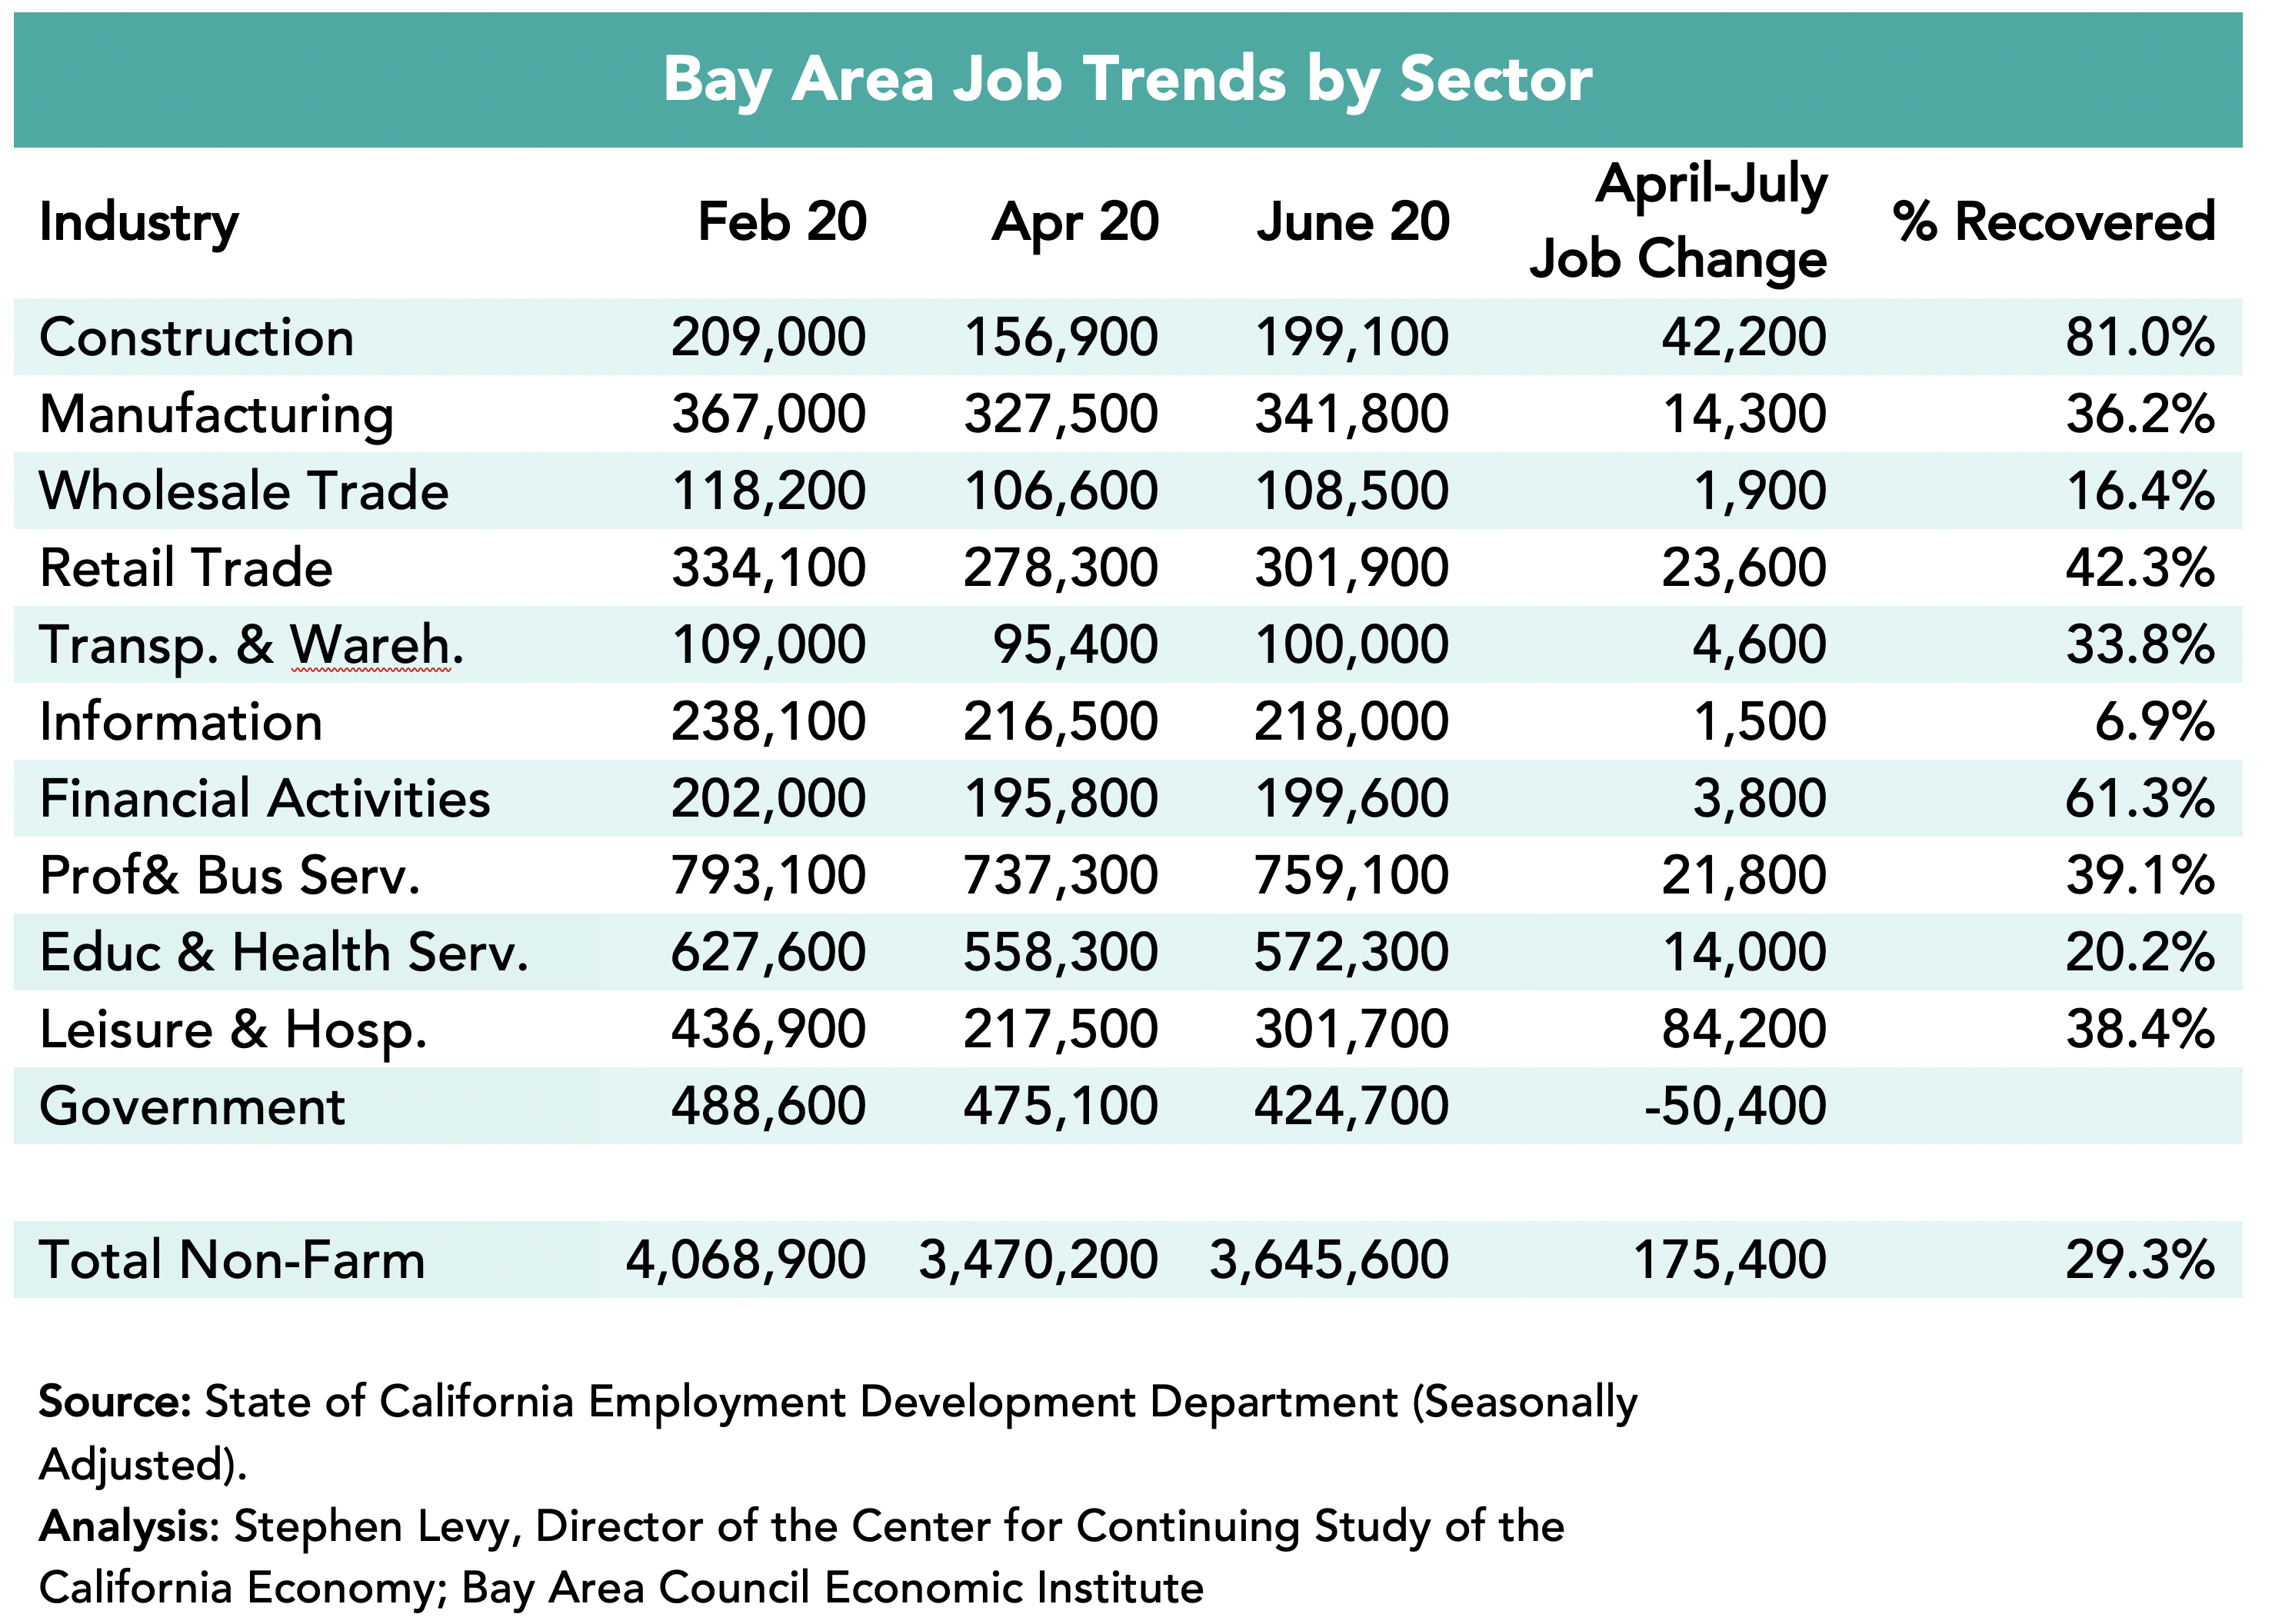
Industries Were Affected Differently
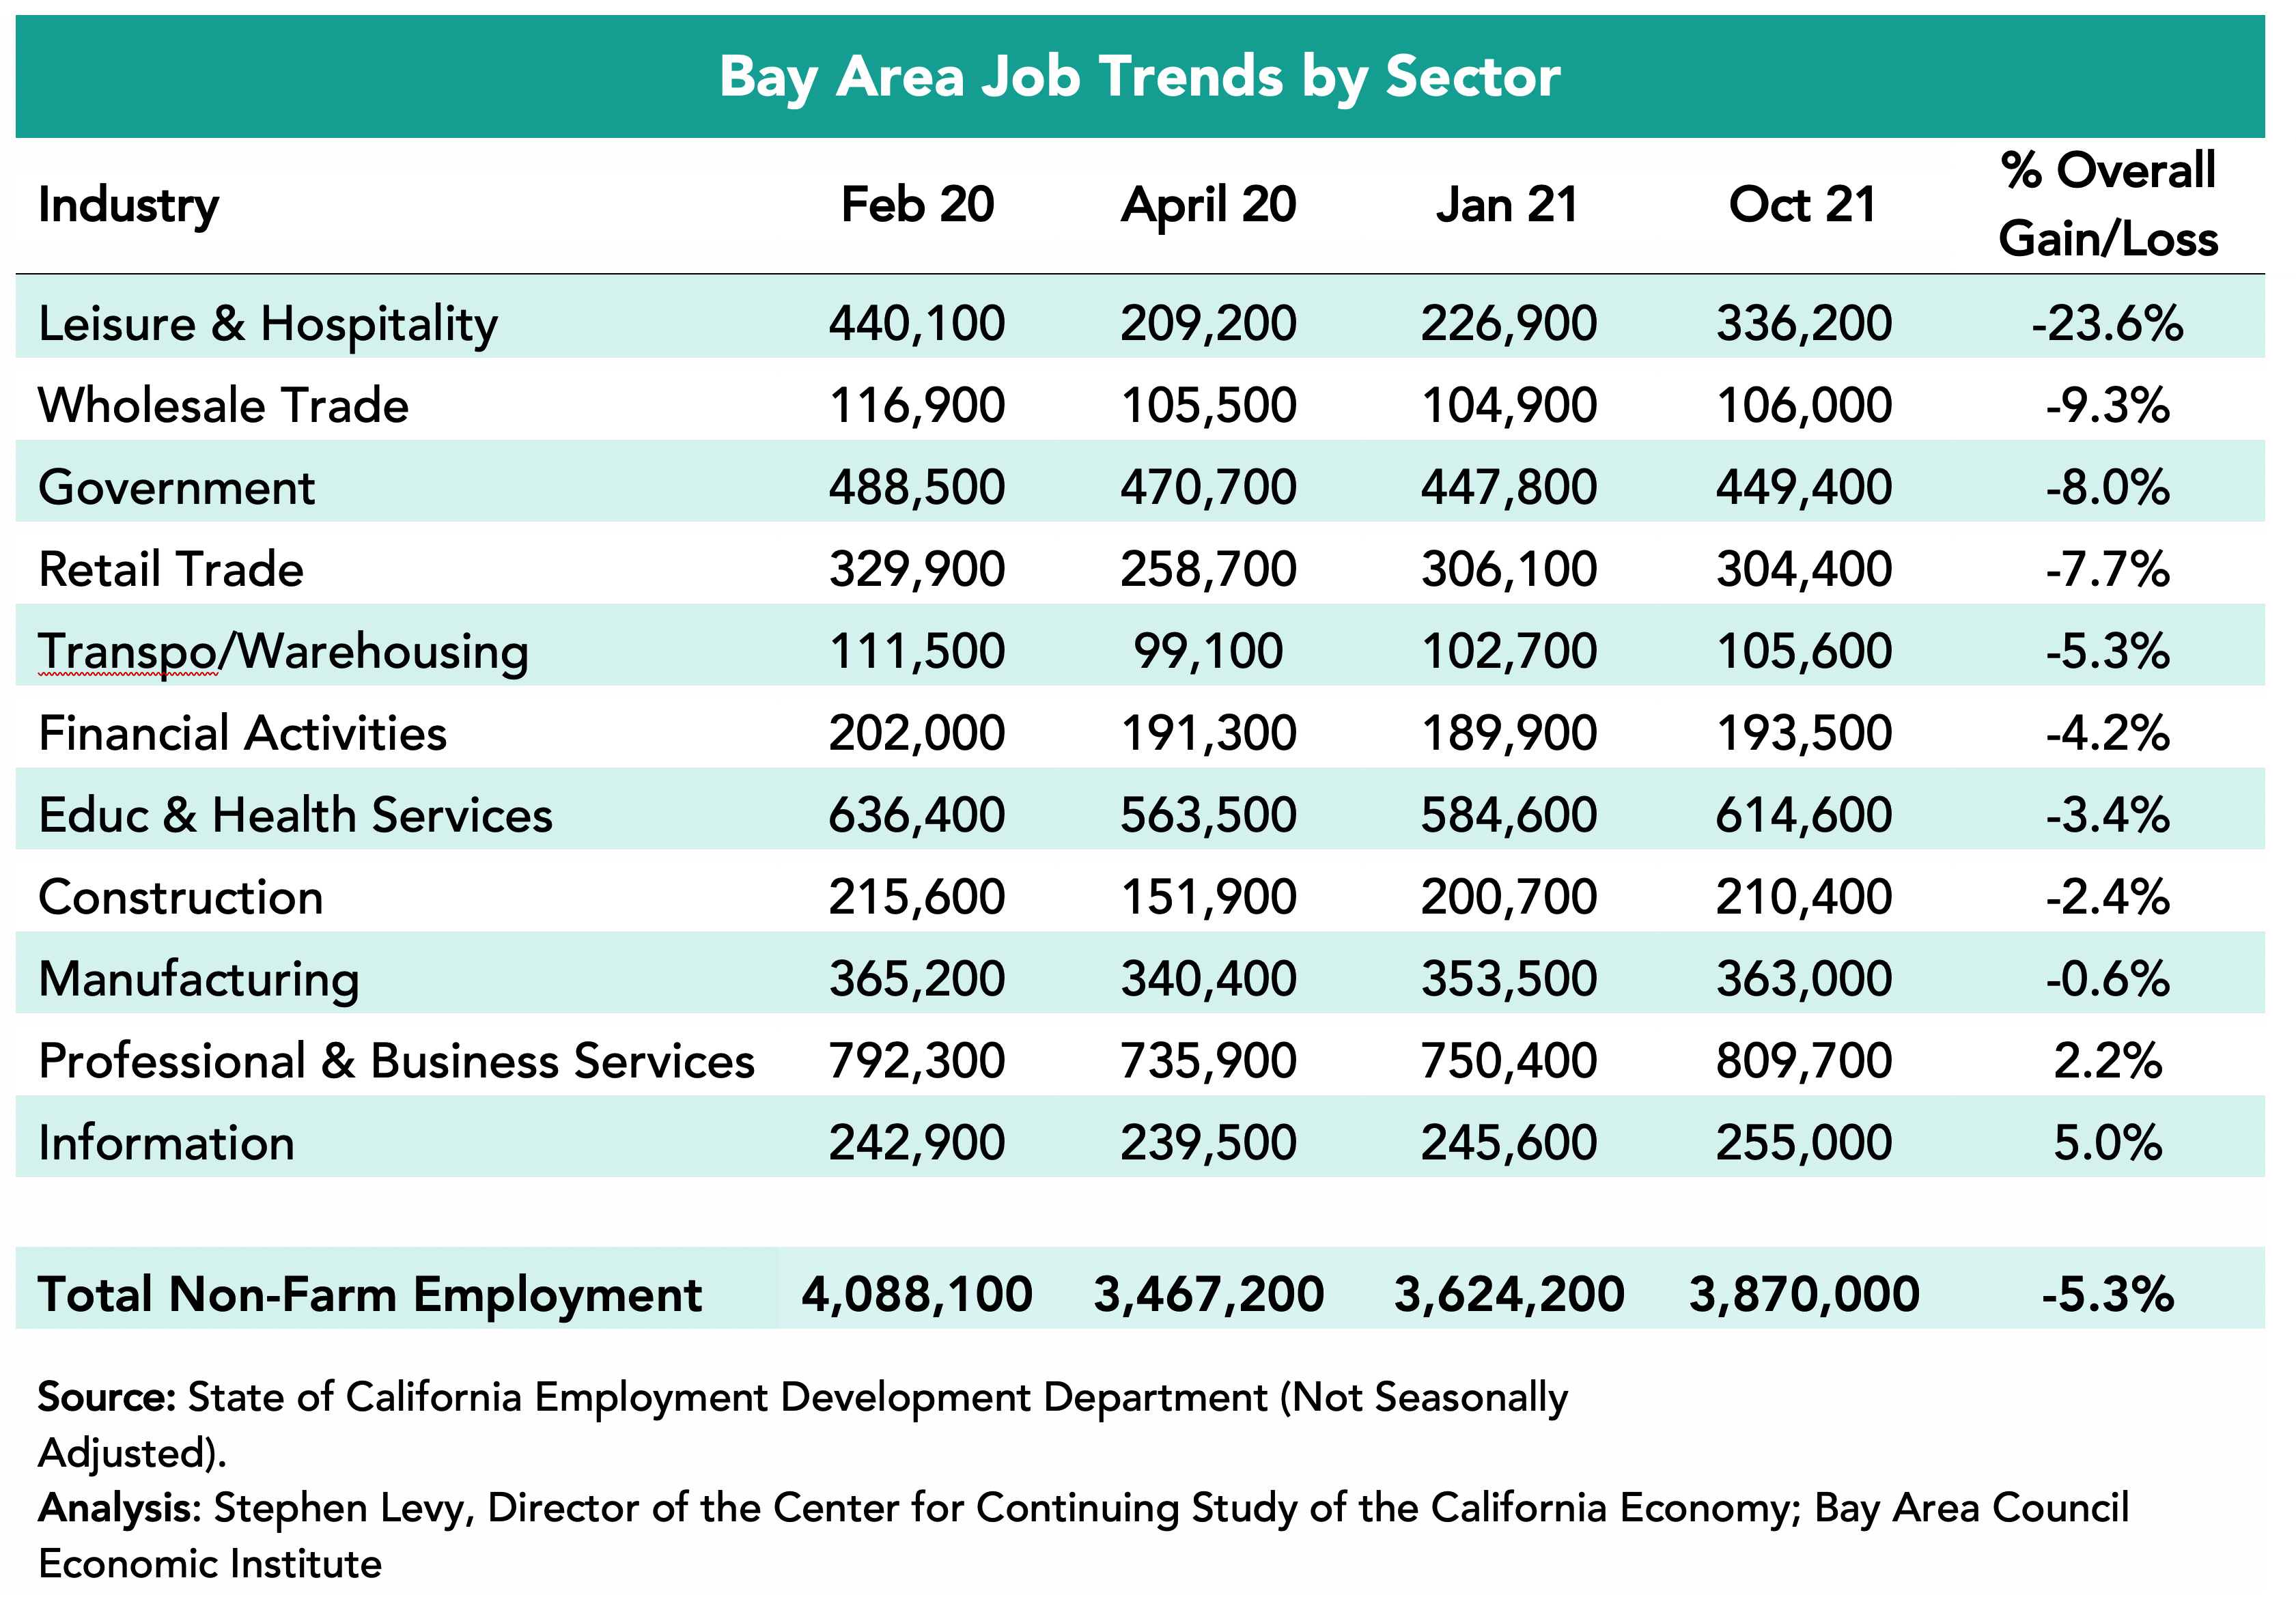
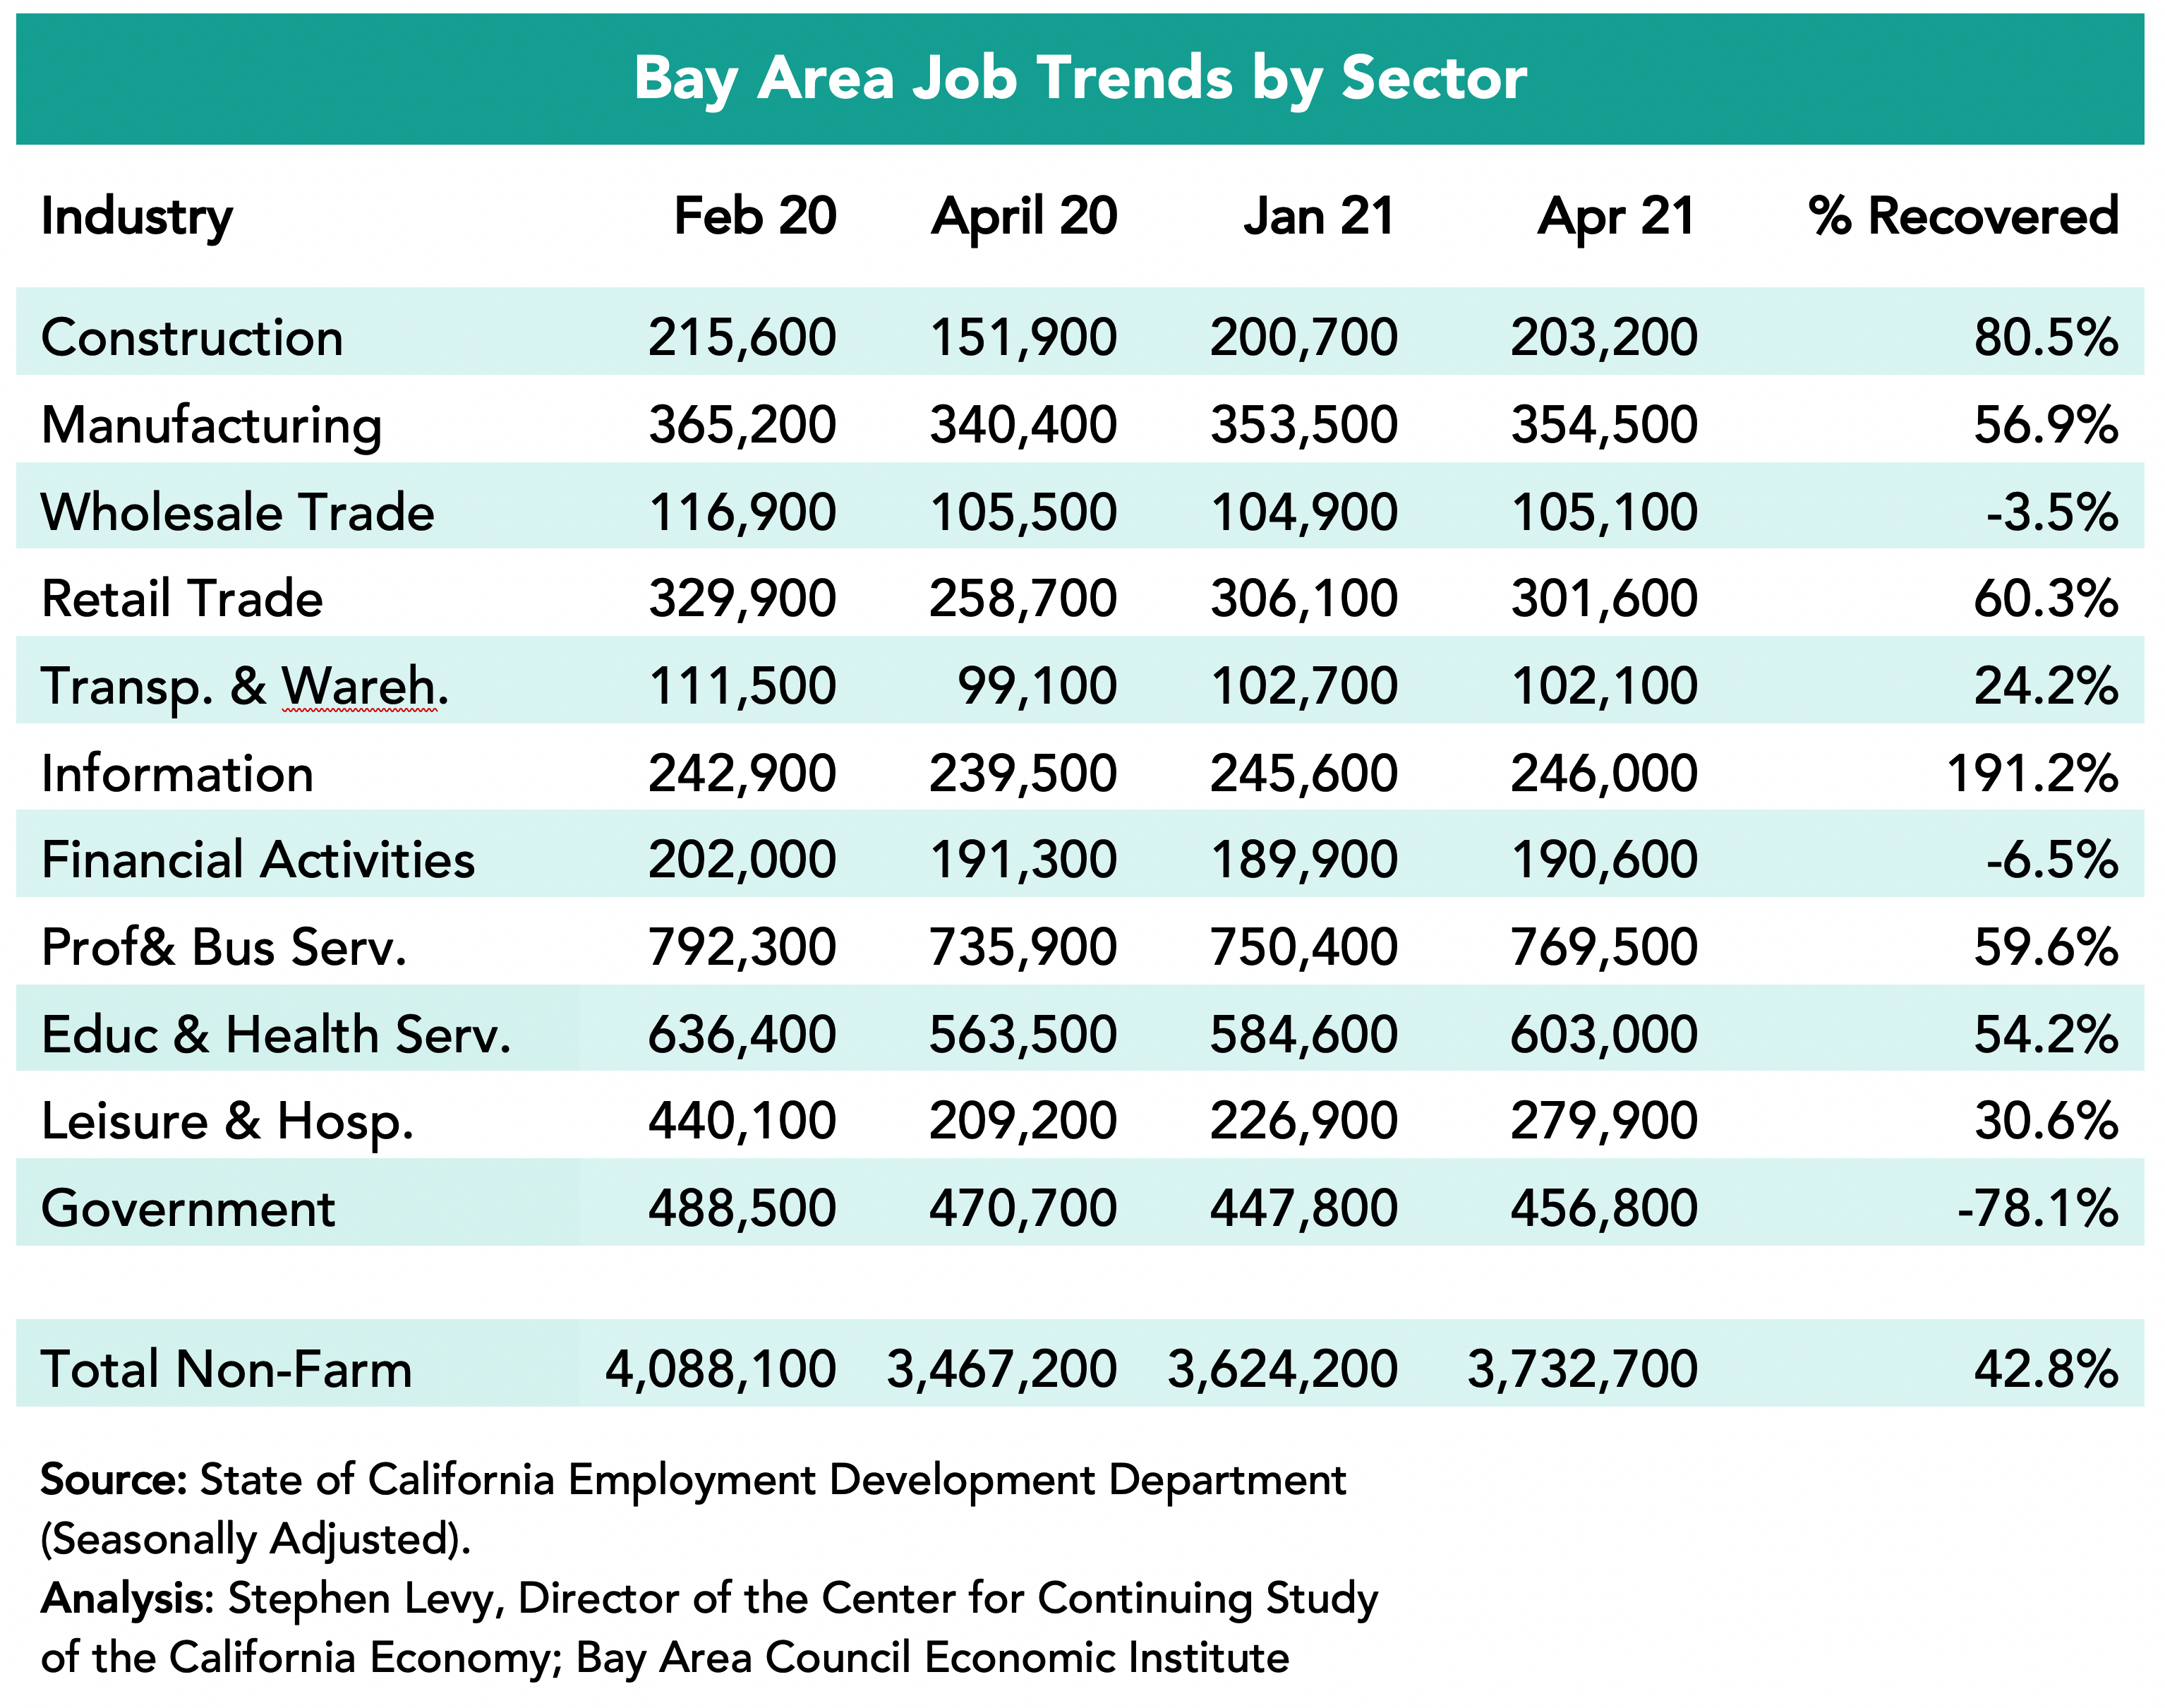
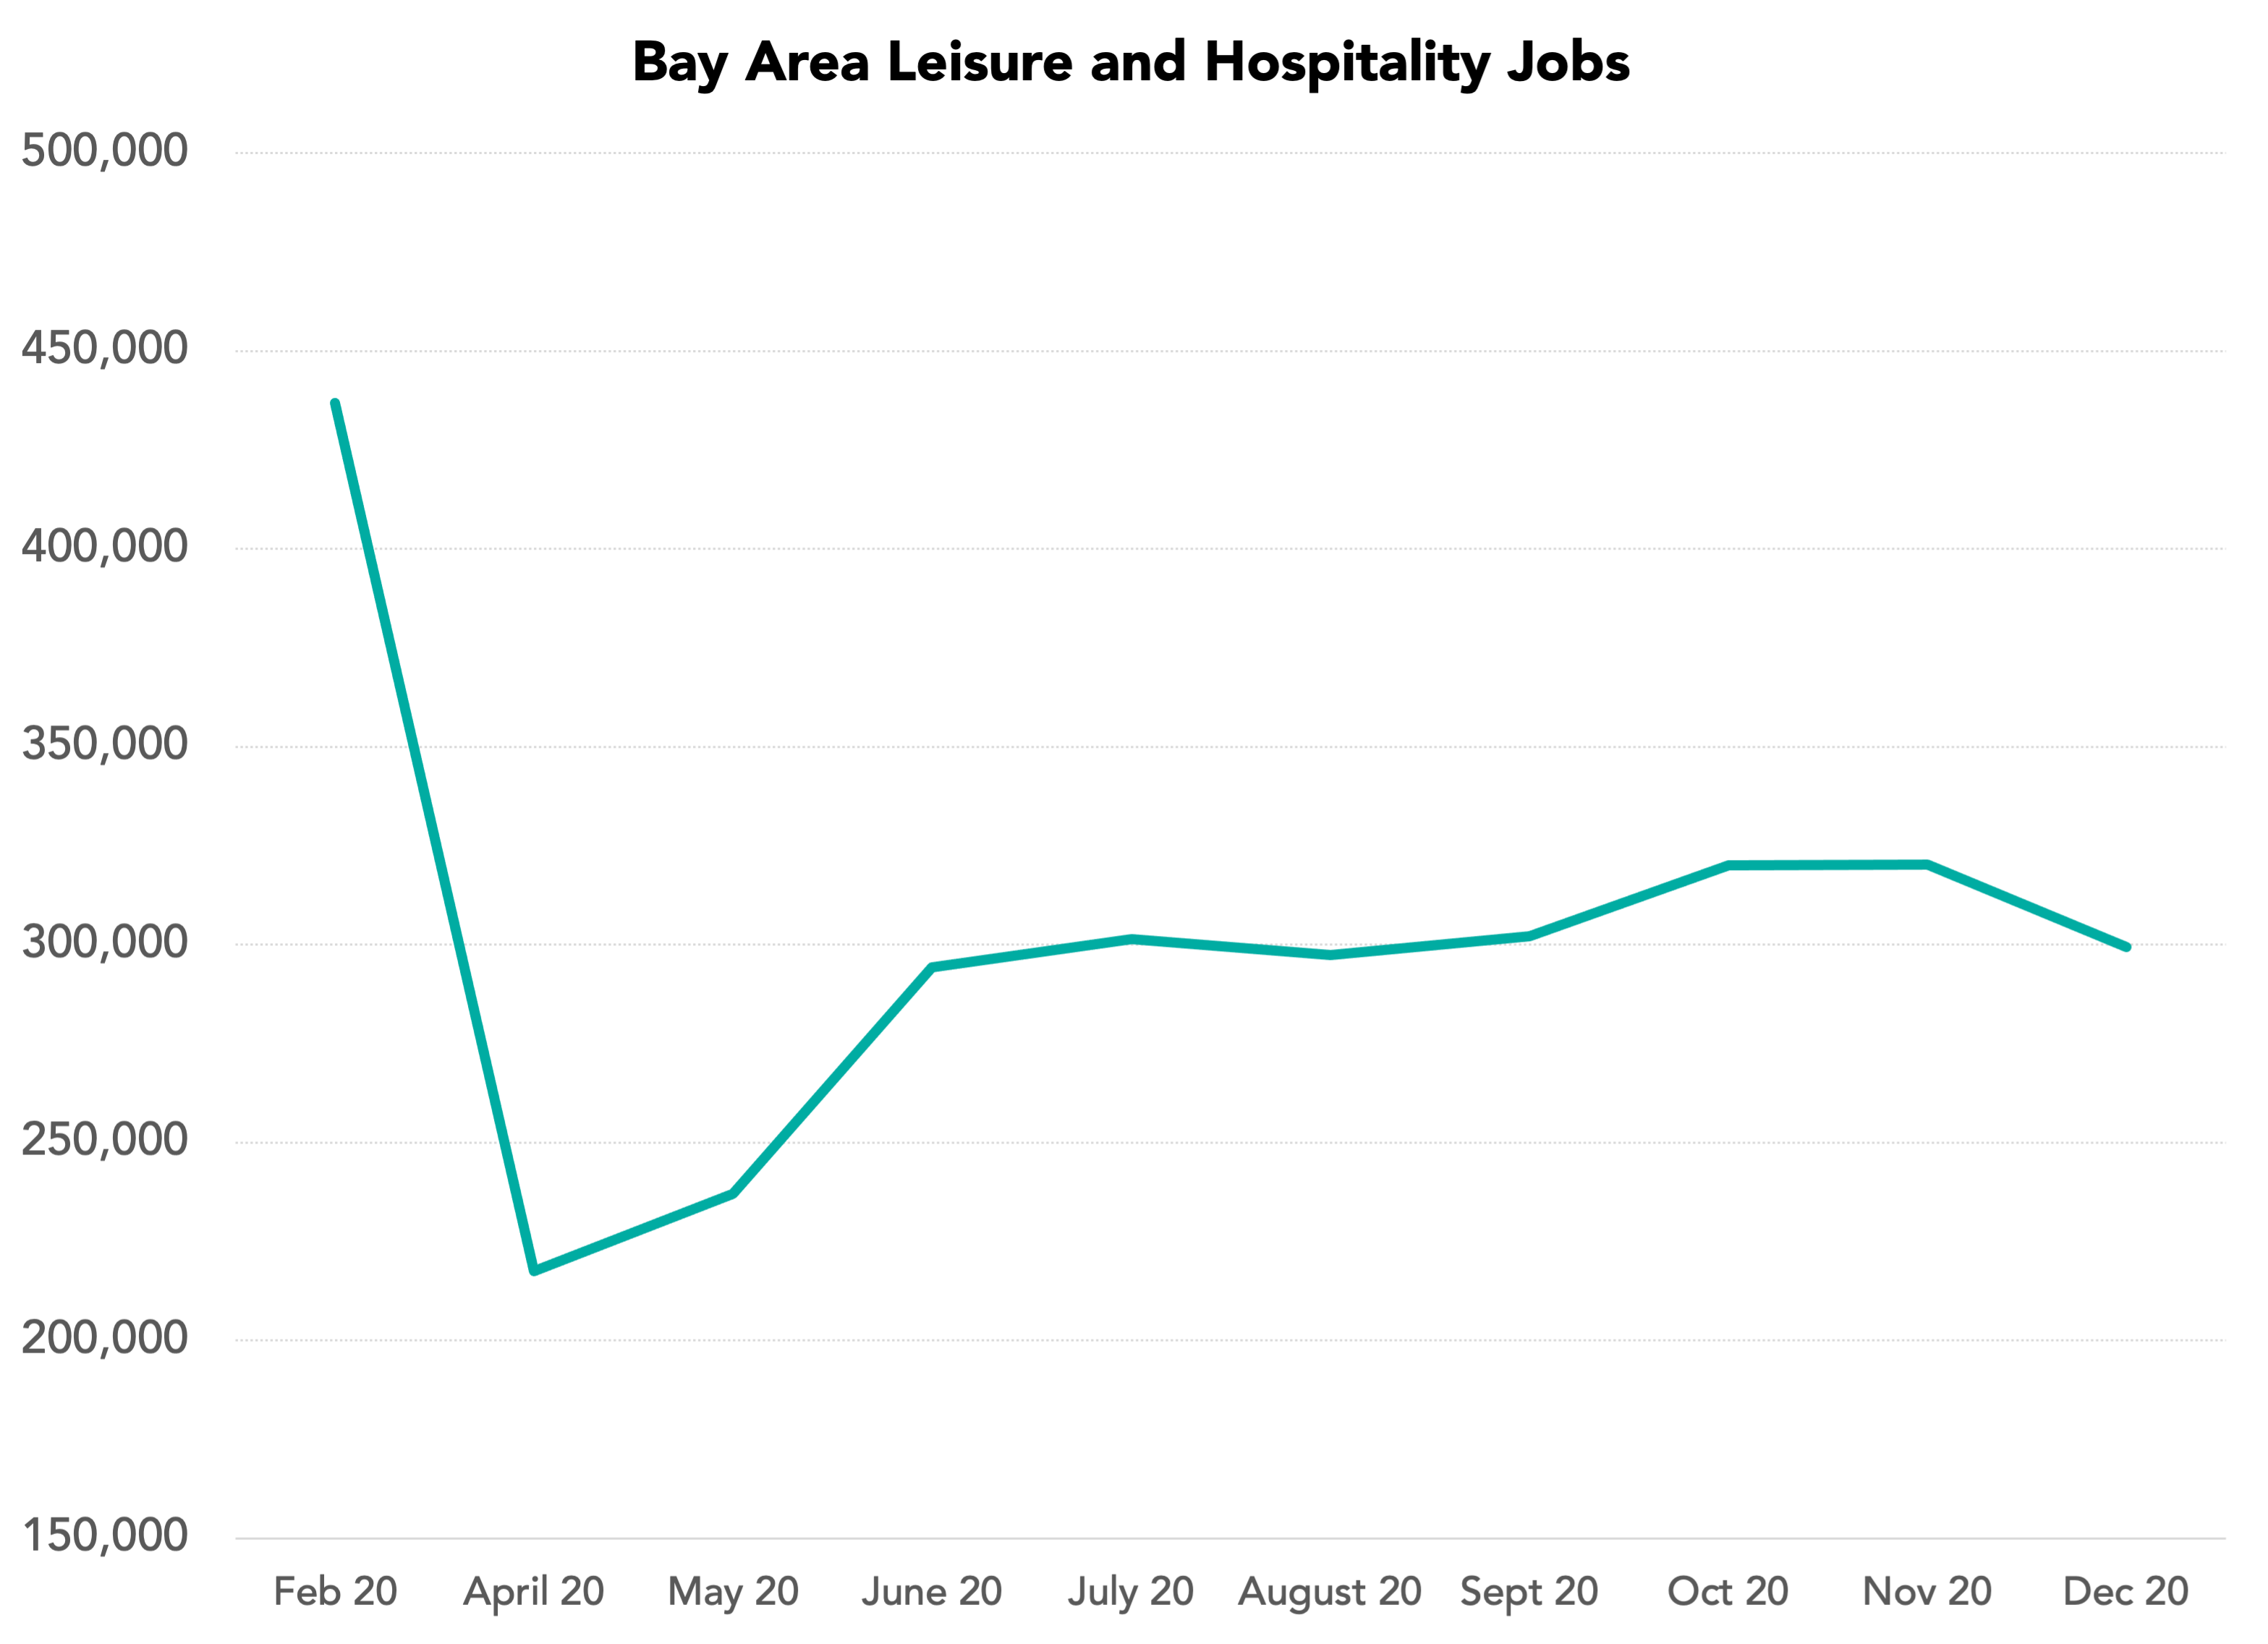
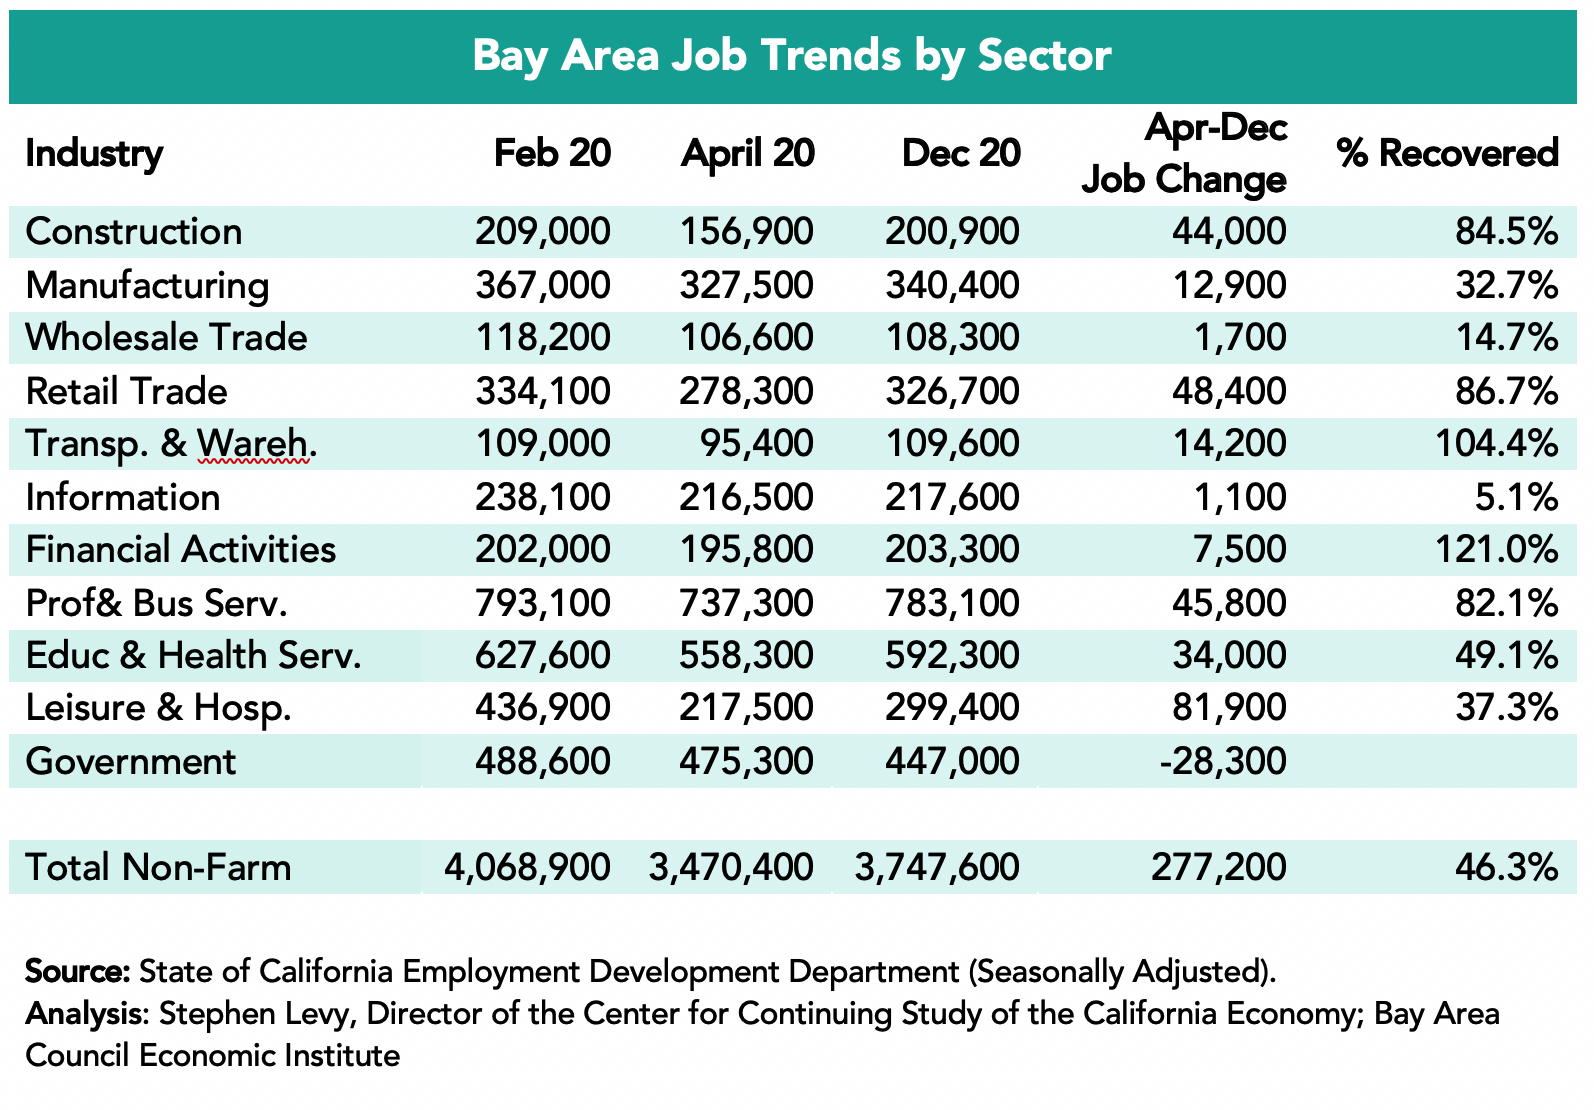
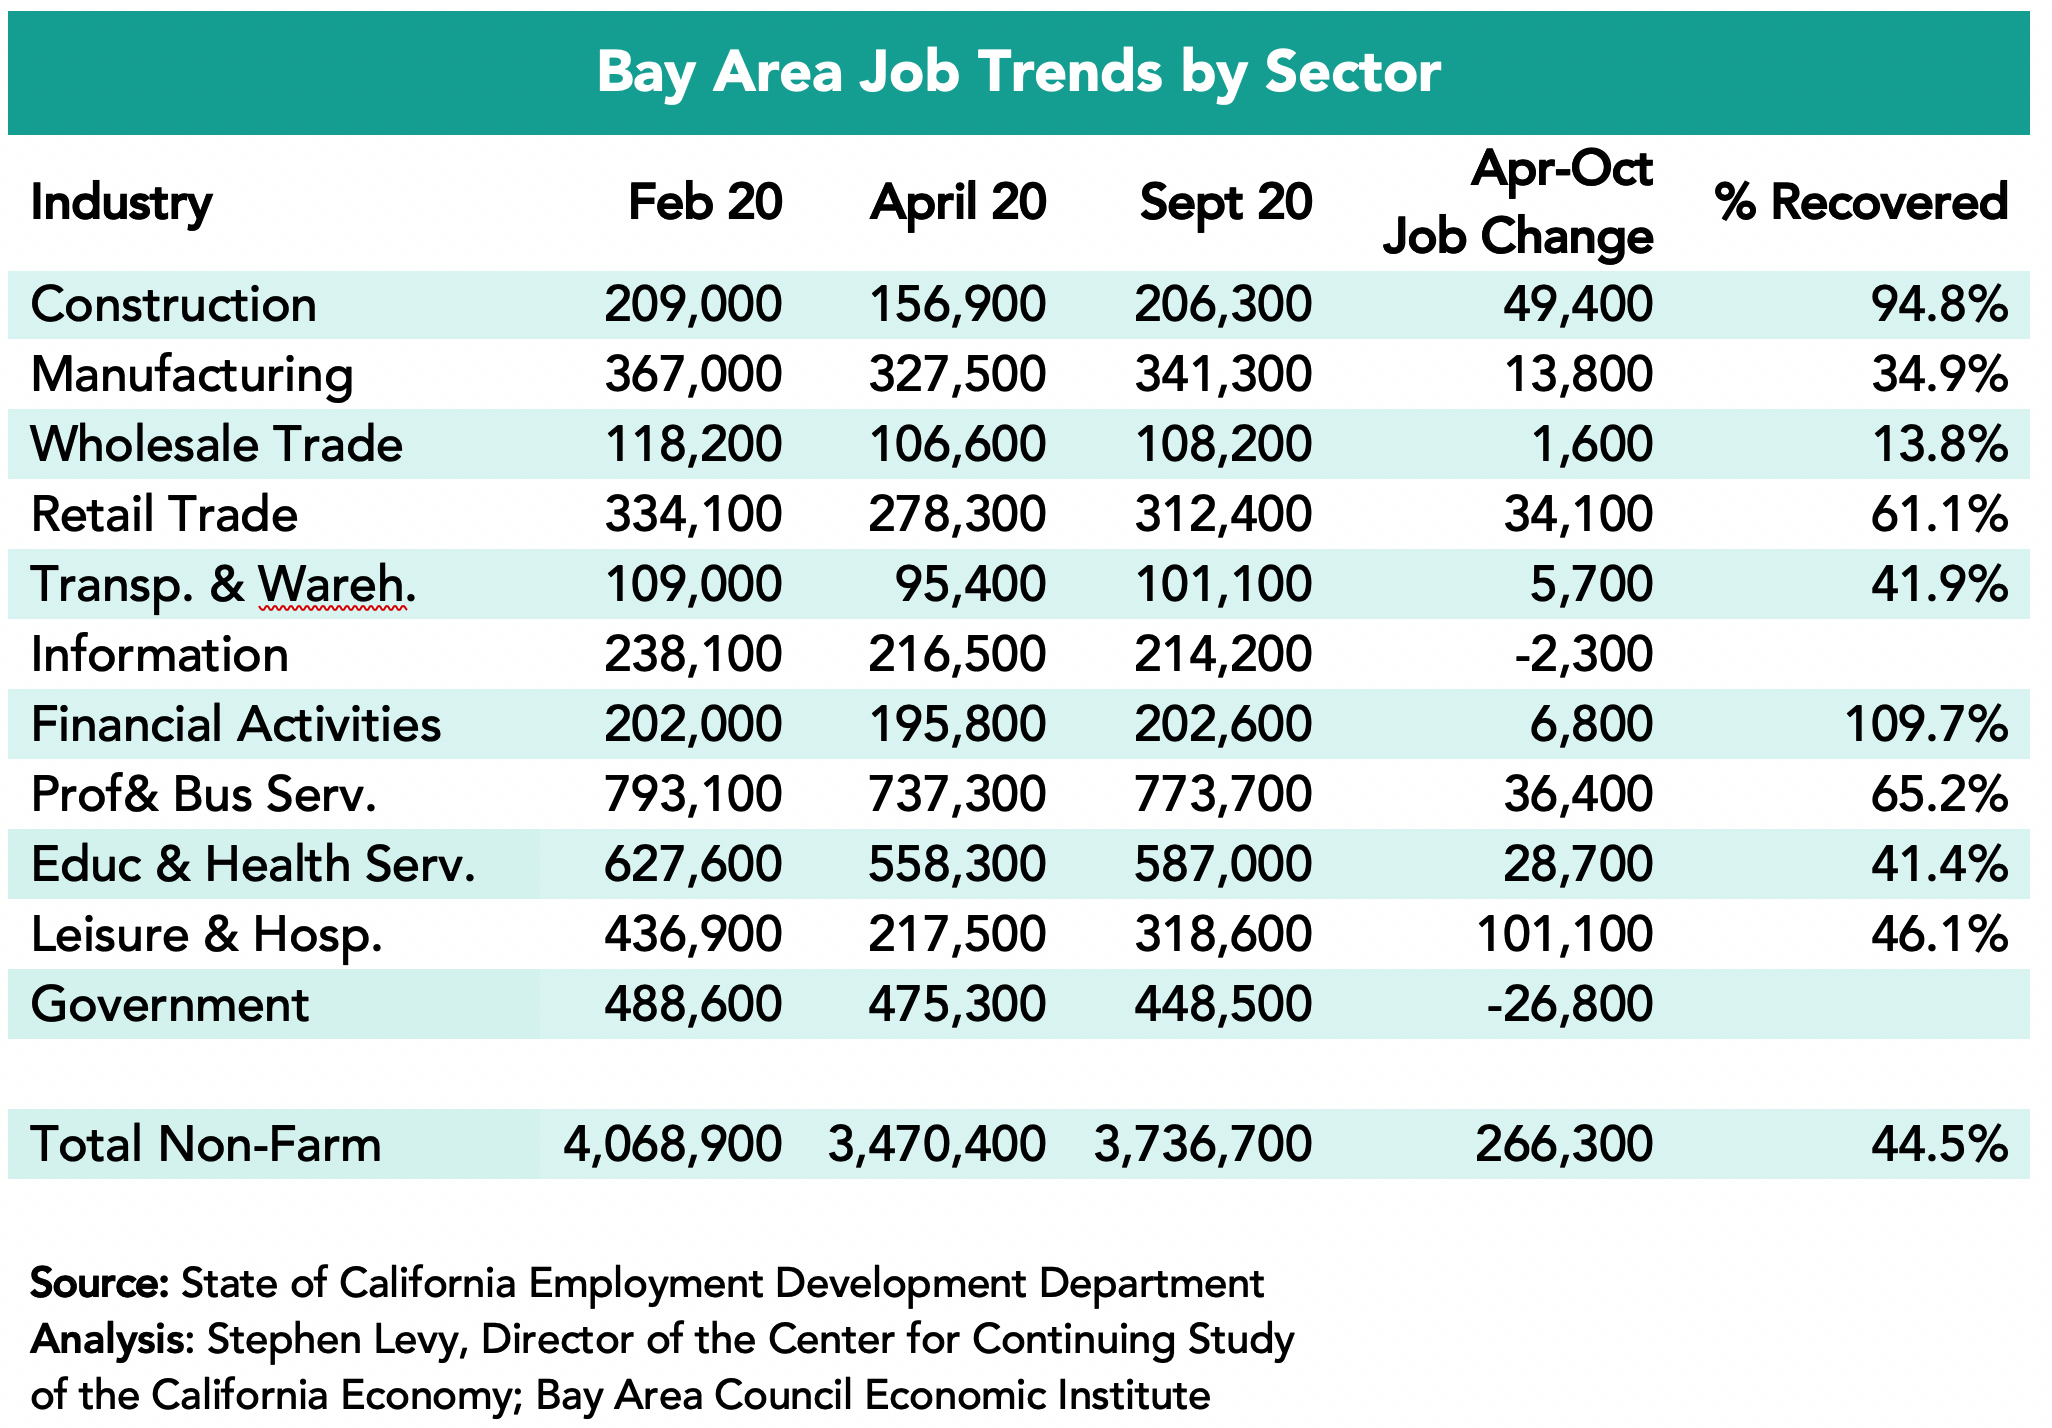
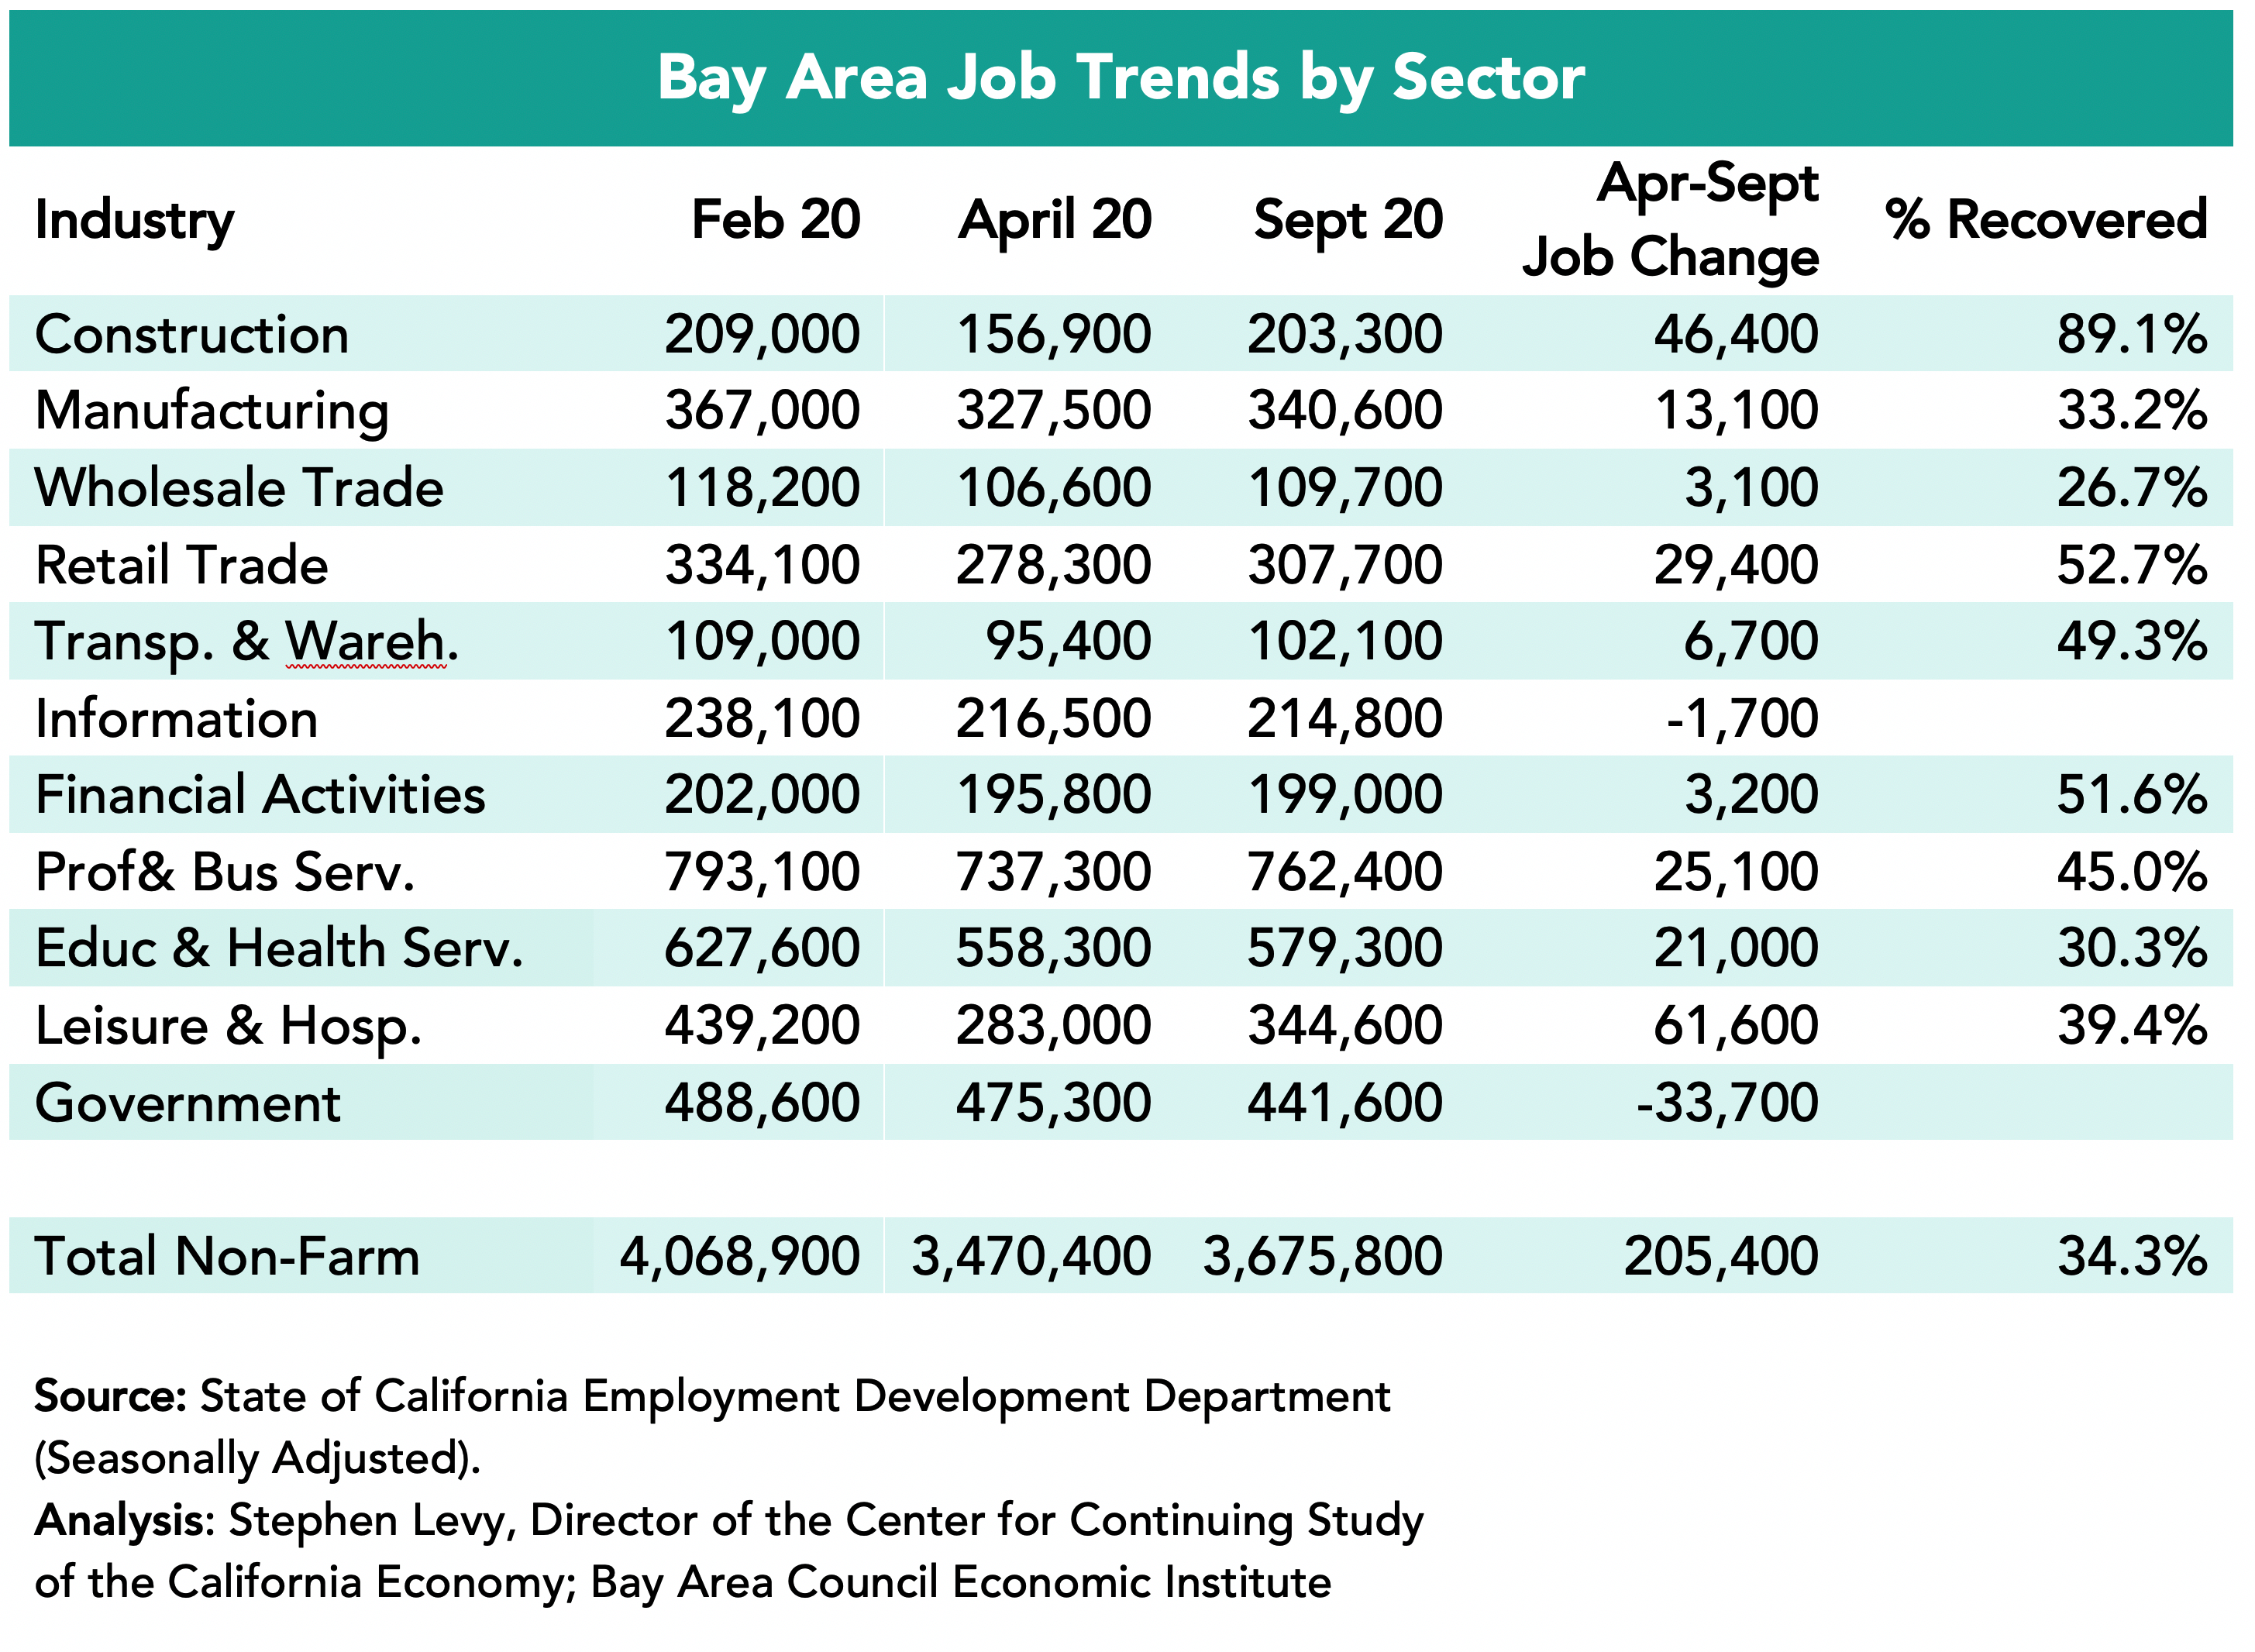
Five sectors—Construction, Manufacturing, Transportation and Warehousing, Information and Professional and Business Services—exceeded pre-pandemic job levels in July 2022. Financial Services at 30.6% had the lowest recovery rate and the Leisure and Hospitality sector has now recovered 81.3% of lost jobs by July 2022 and has the largest recent gains. The Government sector is now slowly recovering the jobs lost between February and April 2020.
Note that all sectors combined minus the government sector have now recovered nearly all the lost jobs as shown on the bottom row.
Unemployment Trends
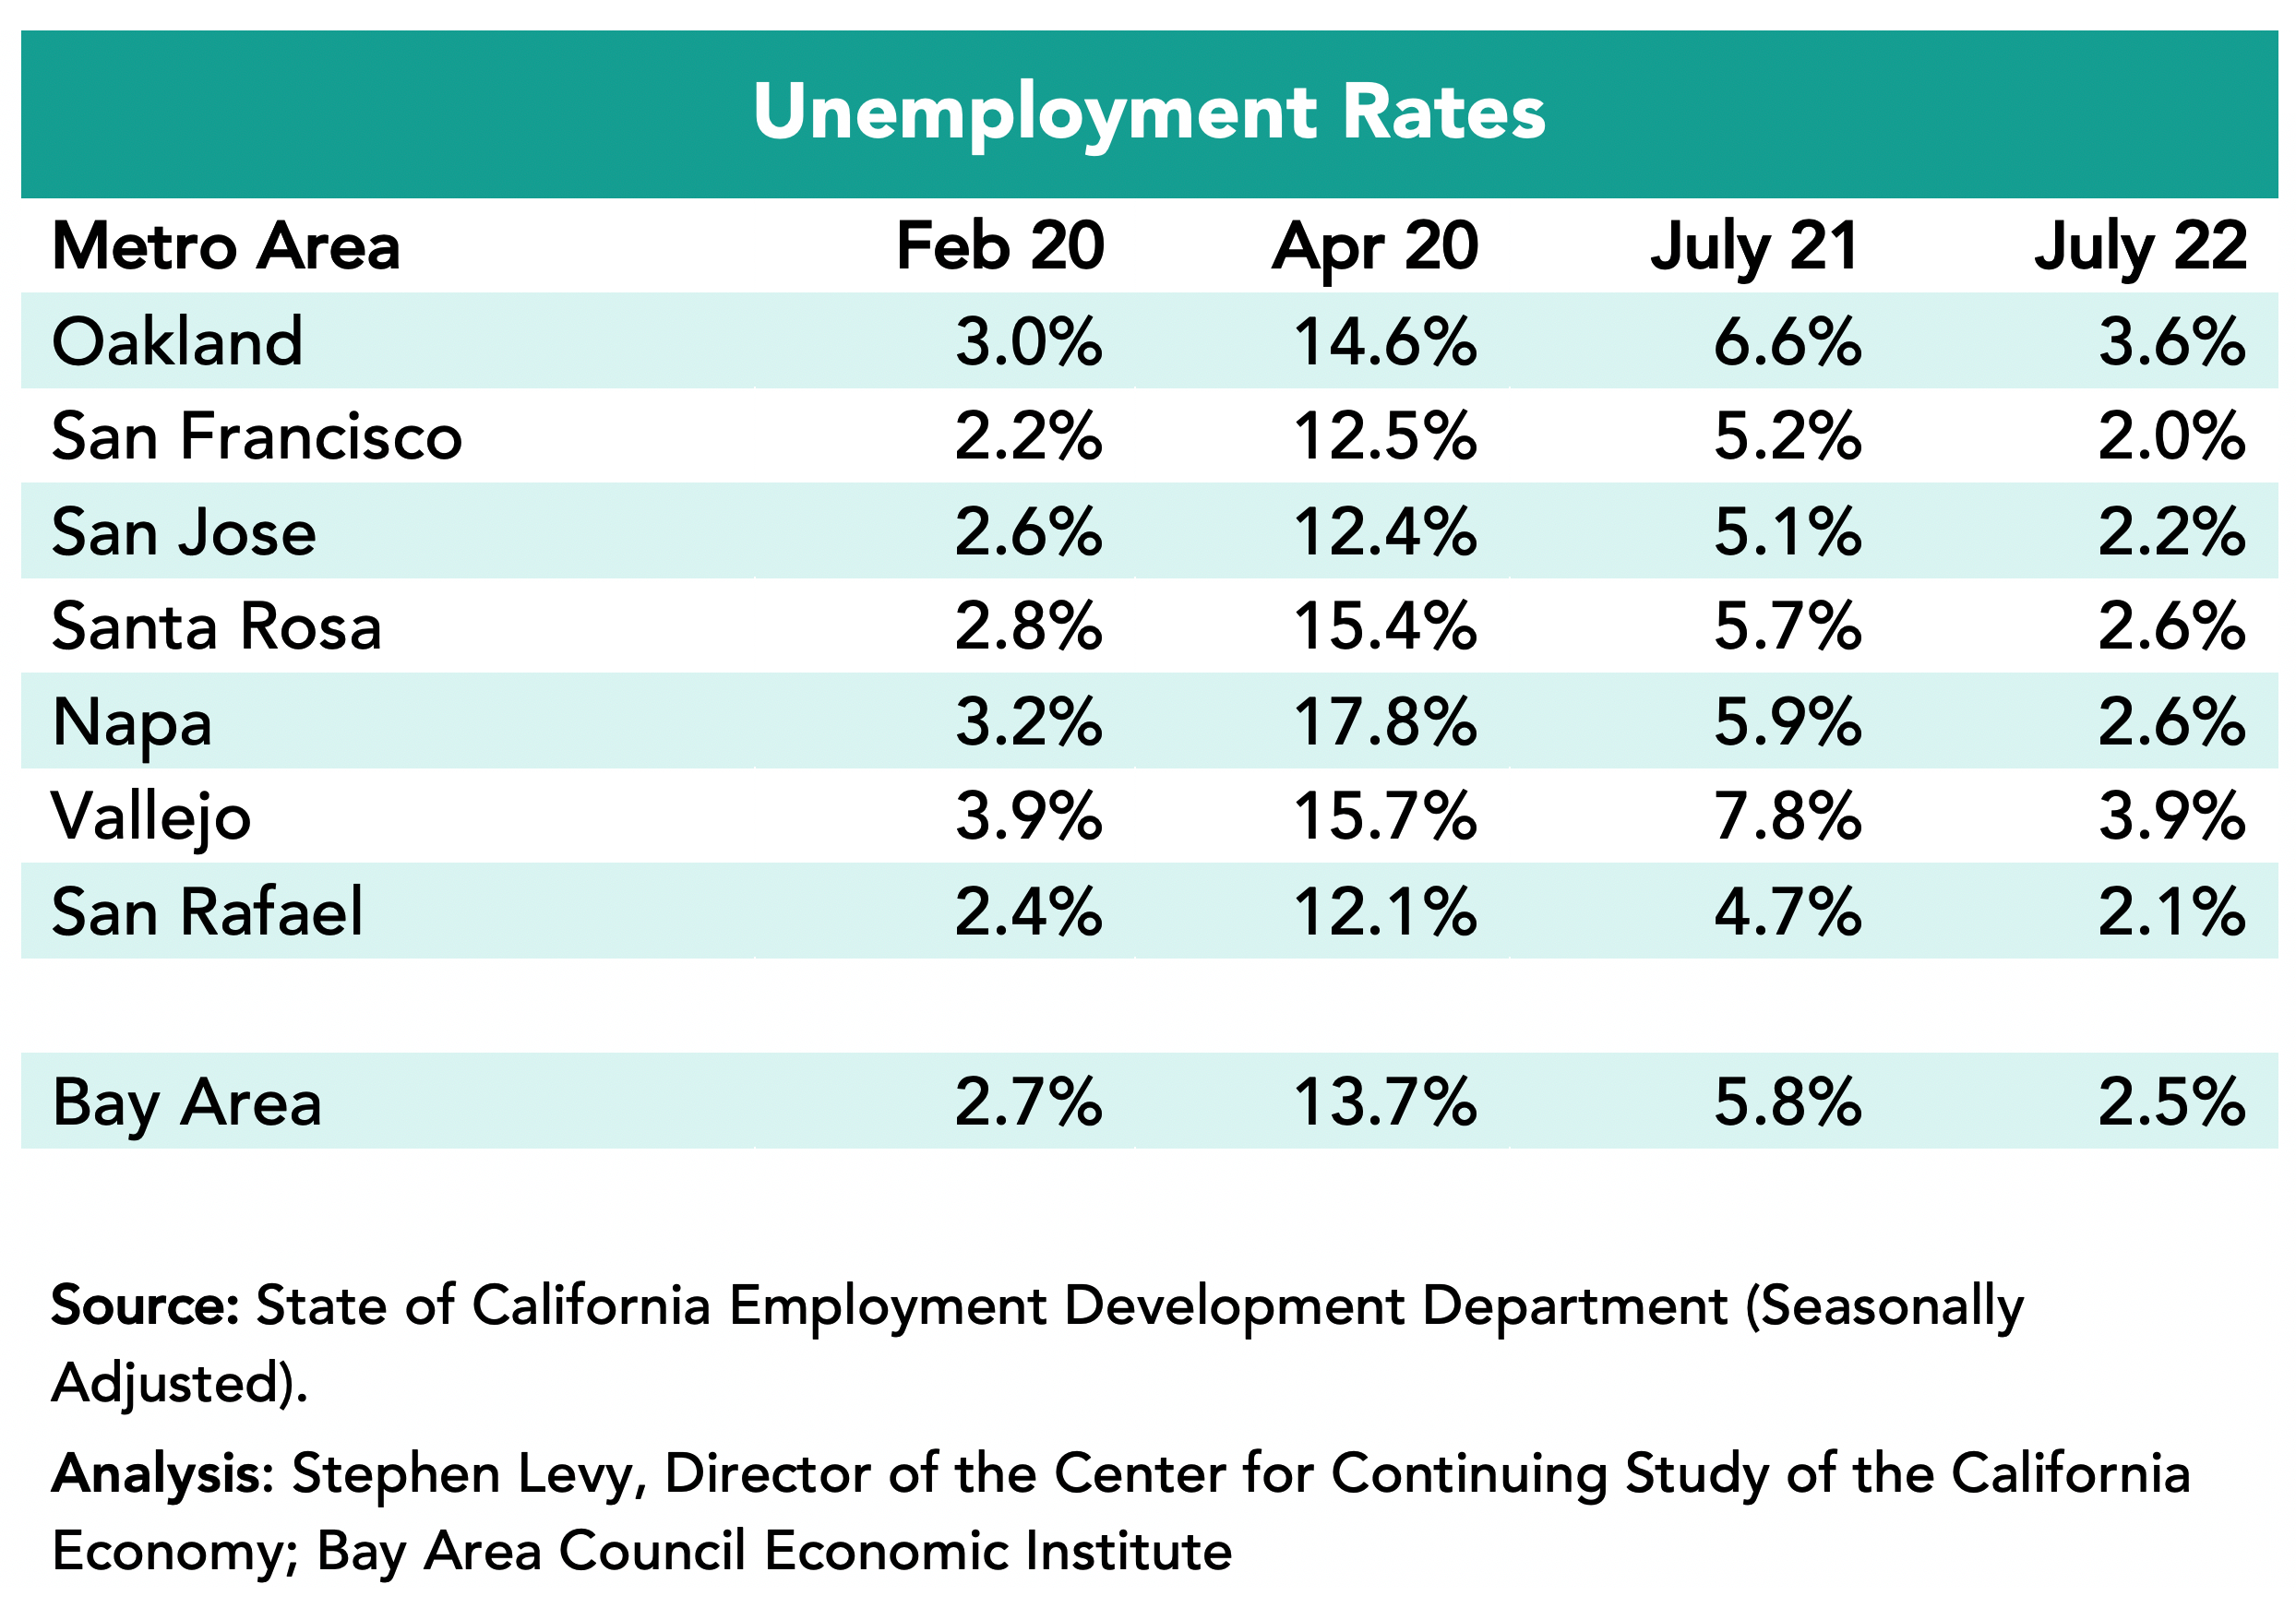
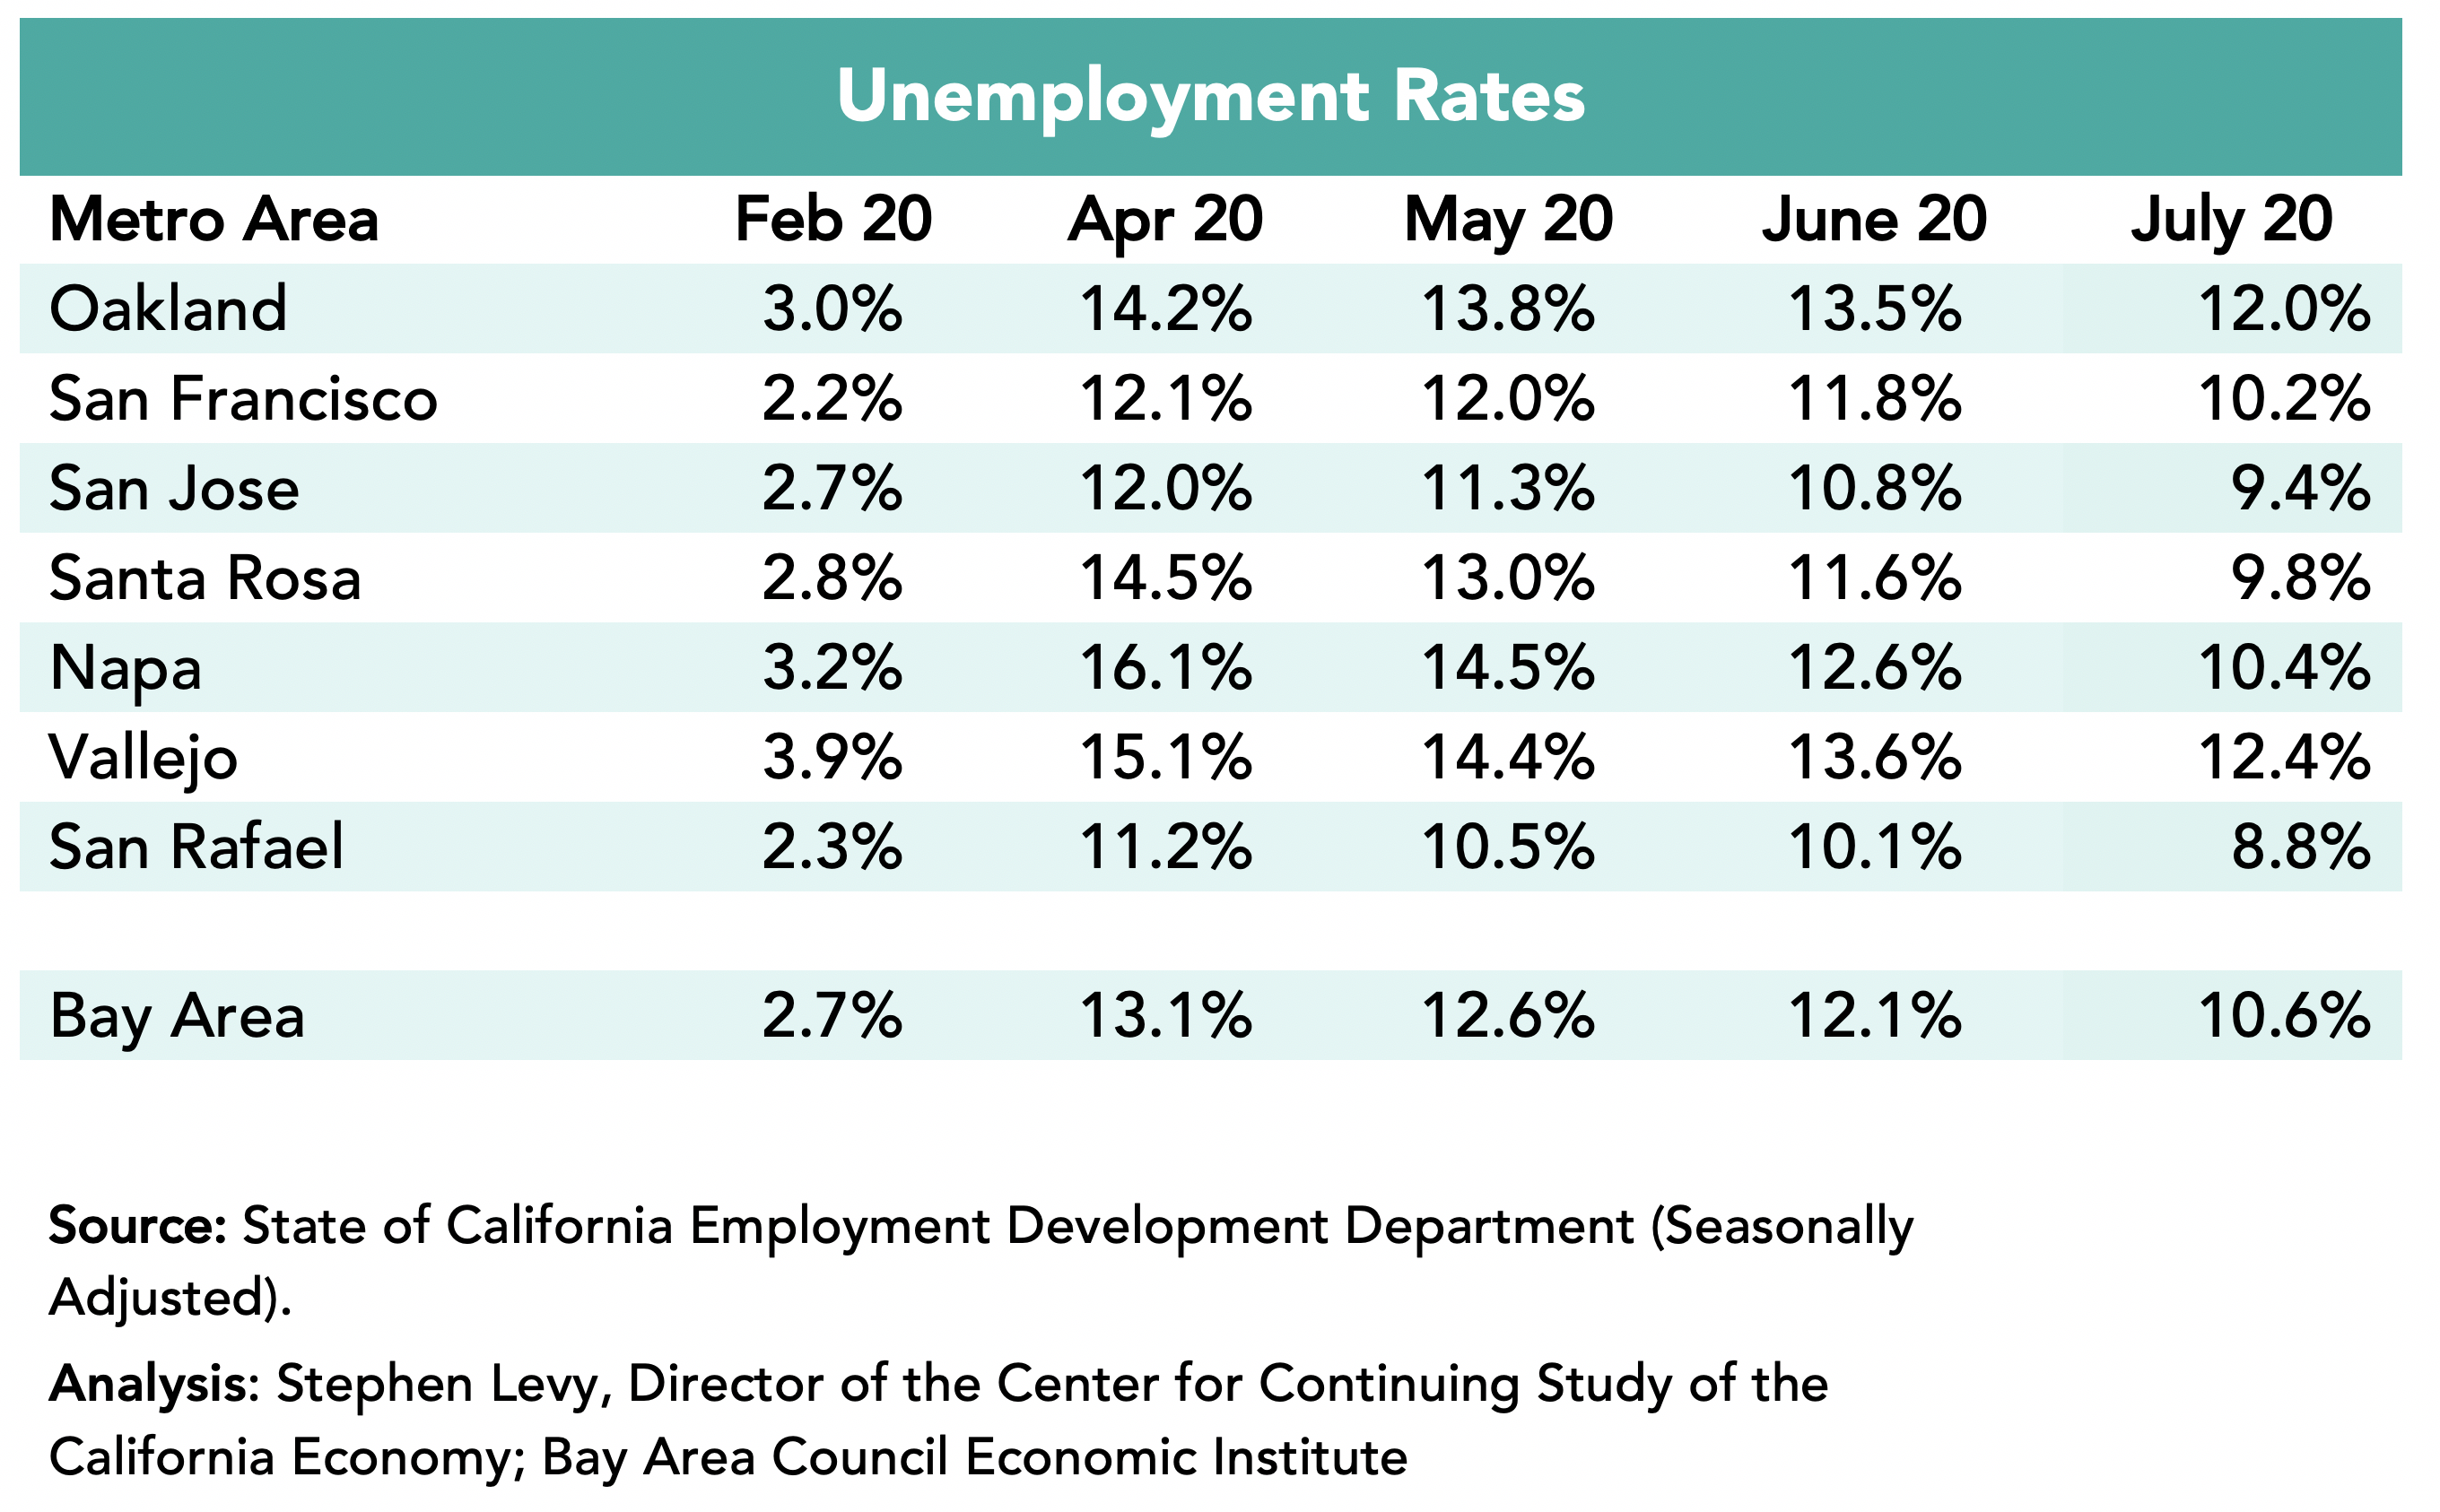
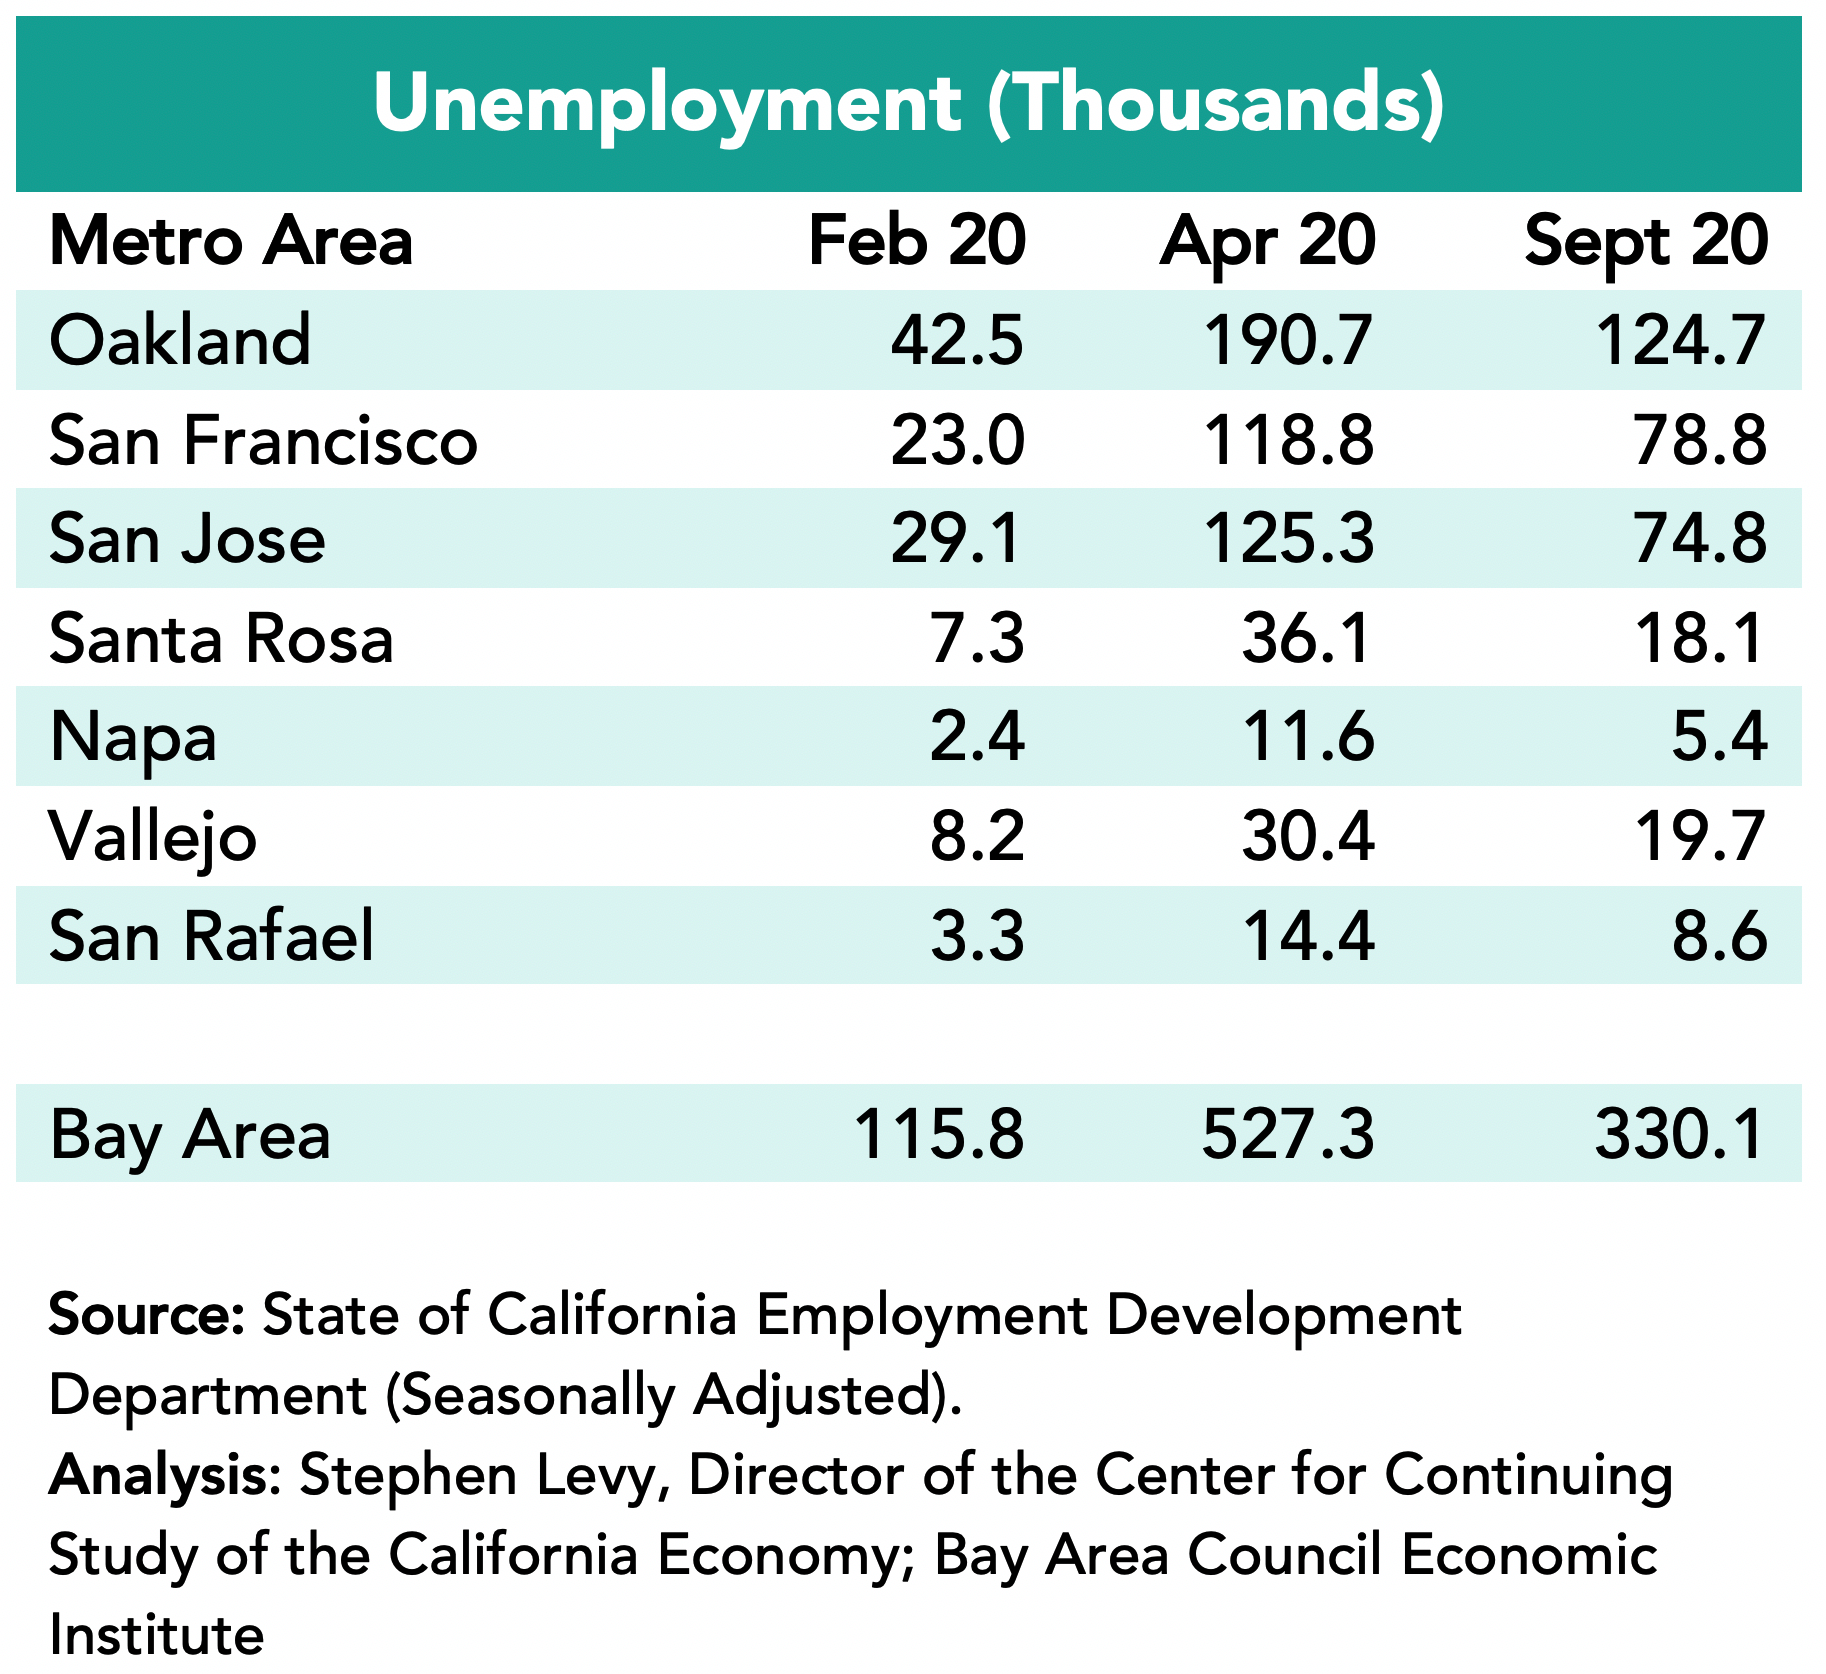
Unemployment rates go up in the summer on the not seasonally adjusted data as education jobs decline during summer break. Still Bay Area rates in July 2022 were below pre-pandemic levels though the months are not comparable. And there were 104,700 unemployed residents in July 2022 compared to 114,500 in February 2020.
The state data that is seasonally adjusted reported a decline to 3.9%, an all-time low for the state unemployment rate in July 2022 from 4.2% in June 2022 and 4.1% in February 2020.
Bay Area and State Labor Force Still Below Pre-Pandemic Levels but Where Will Workforce Growth Come From.
The state has more than 200,000 fewer workers than in the month before the pandemic started and the Bay Area has more than 50,000 fewer residents in the workforce.
Though the recent pace of job growth has been encouraging, it is not clear where new workers will come from with low unemployment already and low population growth. Perhaps the new school year going back towards normal will allow parents who dropped out to return to the workforce. And it is possible that more workers can come from remote locations so the Bay Area and state can see job growth without more residents working. Job openings remain high and sectors like air travel are constrained by lack of enough workers
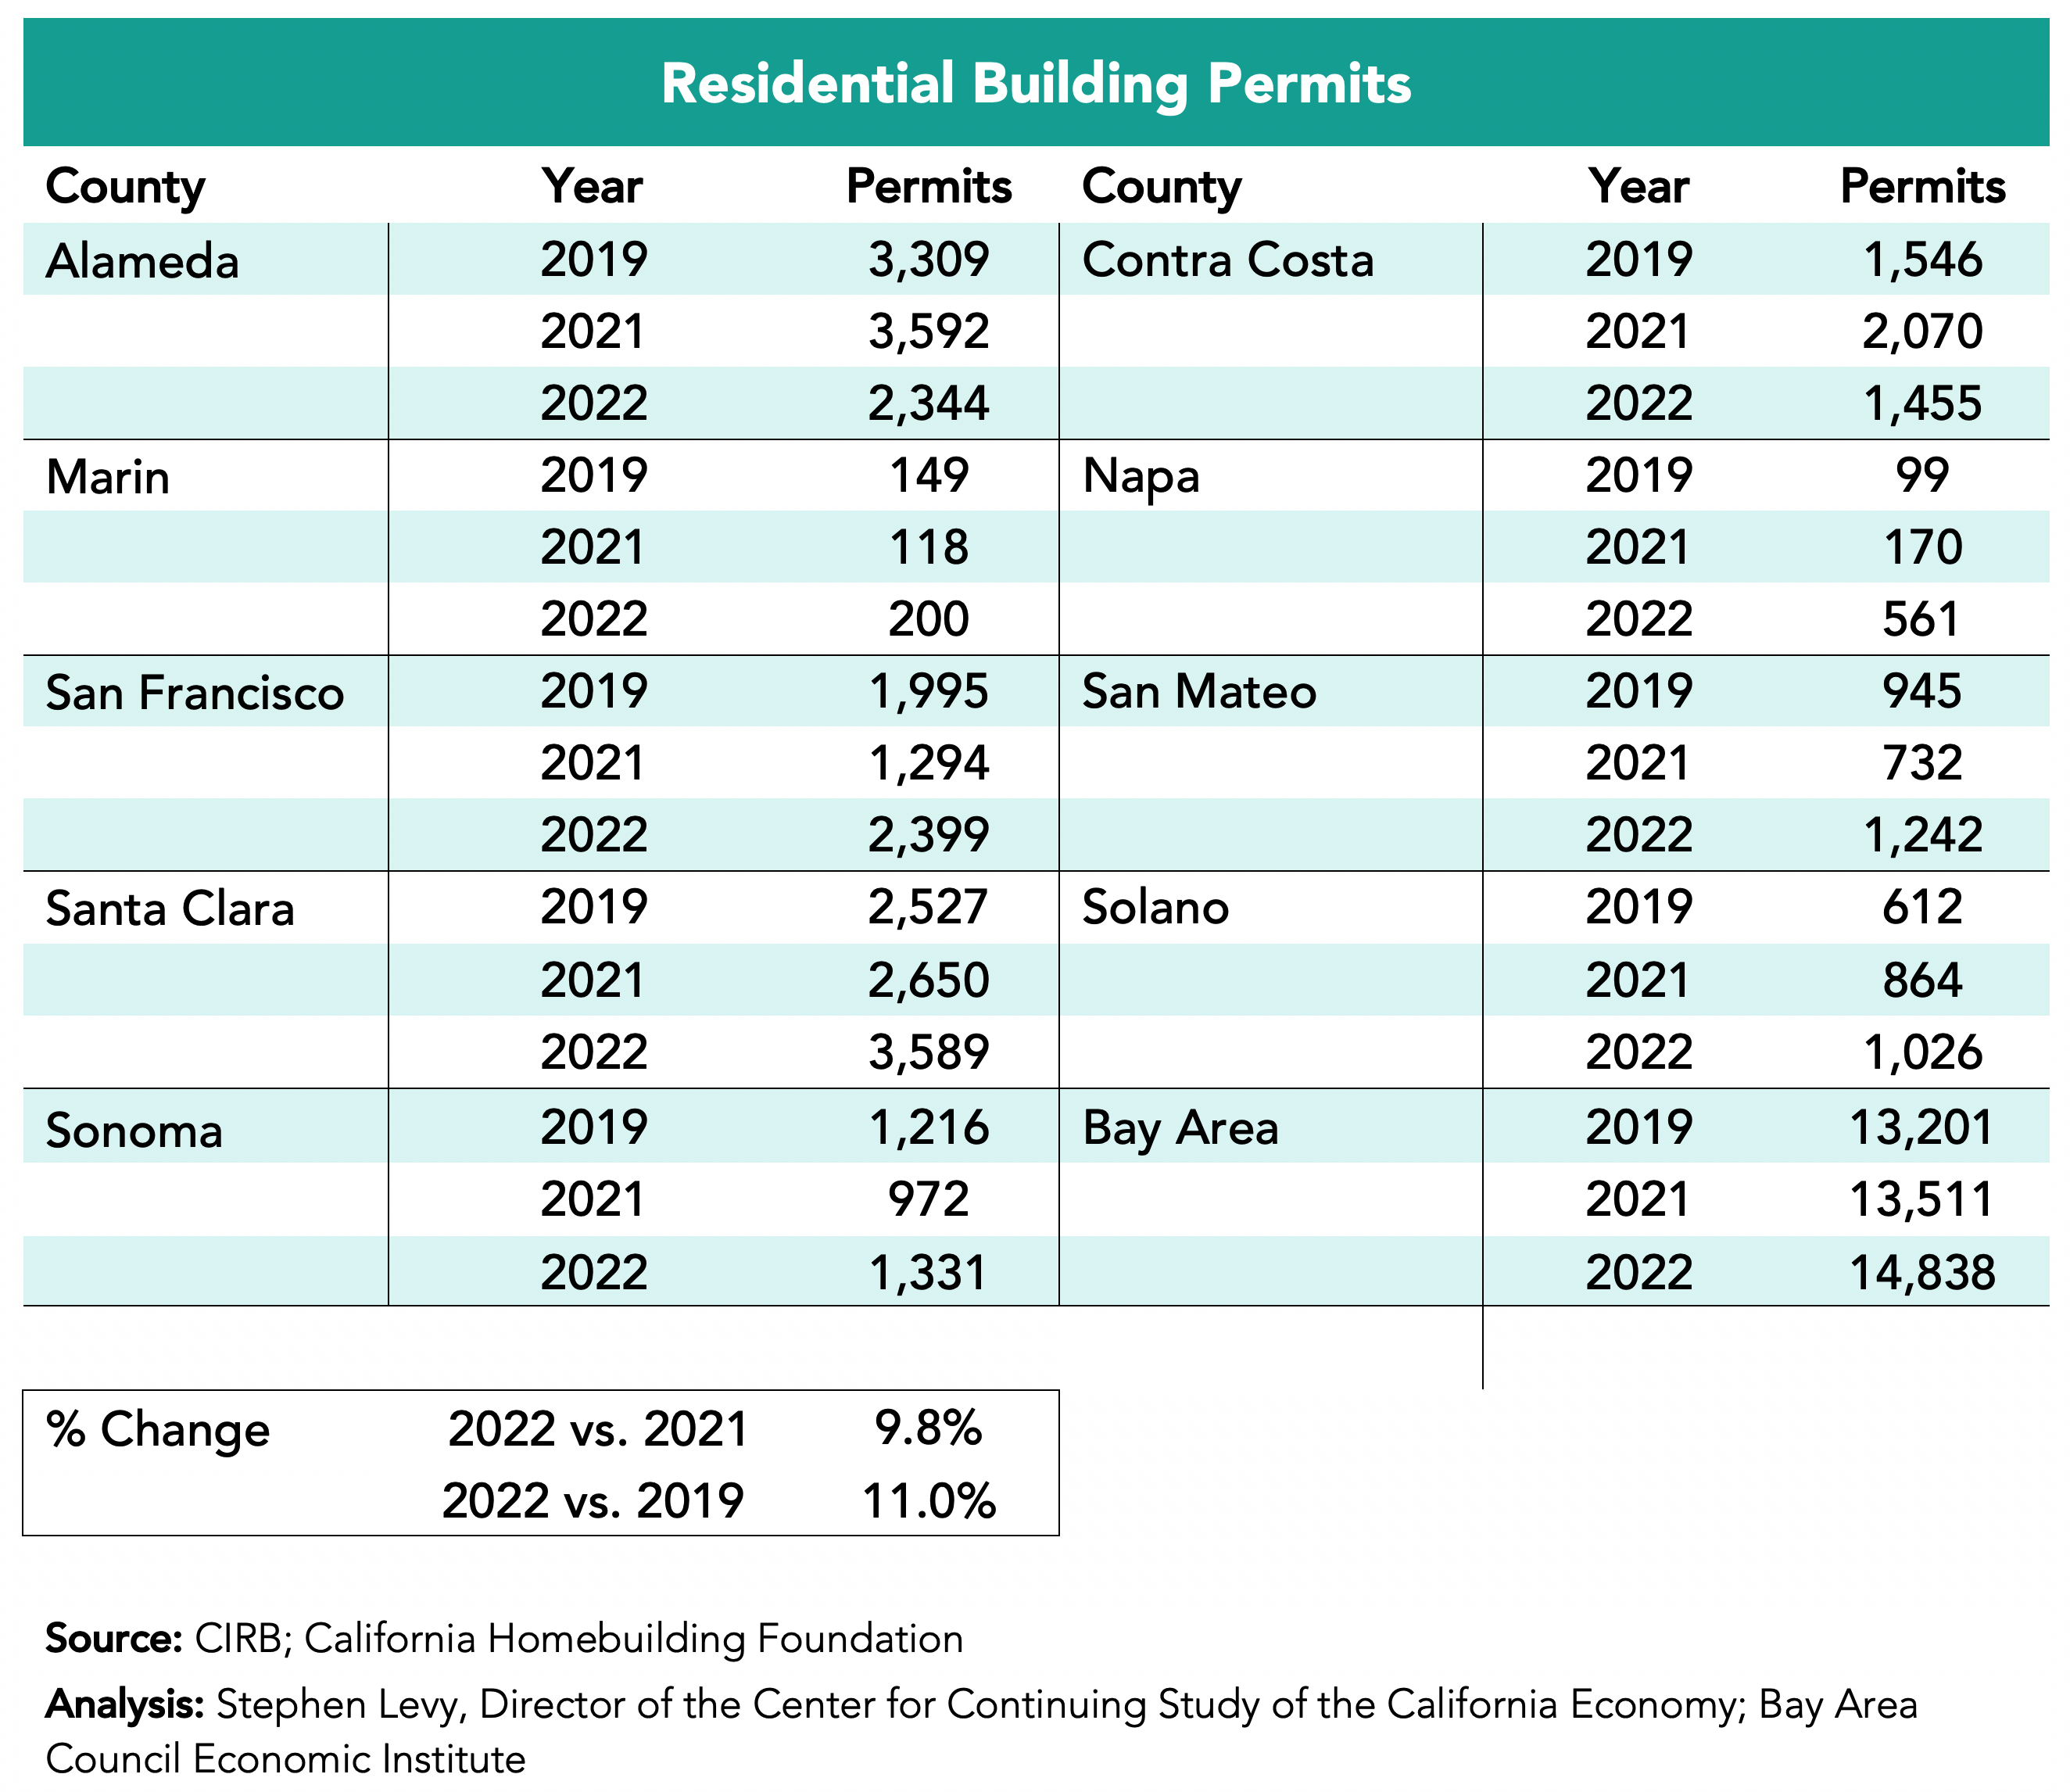
A Welcome Uptick in Housing Permits
Permits levels in the first six months of 2022 exceeded 2019 and 2021 levels though East Bay permit levels were below earlier levels. The other counties showed large year over year gains. In addition, now there are almost daily reports of new housing projects being proposed and approved though it is often a long step until these units are completed and on the market. Bay Area cities are updating their Housing Elements currently and learning about the requirements to meet their RHNA goals. It is possible that the RHNA and update process is encouraging cities to loosen development standards and to approve more projects. While the current growth in permits is a positive sign, these levels are still below the RHNA targets for the region. More needs to be done.
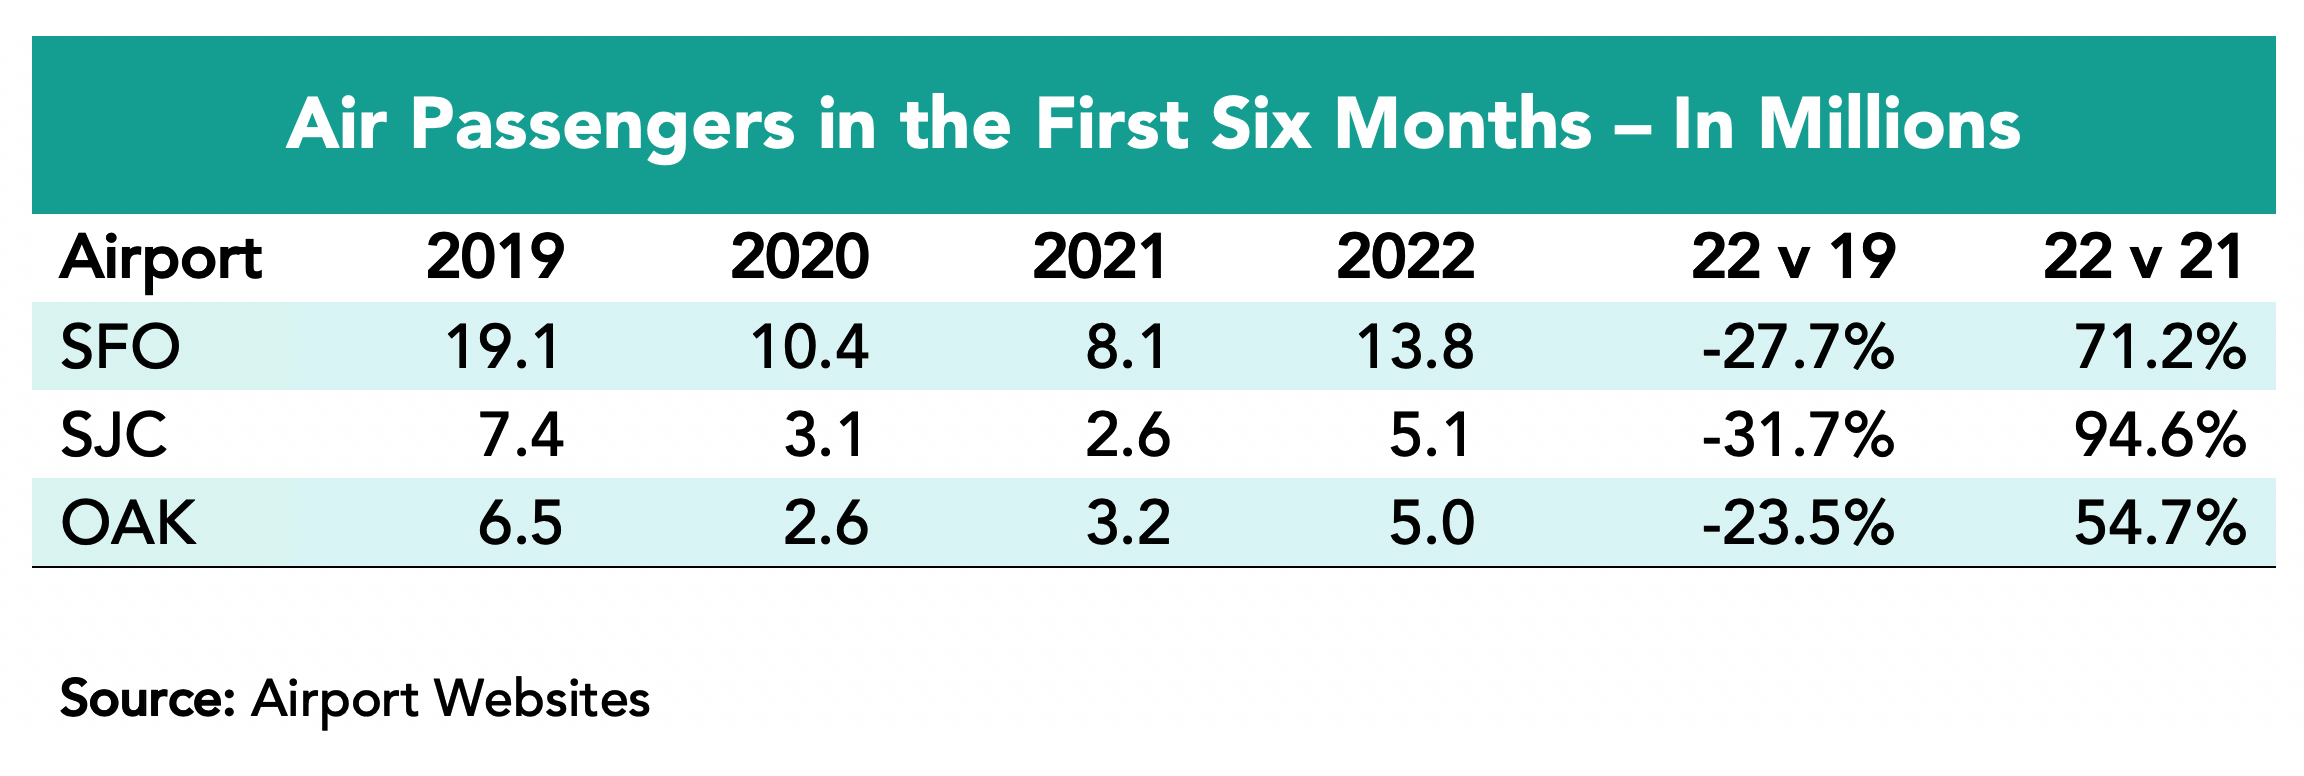
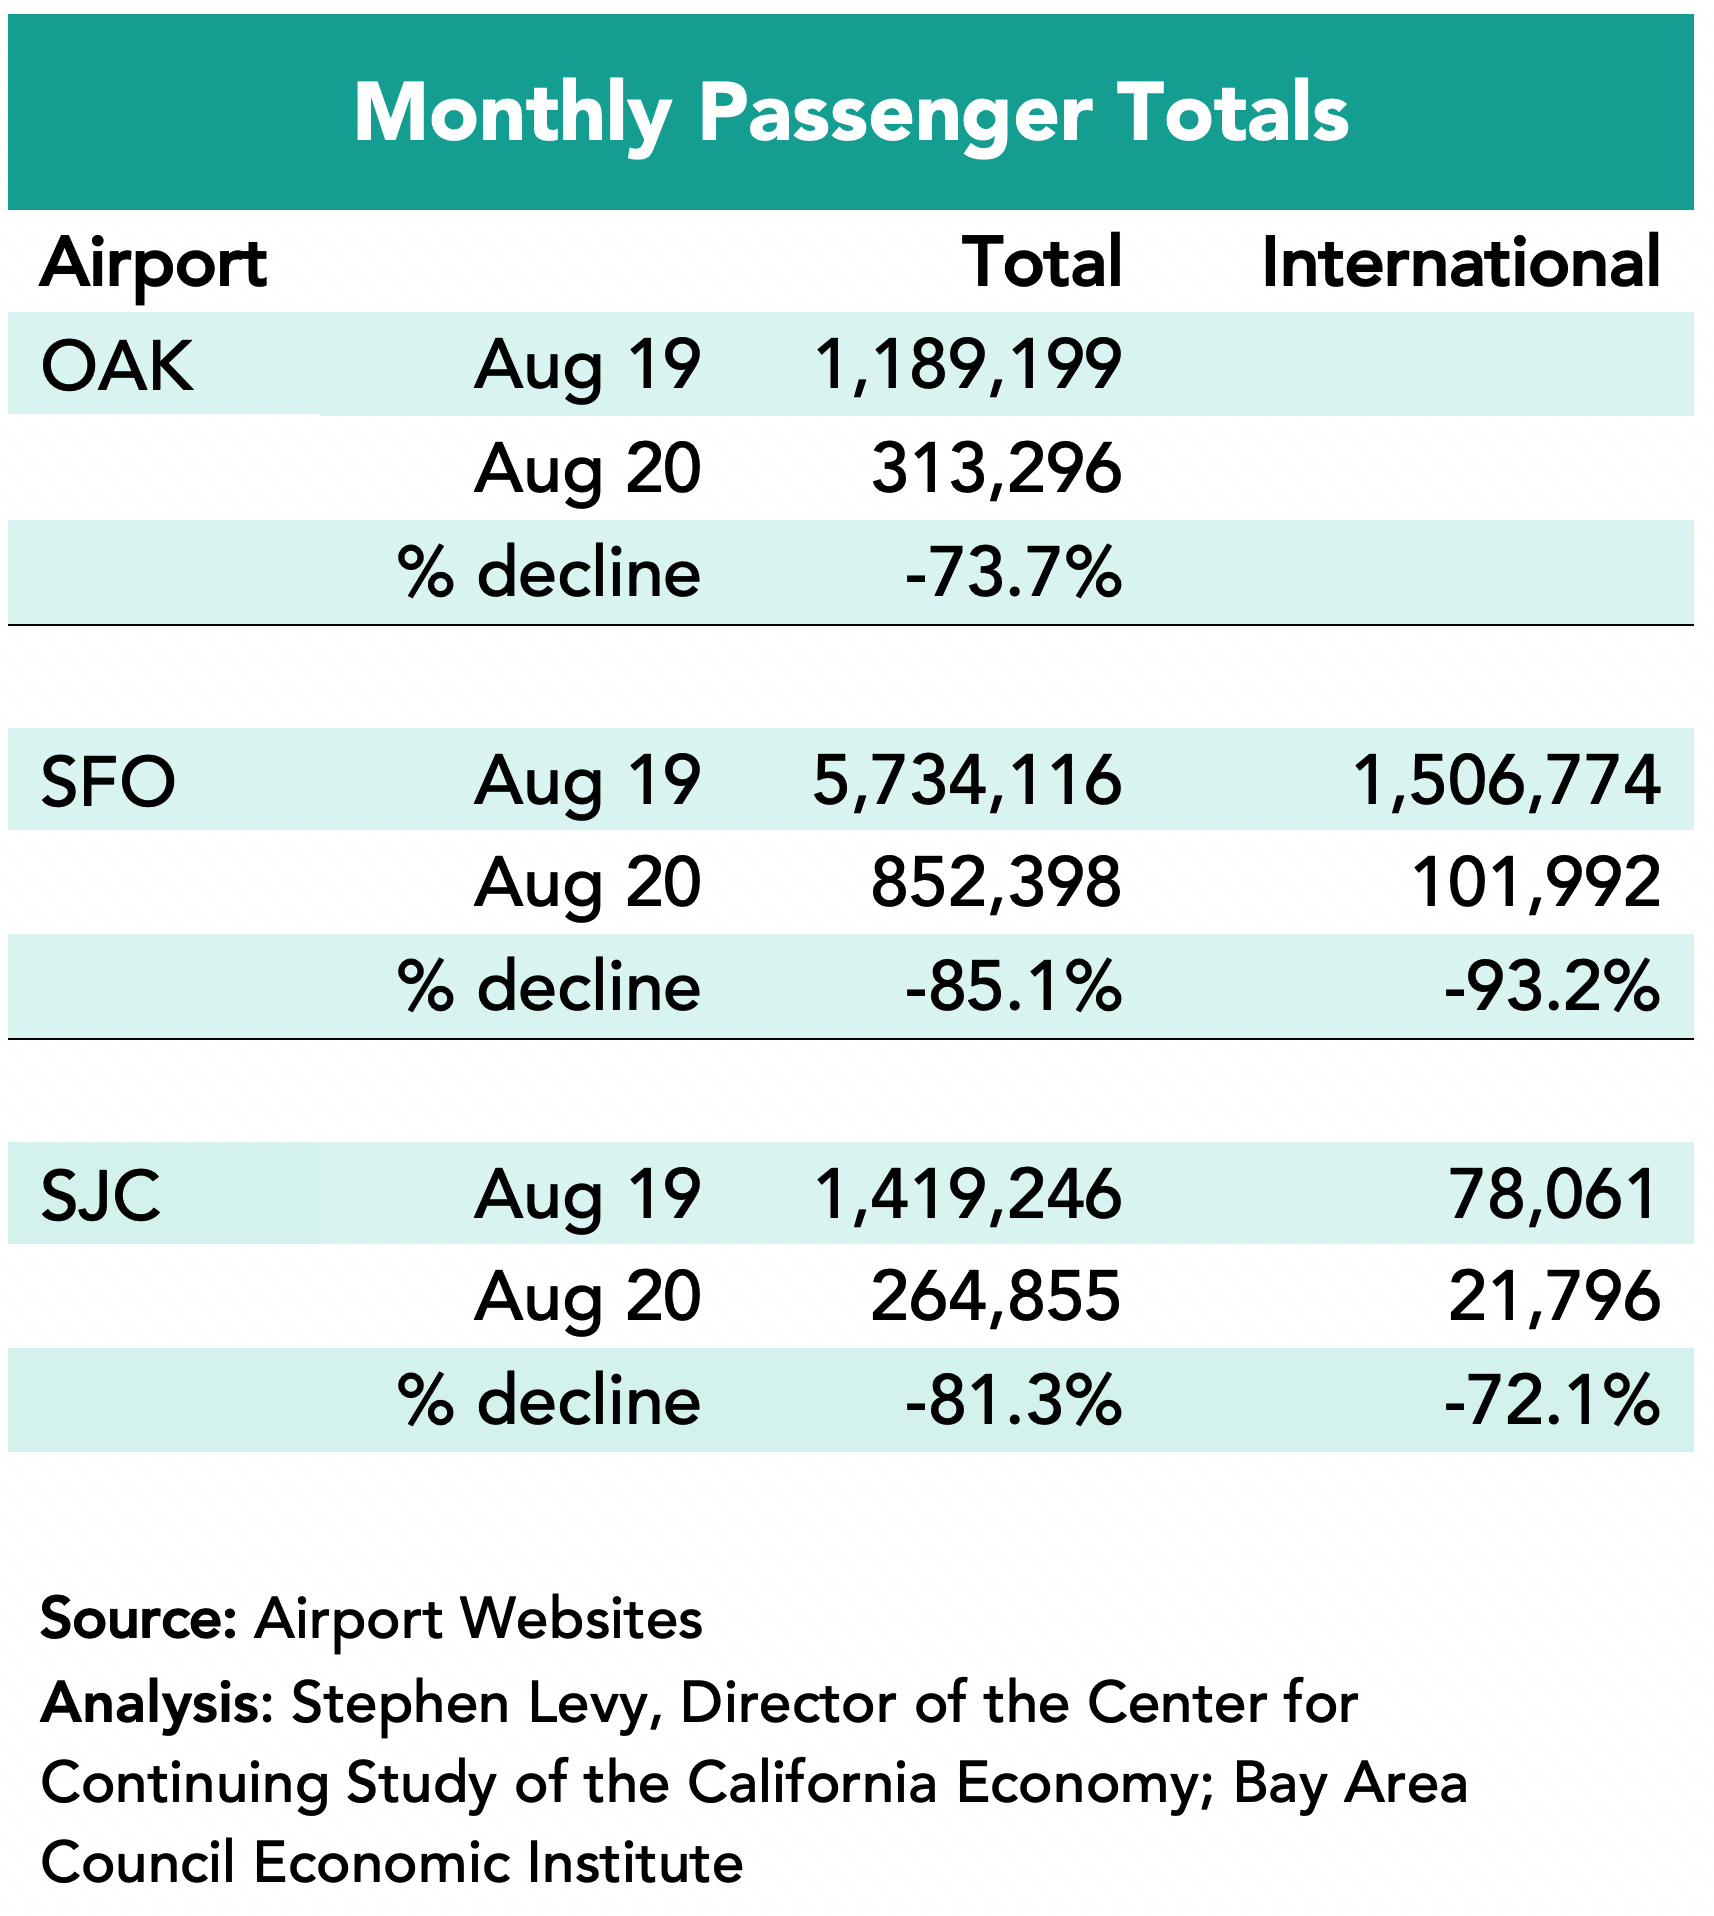
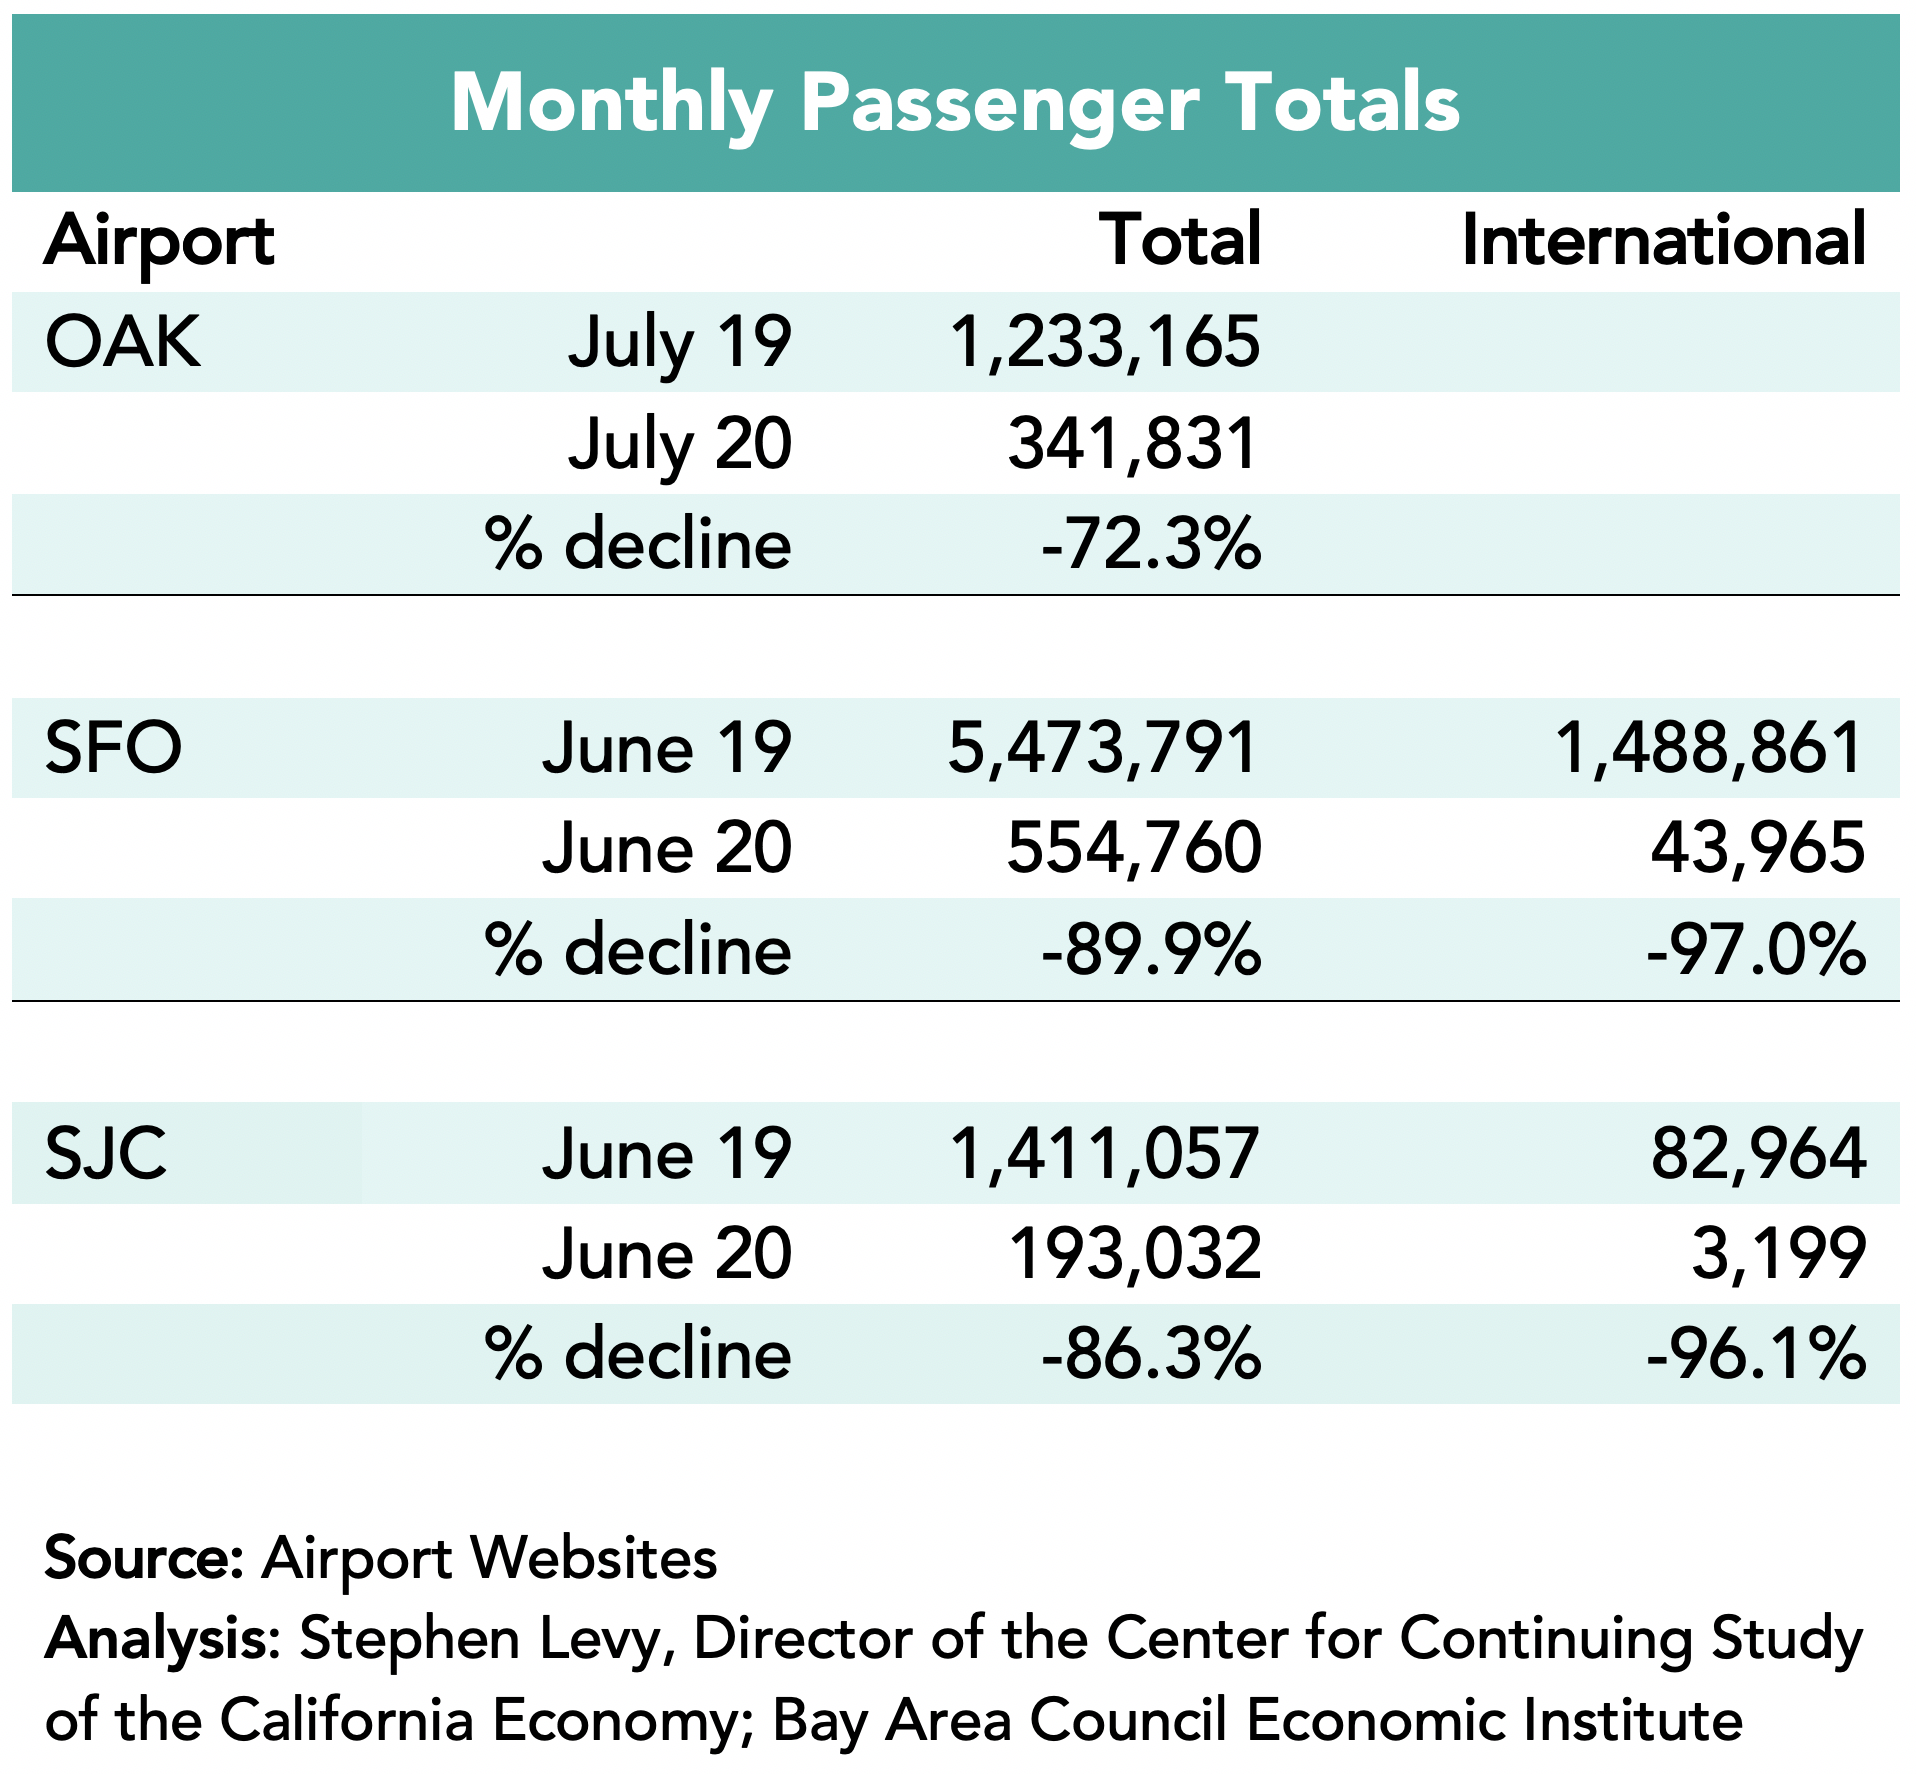
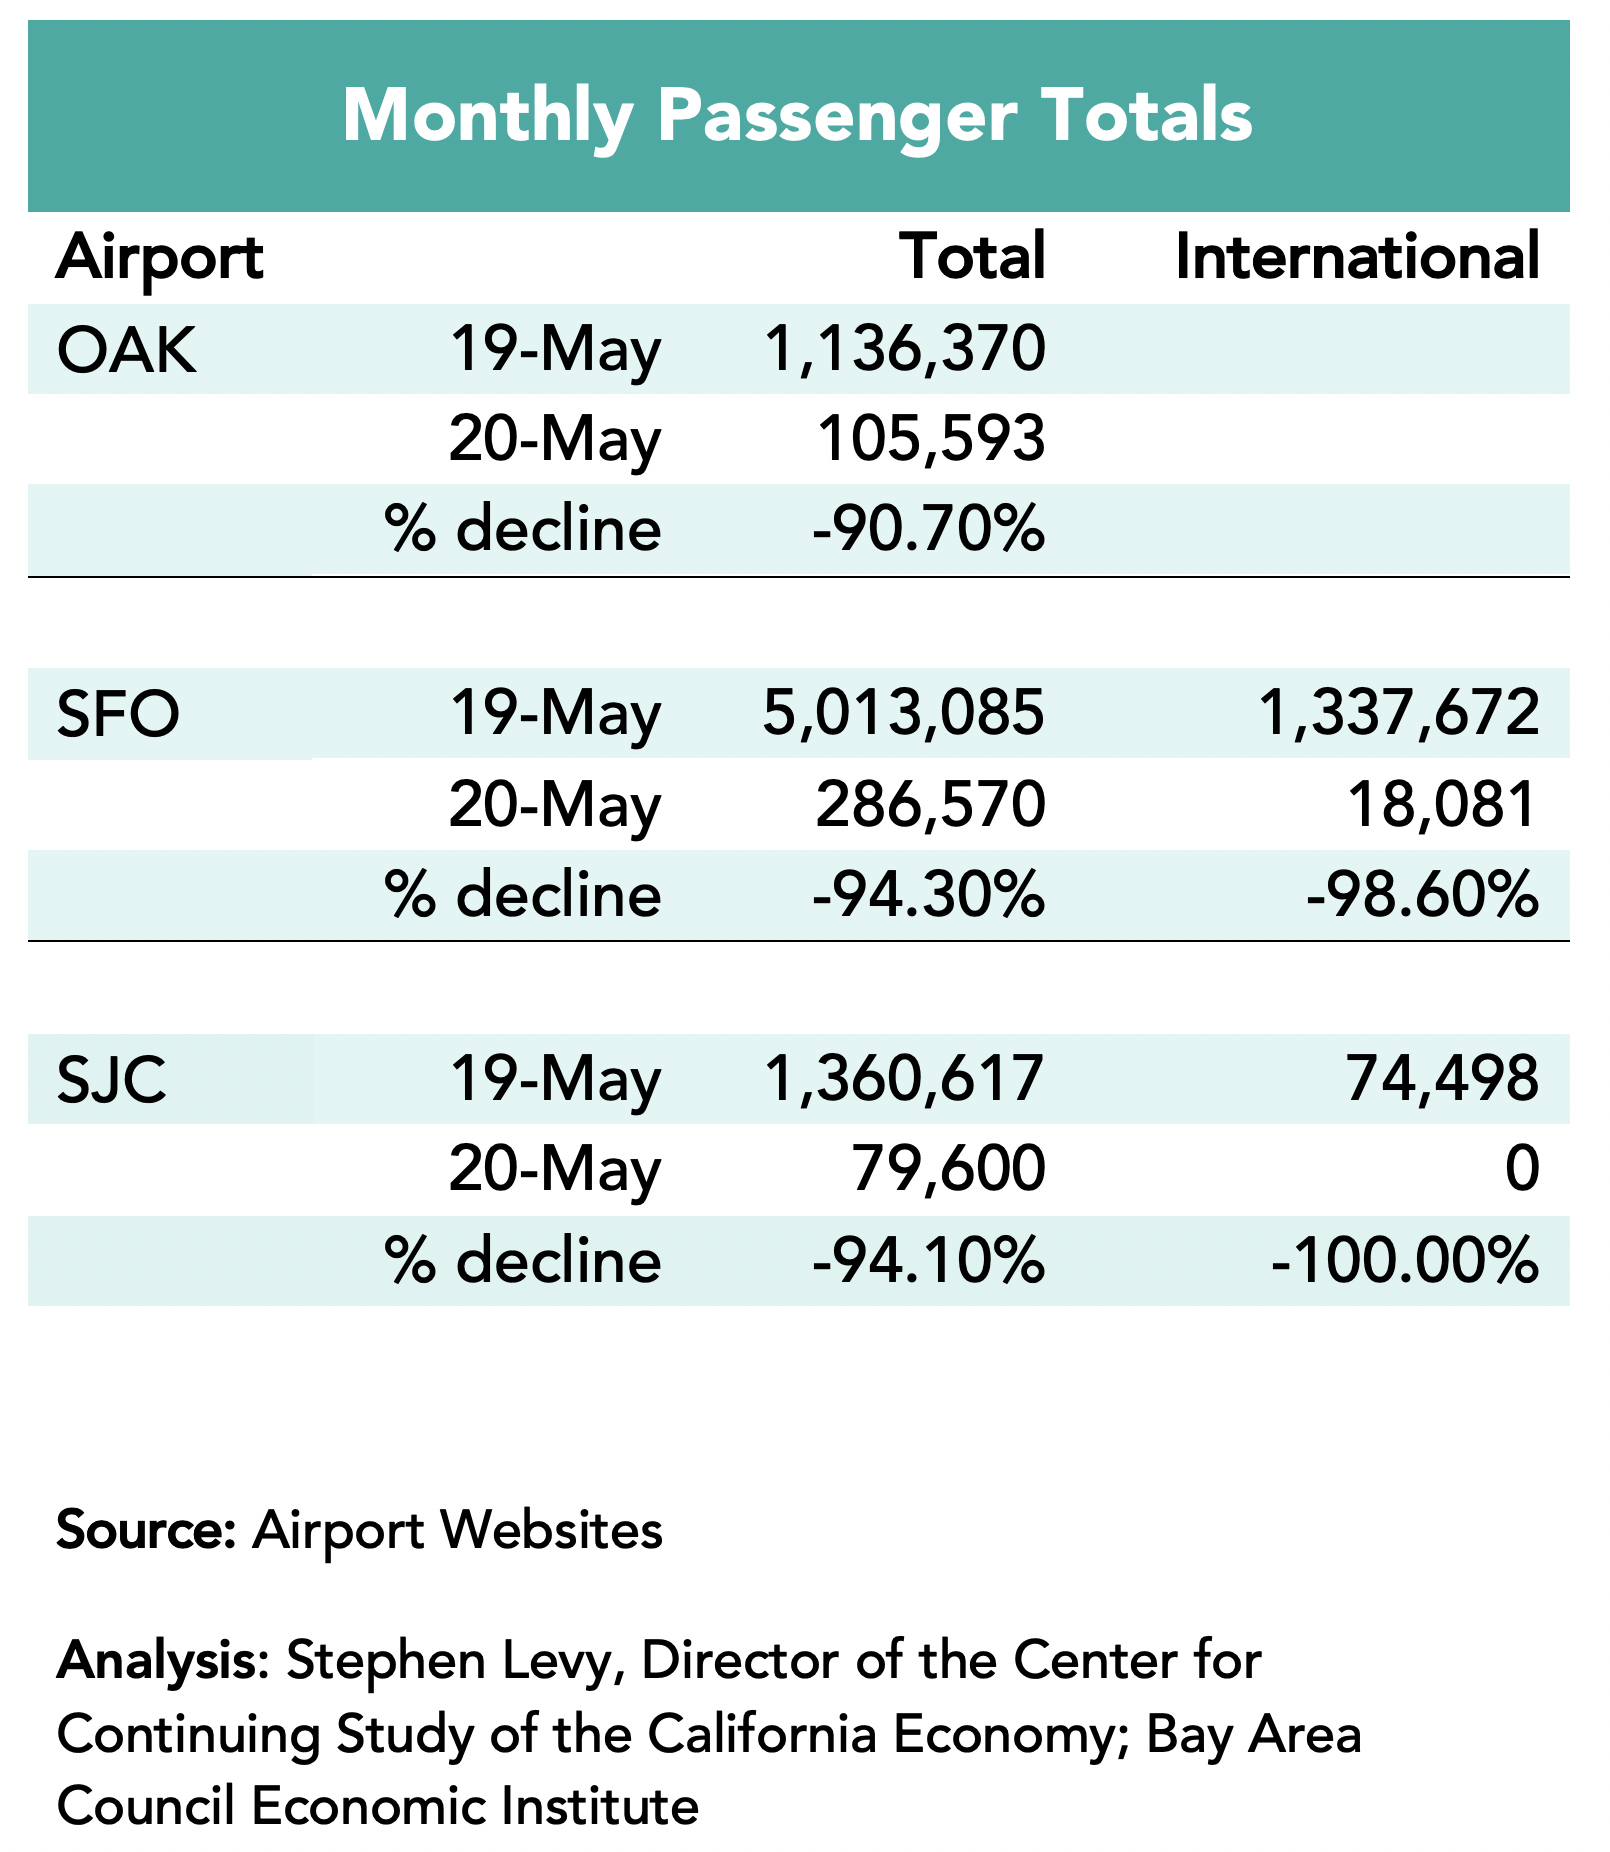
Air Travel Up but Well Below Pre-Pandemic Levels in the Region
Passenger levels are up over 2021 levels but still well below 2019 totals for the first six months of the year. Bay Area airports trail other regions in California in the recovery to pre-pandemic travel. A part of the reason is the large decline in international travel that is only recently beginning to grow again.
These economic updates are authored by Stephen Levy, Director of the Center for Continuing Study of the California Economy, and a member of the Bay Area Council Economic Institute board.
August 18, 2022
With the economy in flux and the long-term effects of remote work still unknown, it’s fair to ask how the Bay Area – as the world’s leading hub for technology, entrepreneurship and innovation – is faring. In this commentary in the Times of India, Bay Area Council Economic Institute Senior Director Sean Randolph examines the hints provided from the current snapshot
The Bay Area Council and Bay Area Council Economic Institute understand well the importance of our region’s connections to the world in supporting and growing our innovation economy. In this commentary in the Silicon Valley Business Journal, Bay Area Council Economic Institute Senior Director Sean Randolph examines these connections and why they remain strong even during these turbulent economic times.
Payroll Job Growth Slumps but That is Not the Whole Story
June 27, 2022
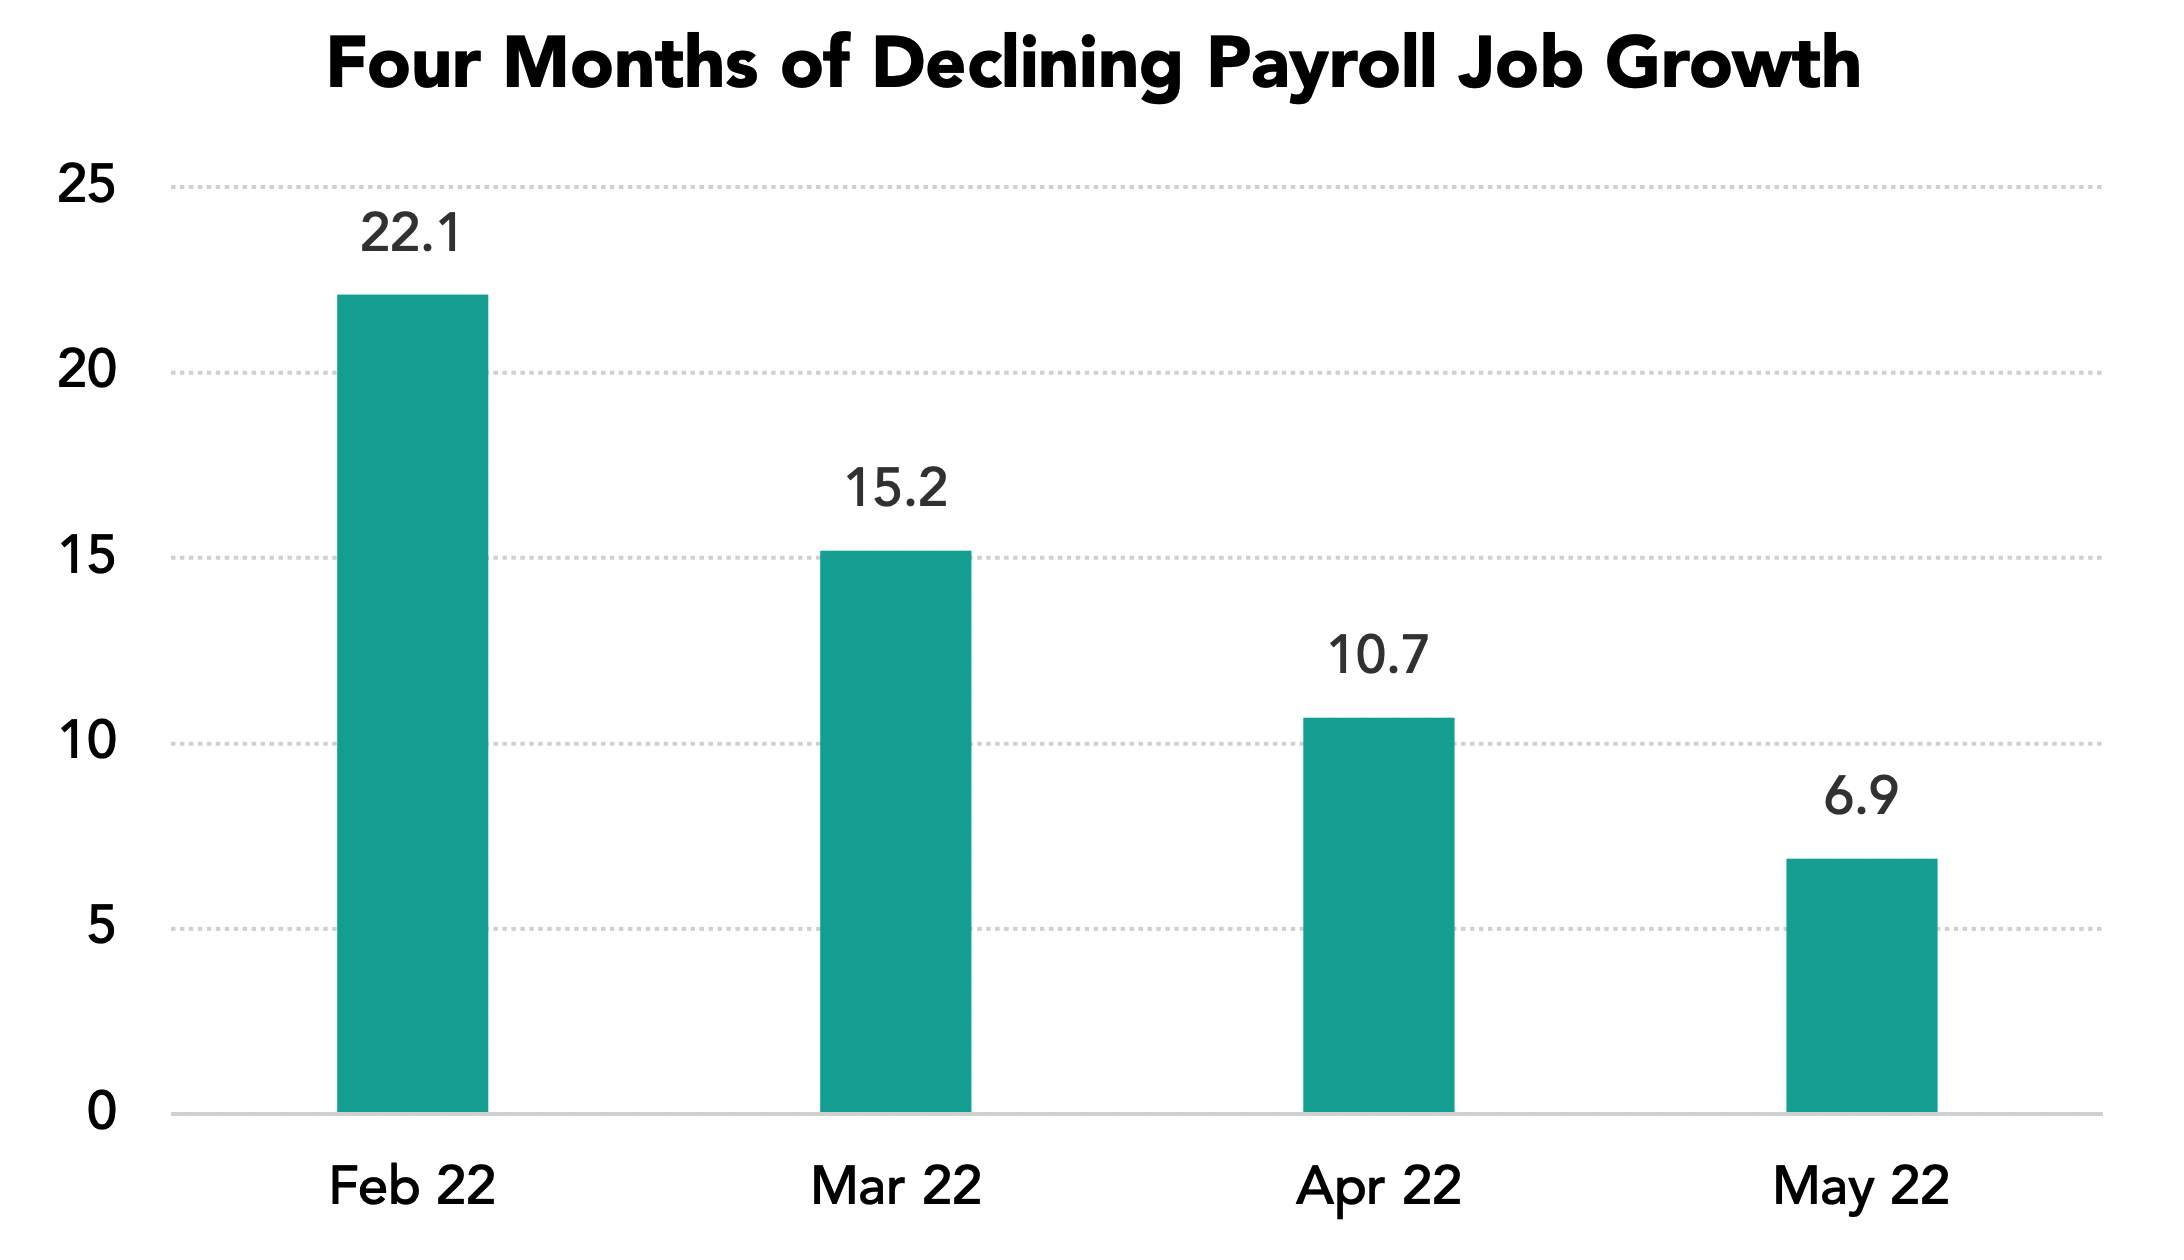
The Bay Area added 6,900 payroll jobs in May with substantial payroll declines in added jobs for each of the past four months. But this is not the full story of what happened in the Bay Area economy in recent months.
The highlights:
• Payroll job growth declined from 22,100 in February to 6,900 in May for a four month gain of 59,900 payroll jobs.
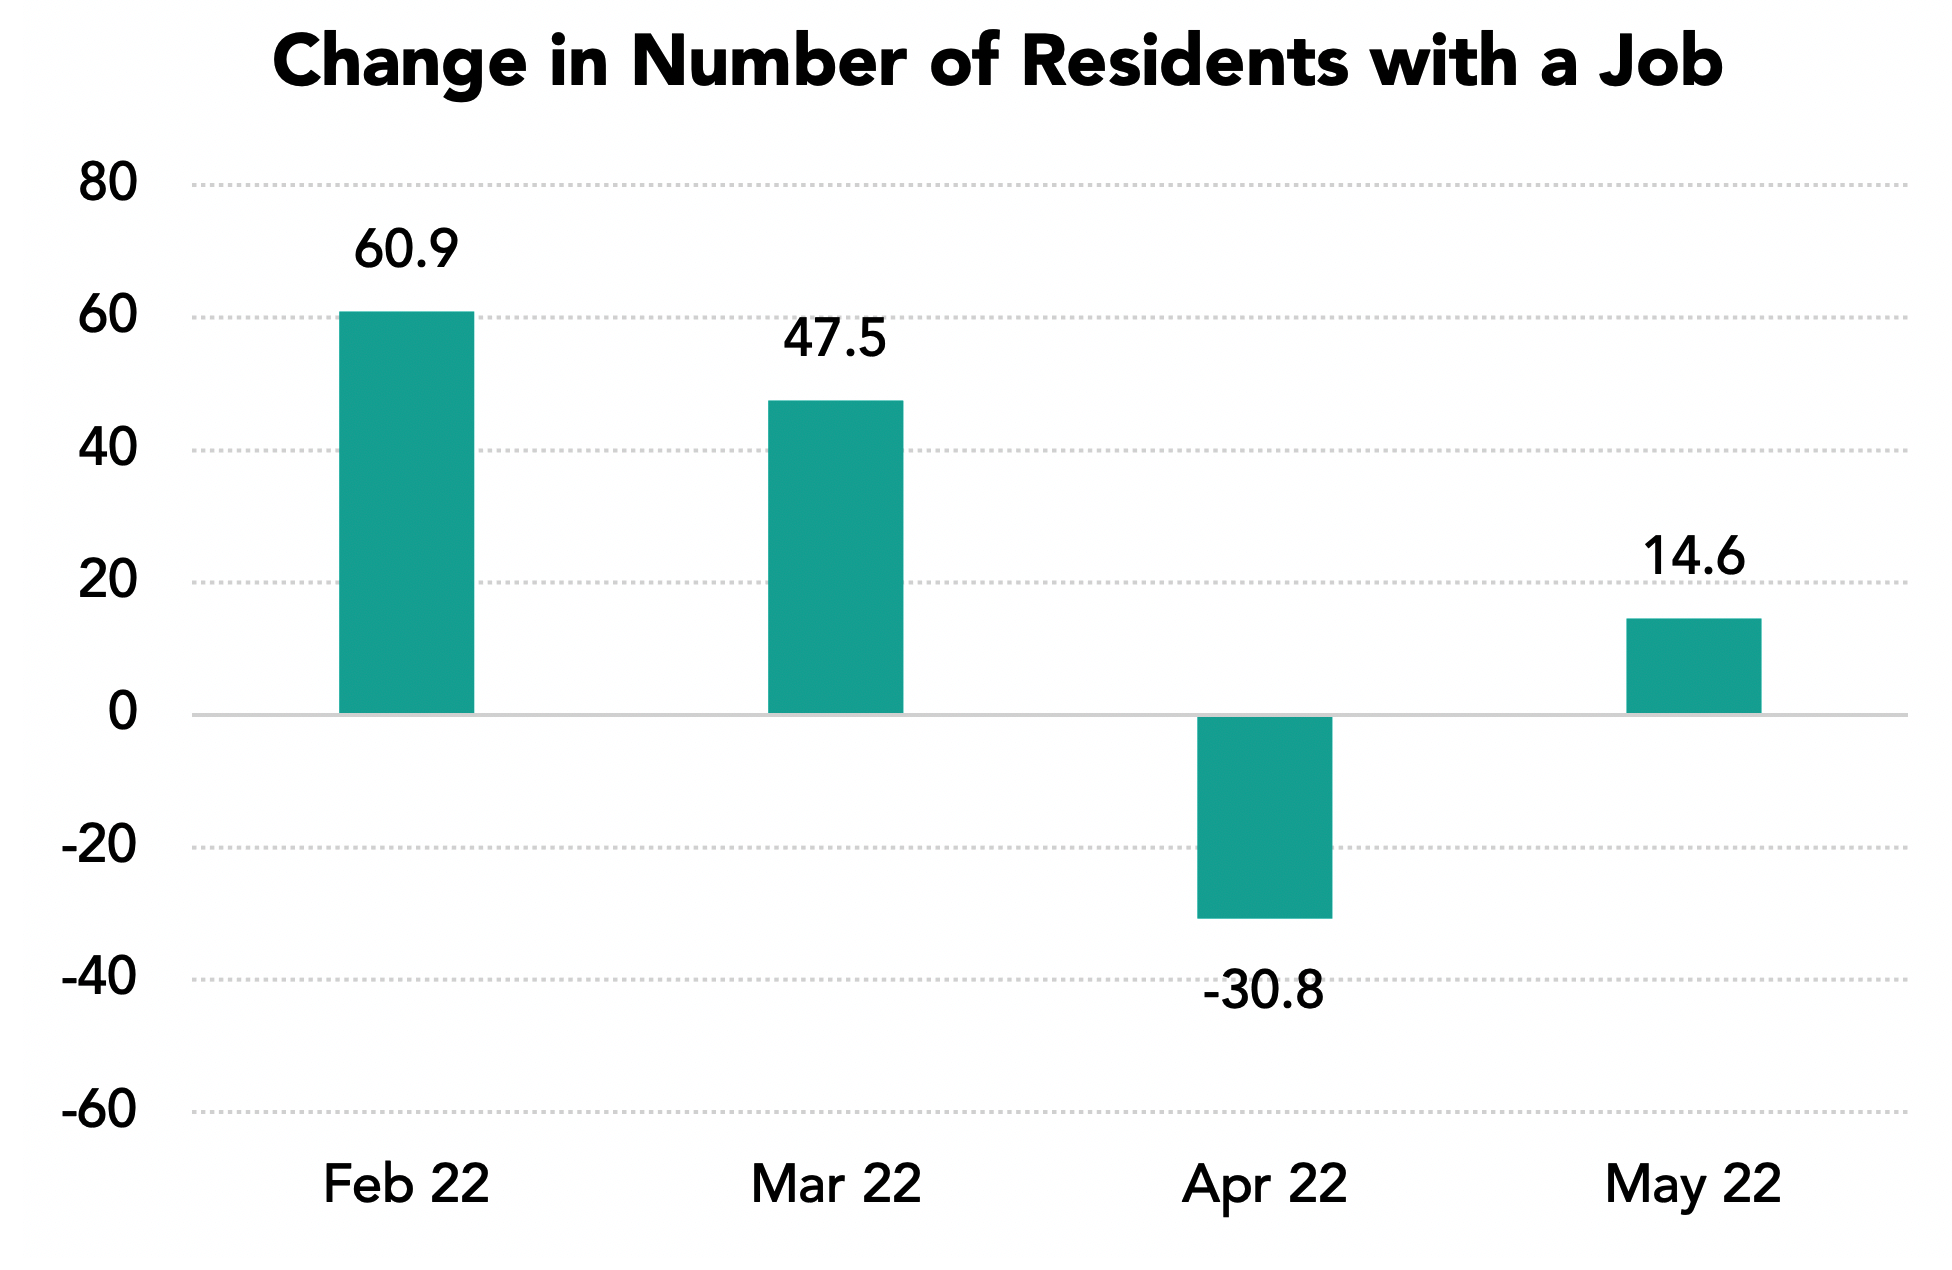
• During this period the number of residents with jobs of all kinds increased by 92,200.
• In May Bay Area unemployment levels and unemployment rates fell to record lows.
• April 2022 brings major crosscurrents to the global, national and regional economy with the Russian invasion of Ukraine, rising interest rates amidst continuing high inflation and the ongoing Bay Area challenges of housing, transportation and competitiveness.
• June 2022 brings major challenges to the global, national and regional economy with the Russian invasion of Ukraine, large increases in interest rates amidst continuing high inflation, the recent spike in Bay Area COVID cases and the ongoing Bay Area challenges of housing, transportation and competitiveness.
Four Months of Declining Payroll Job Growth
This is the chart shown in media around the region last weekend and it is accurate. Payroll job growth has declined substantially.
But the Number of Residents with a Job Grew More
These data come from the household survey, which is smaller than the payroll survey and more volatile month to month. But it is accurate over time. The inference is that workers are finding jobs in traditional self-employment and gig work. The discrepancy between payroll job and employed worker growth (59,200 versus 92,200 for the past four months) could be for many reasons. One is the difficulty in hiring in some industries from our high cost of housing. One could be a decline is jobs at tech startups. Workers unable to find jobs in declining sectors may be switching to self-employment.
But these data offer a counterpoint to the disappointing payroll job trends.
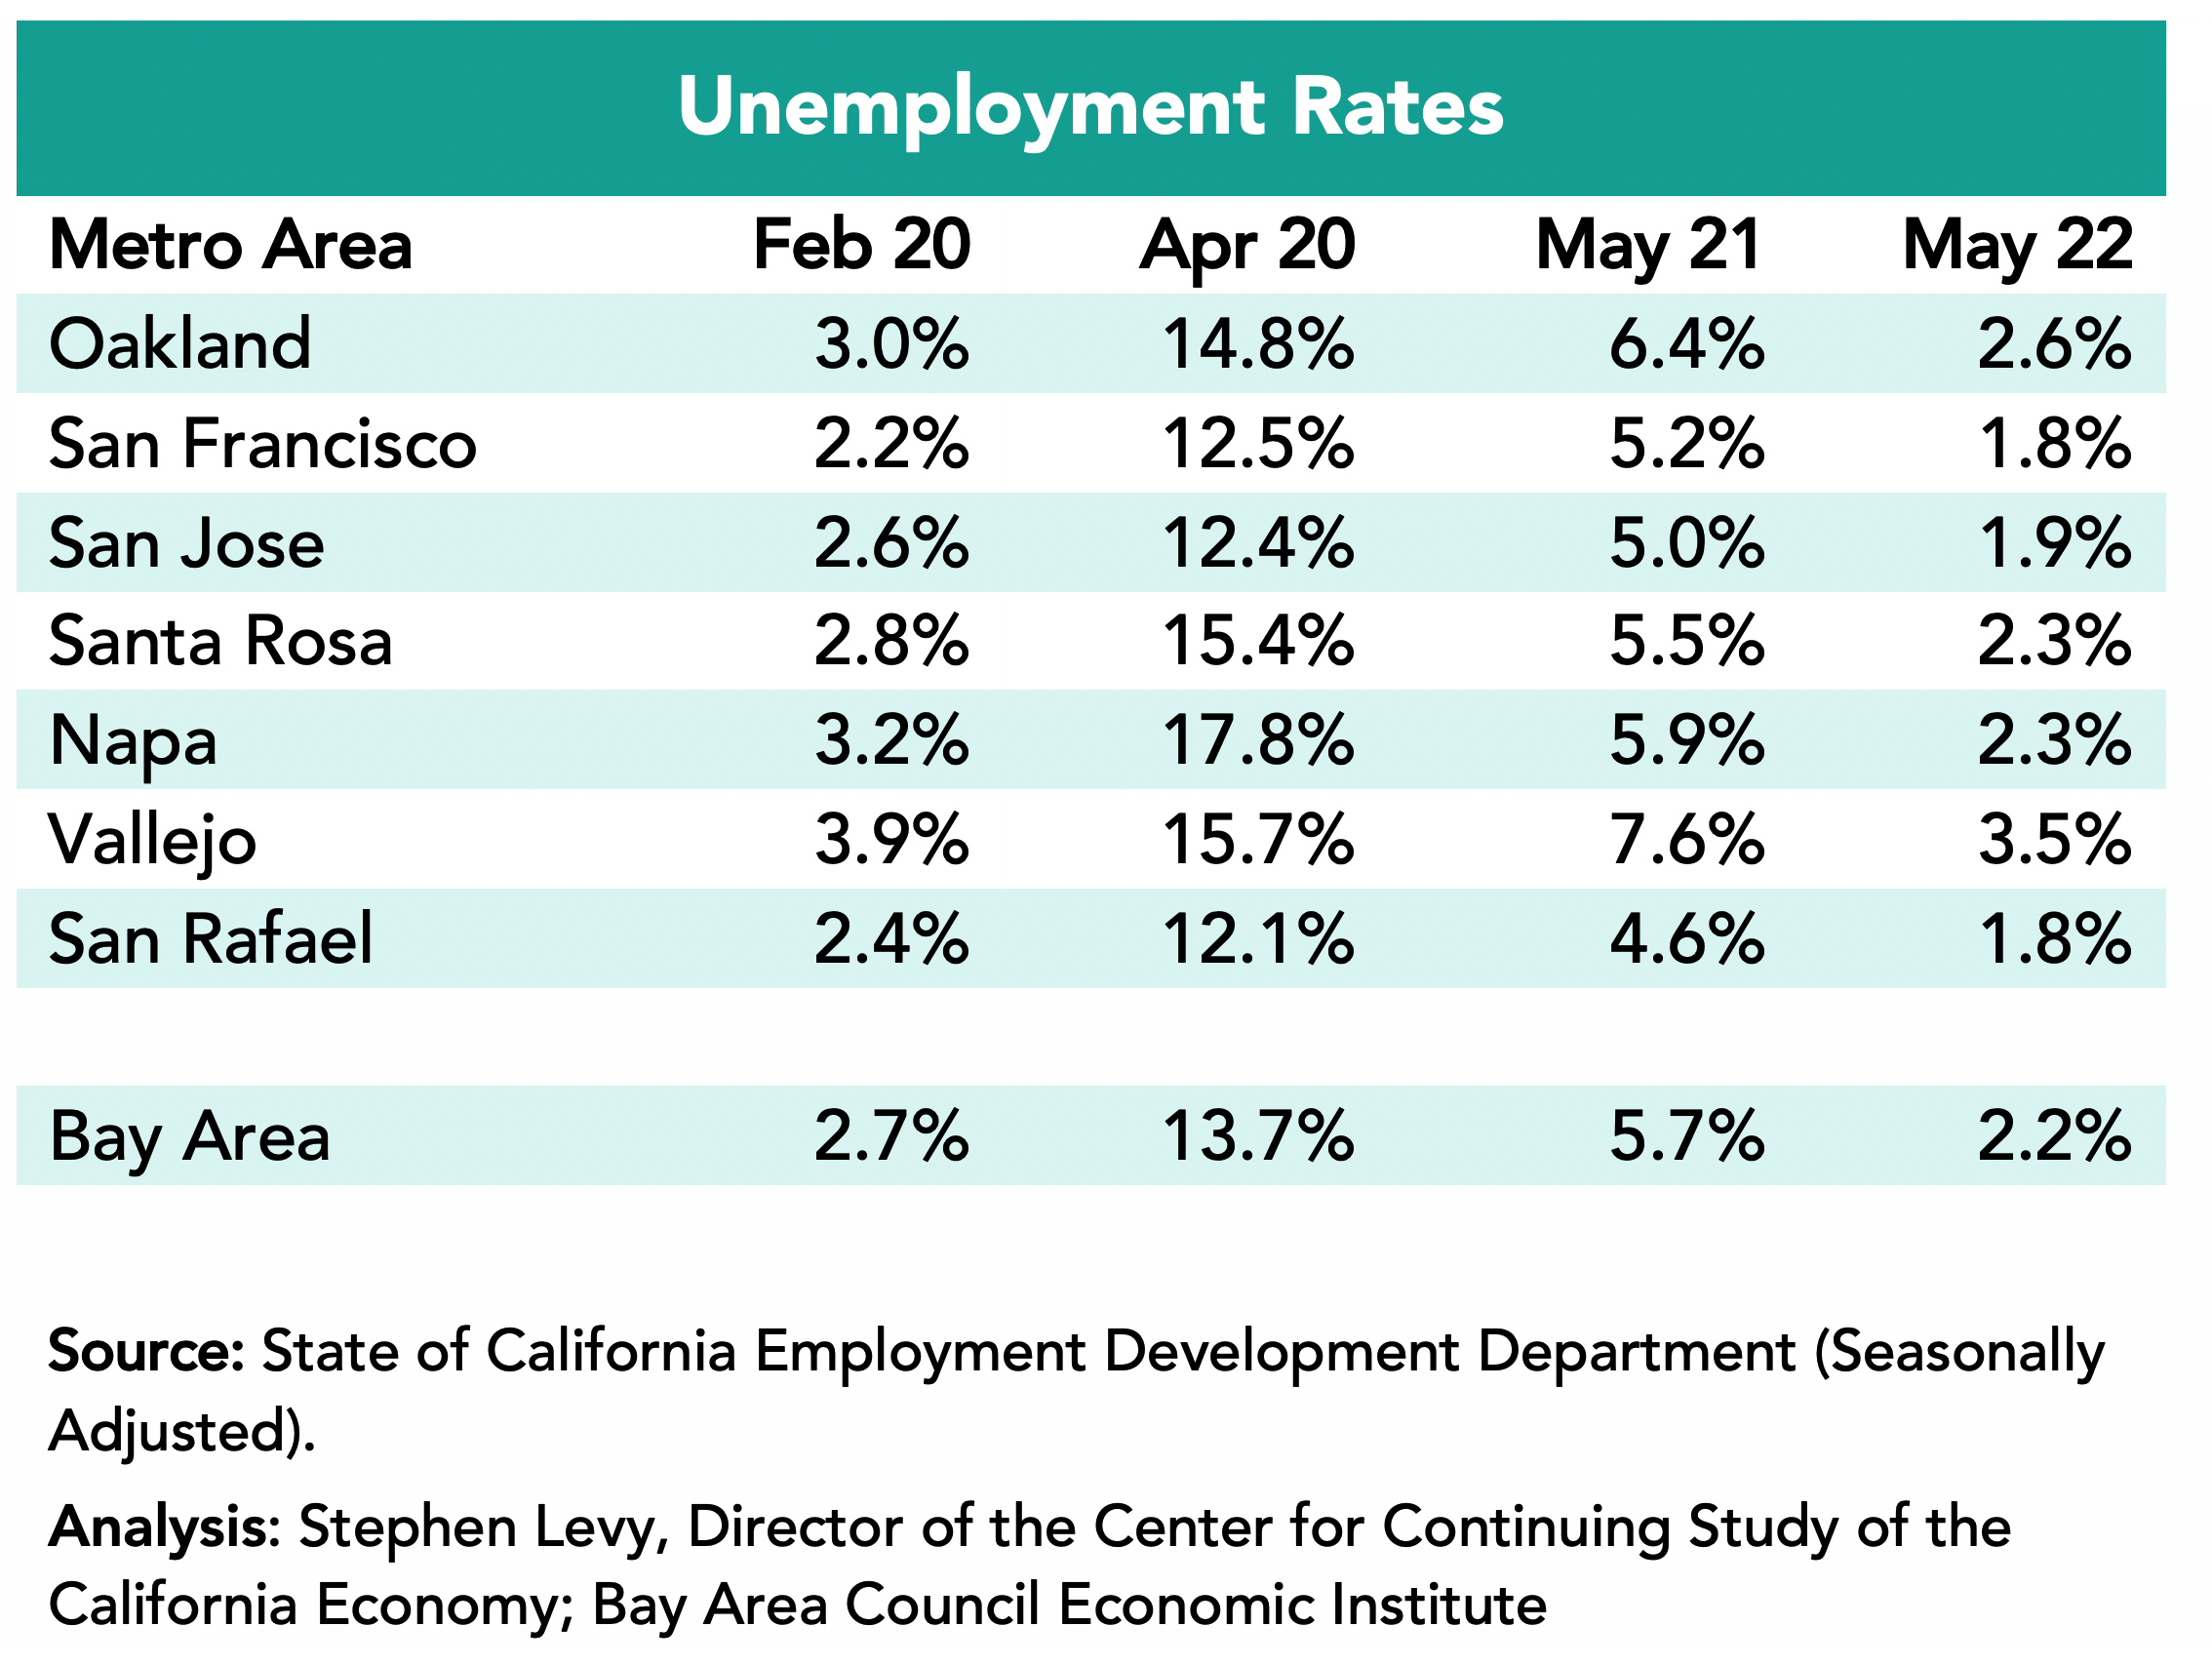
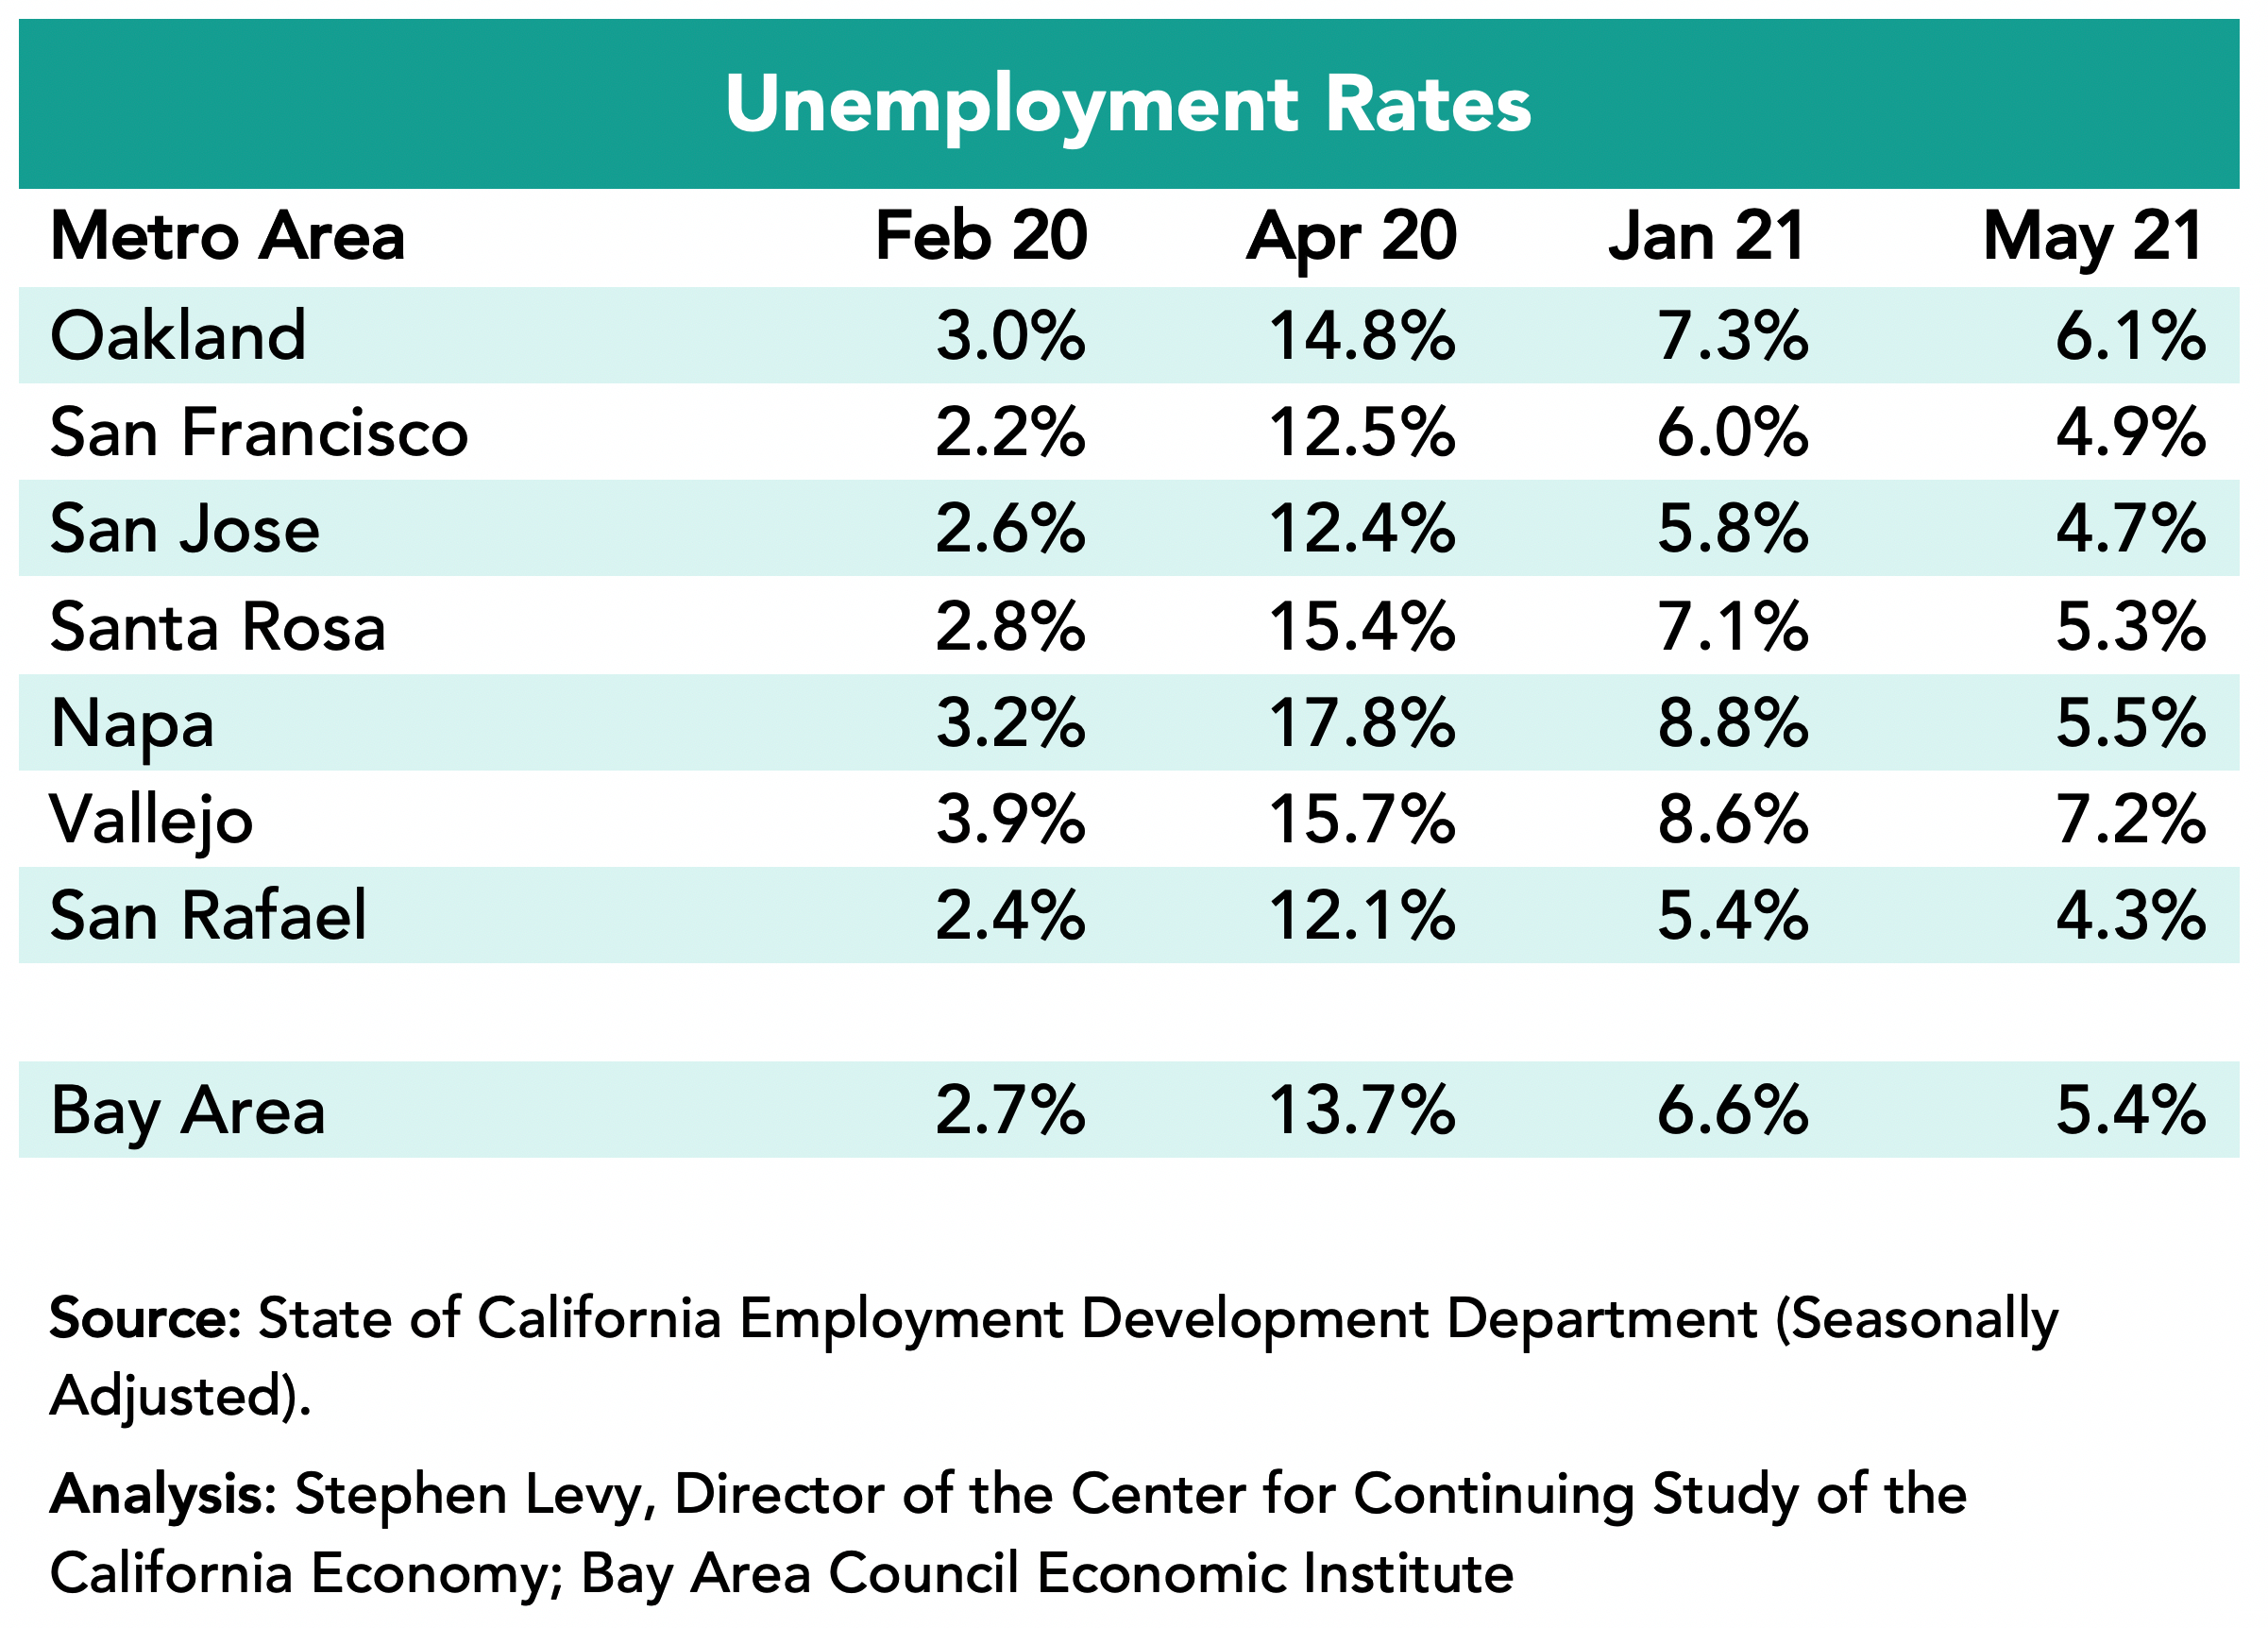
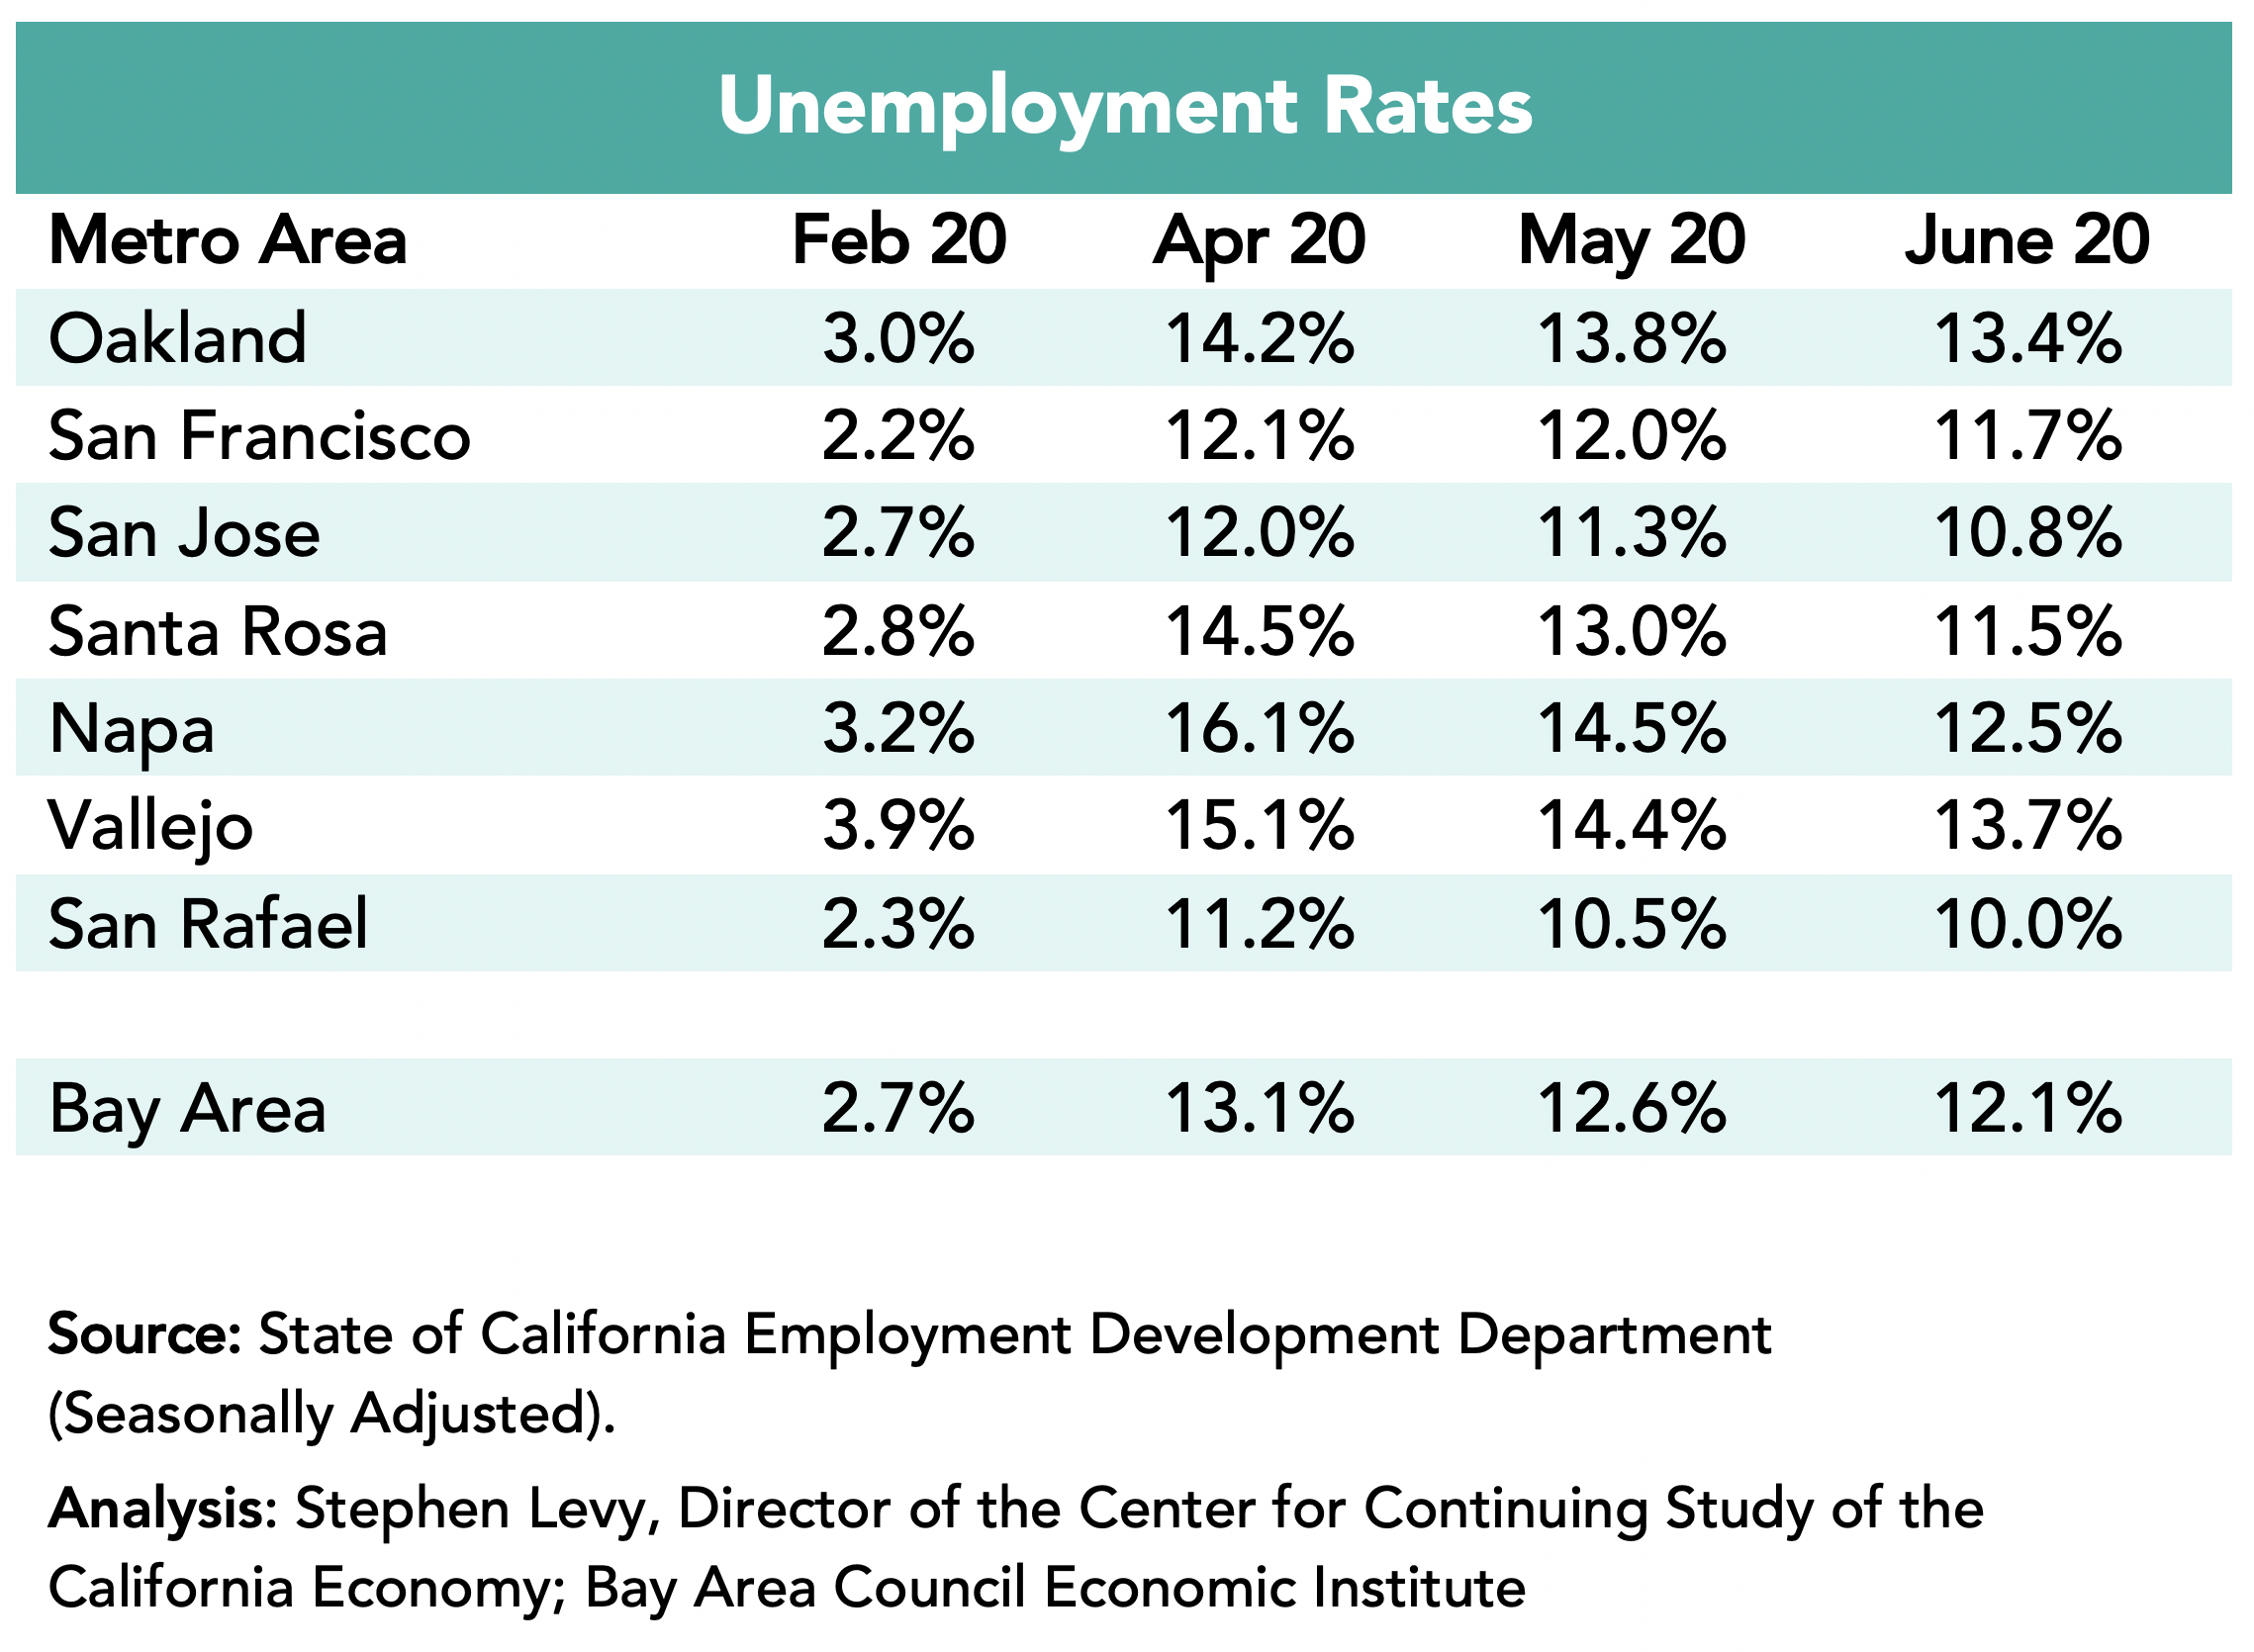
Unemployment Rates Fell to 2.2 in the Region in May 2022 from 5.7% in May 2021 and is now below the pre-pandemic level in February 2020
The lowest rates were in the San Rafael and San Francisco metro areas (1.8%) followed by the San Jose metro areas (1.9%) in May 2022.
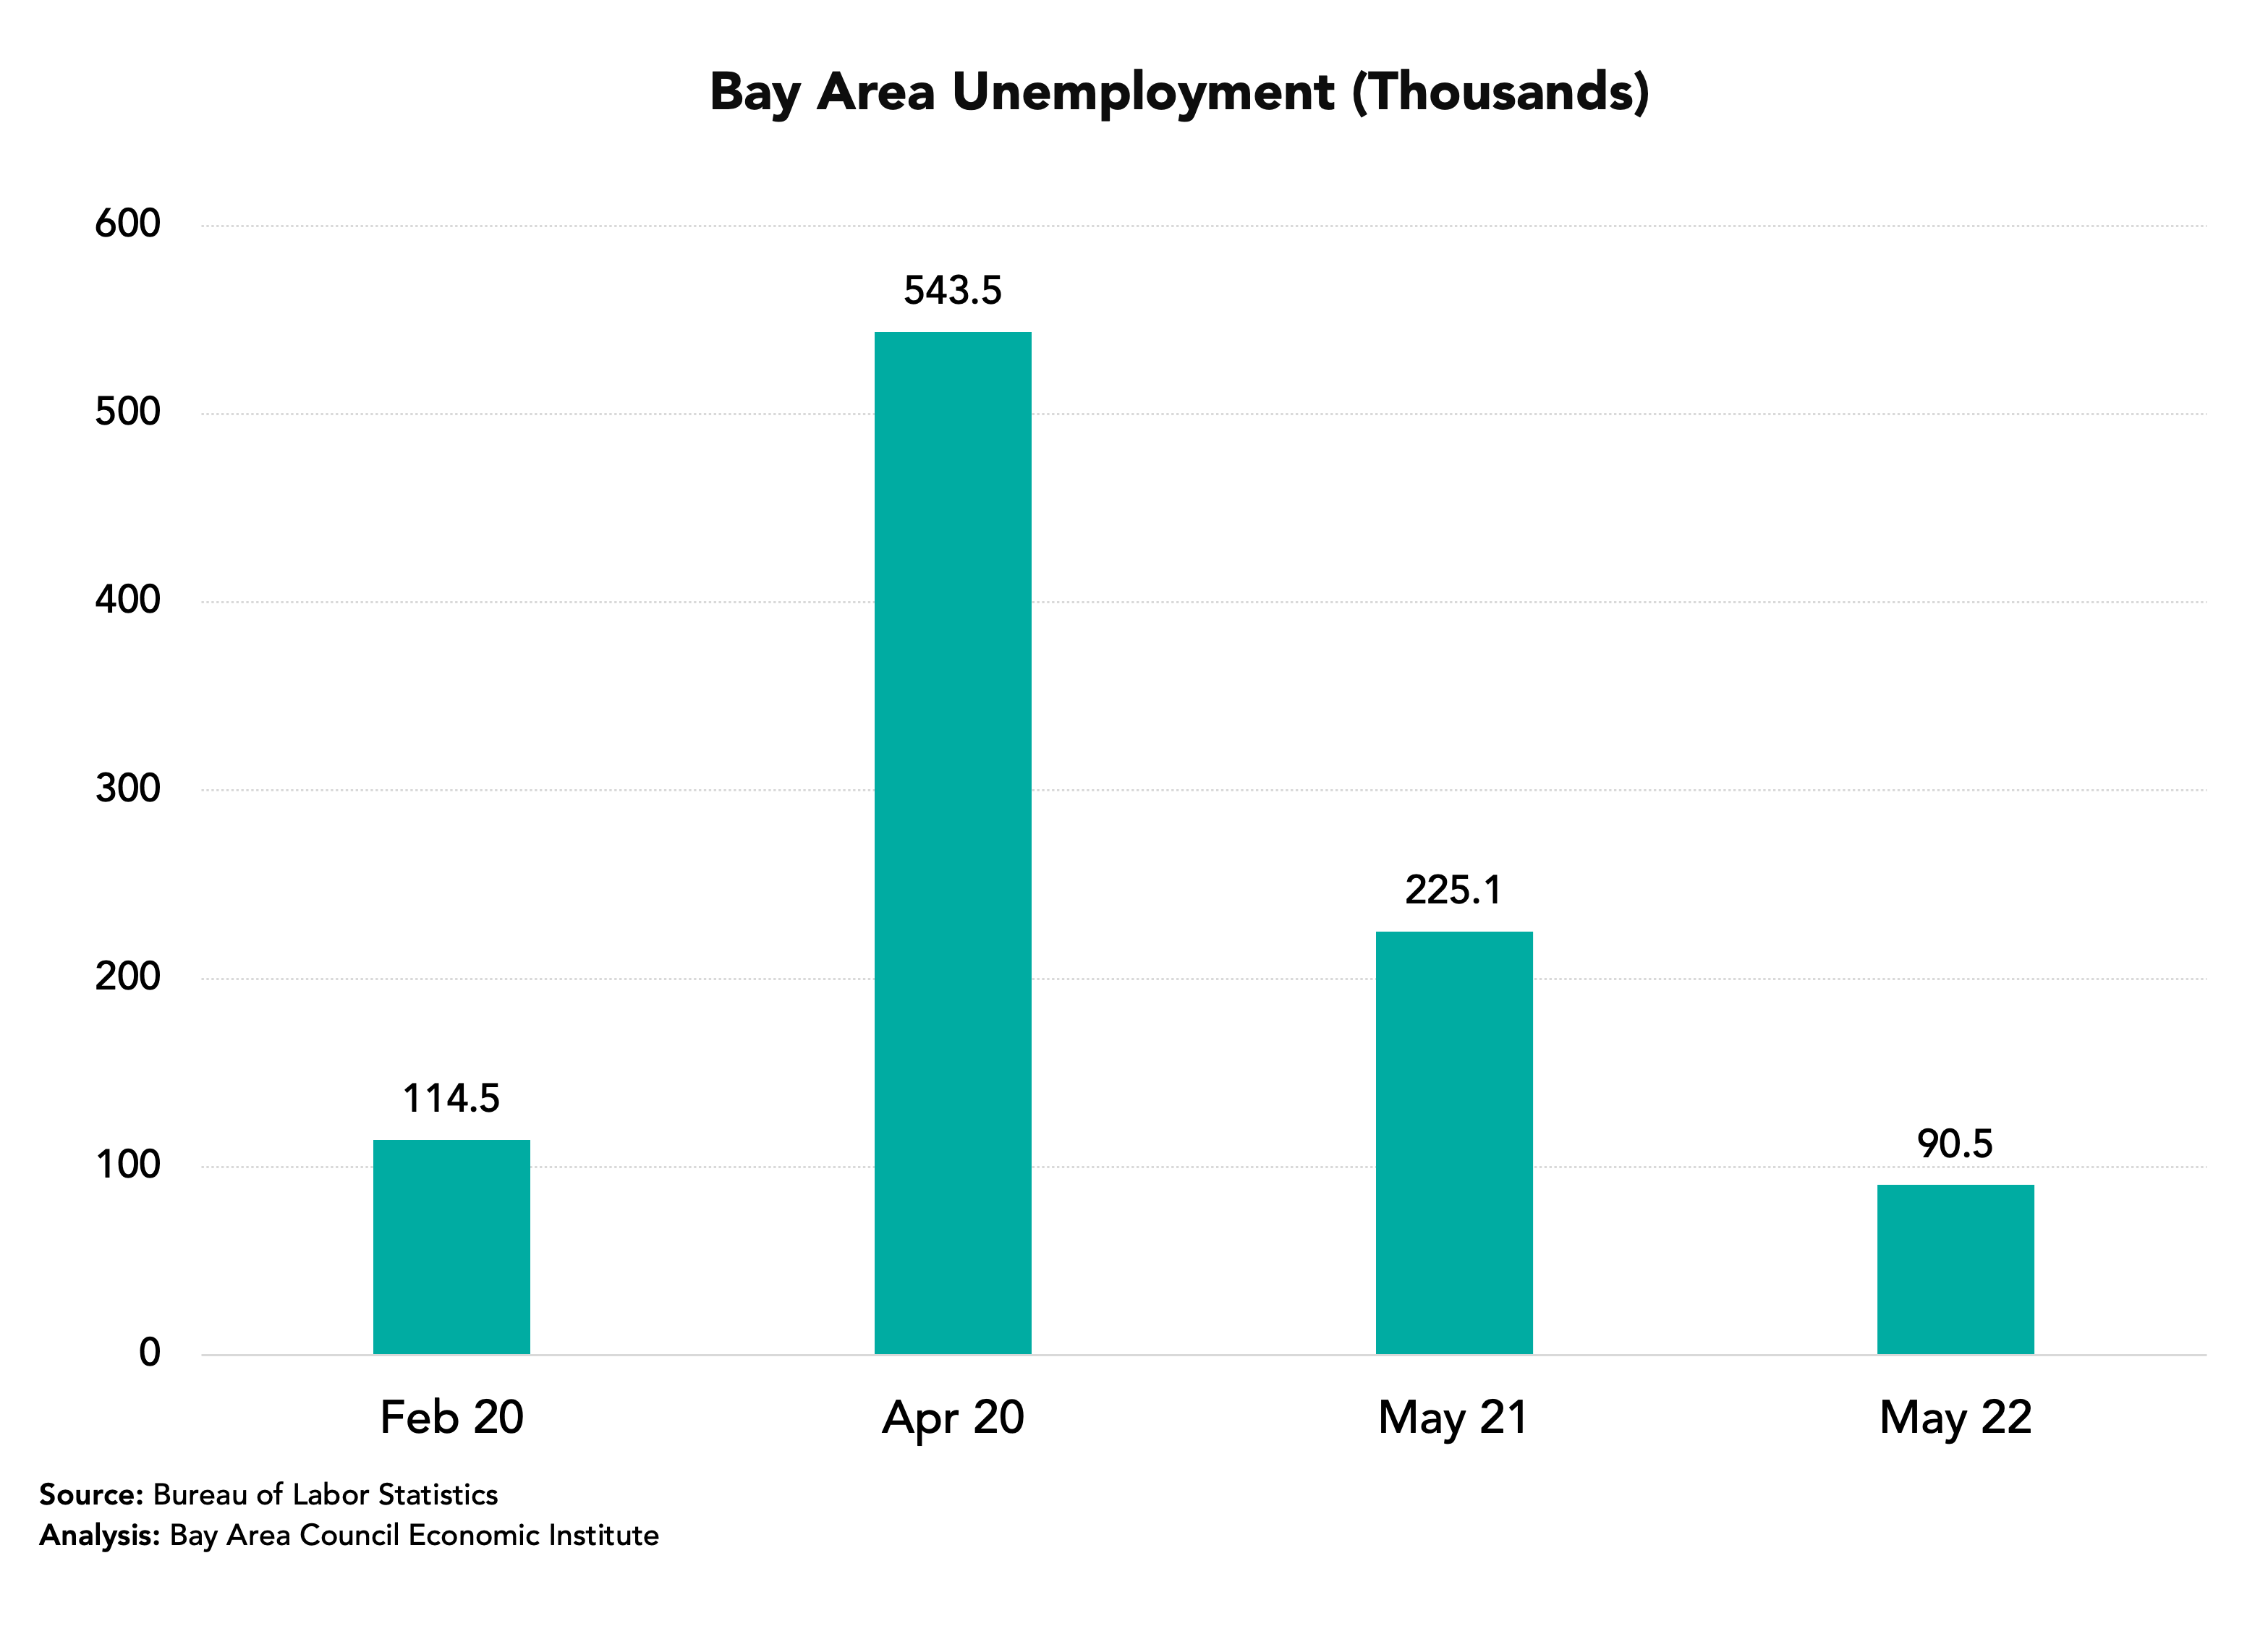
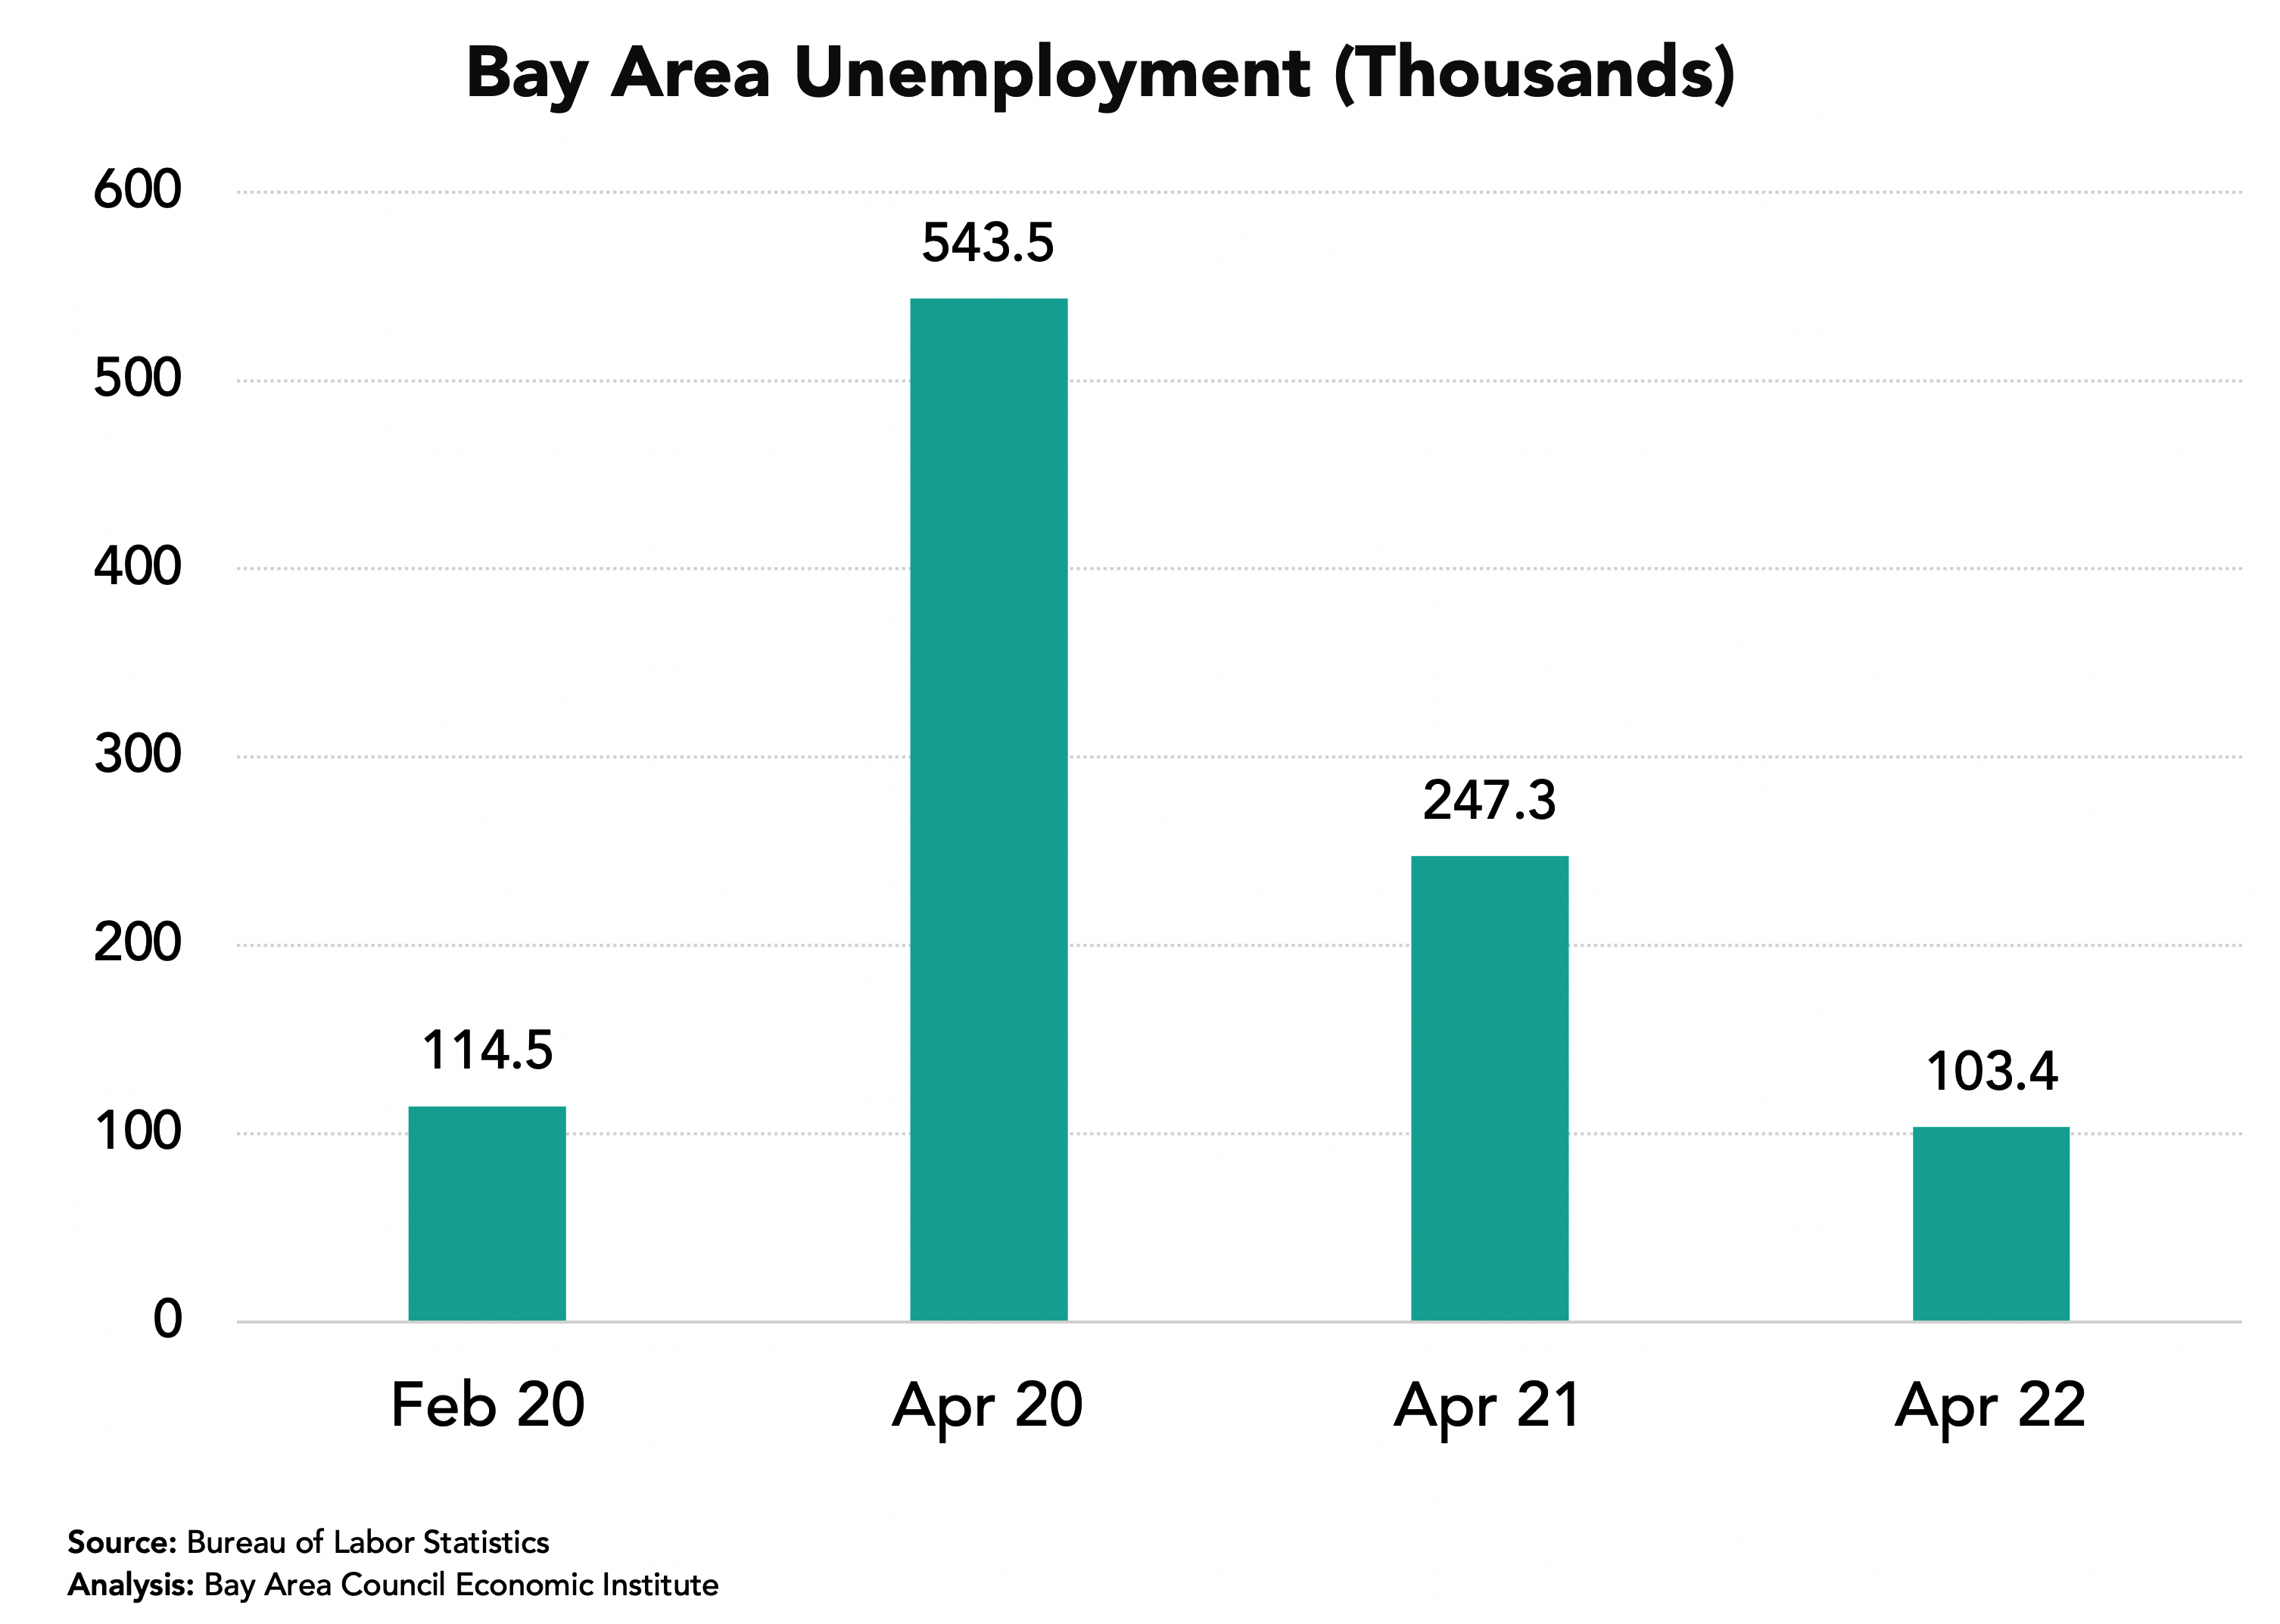
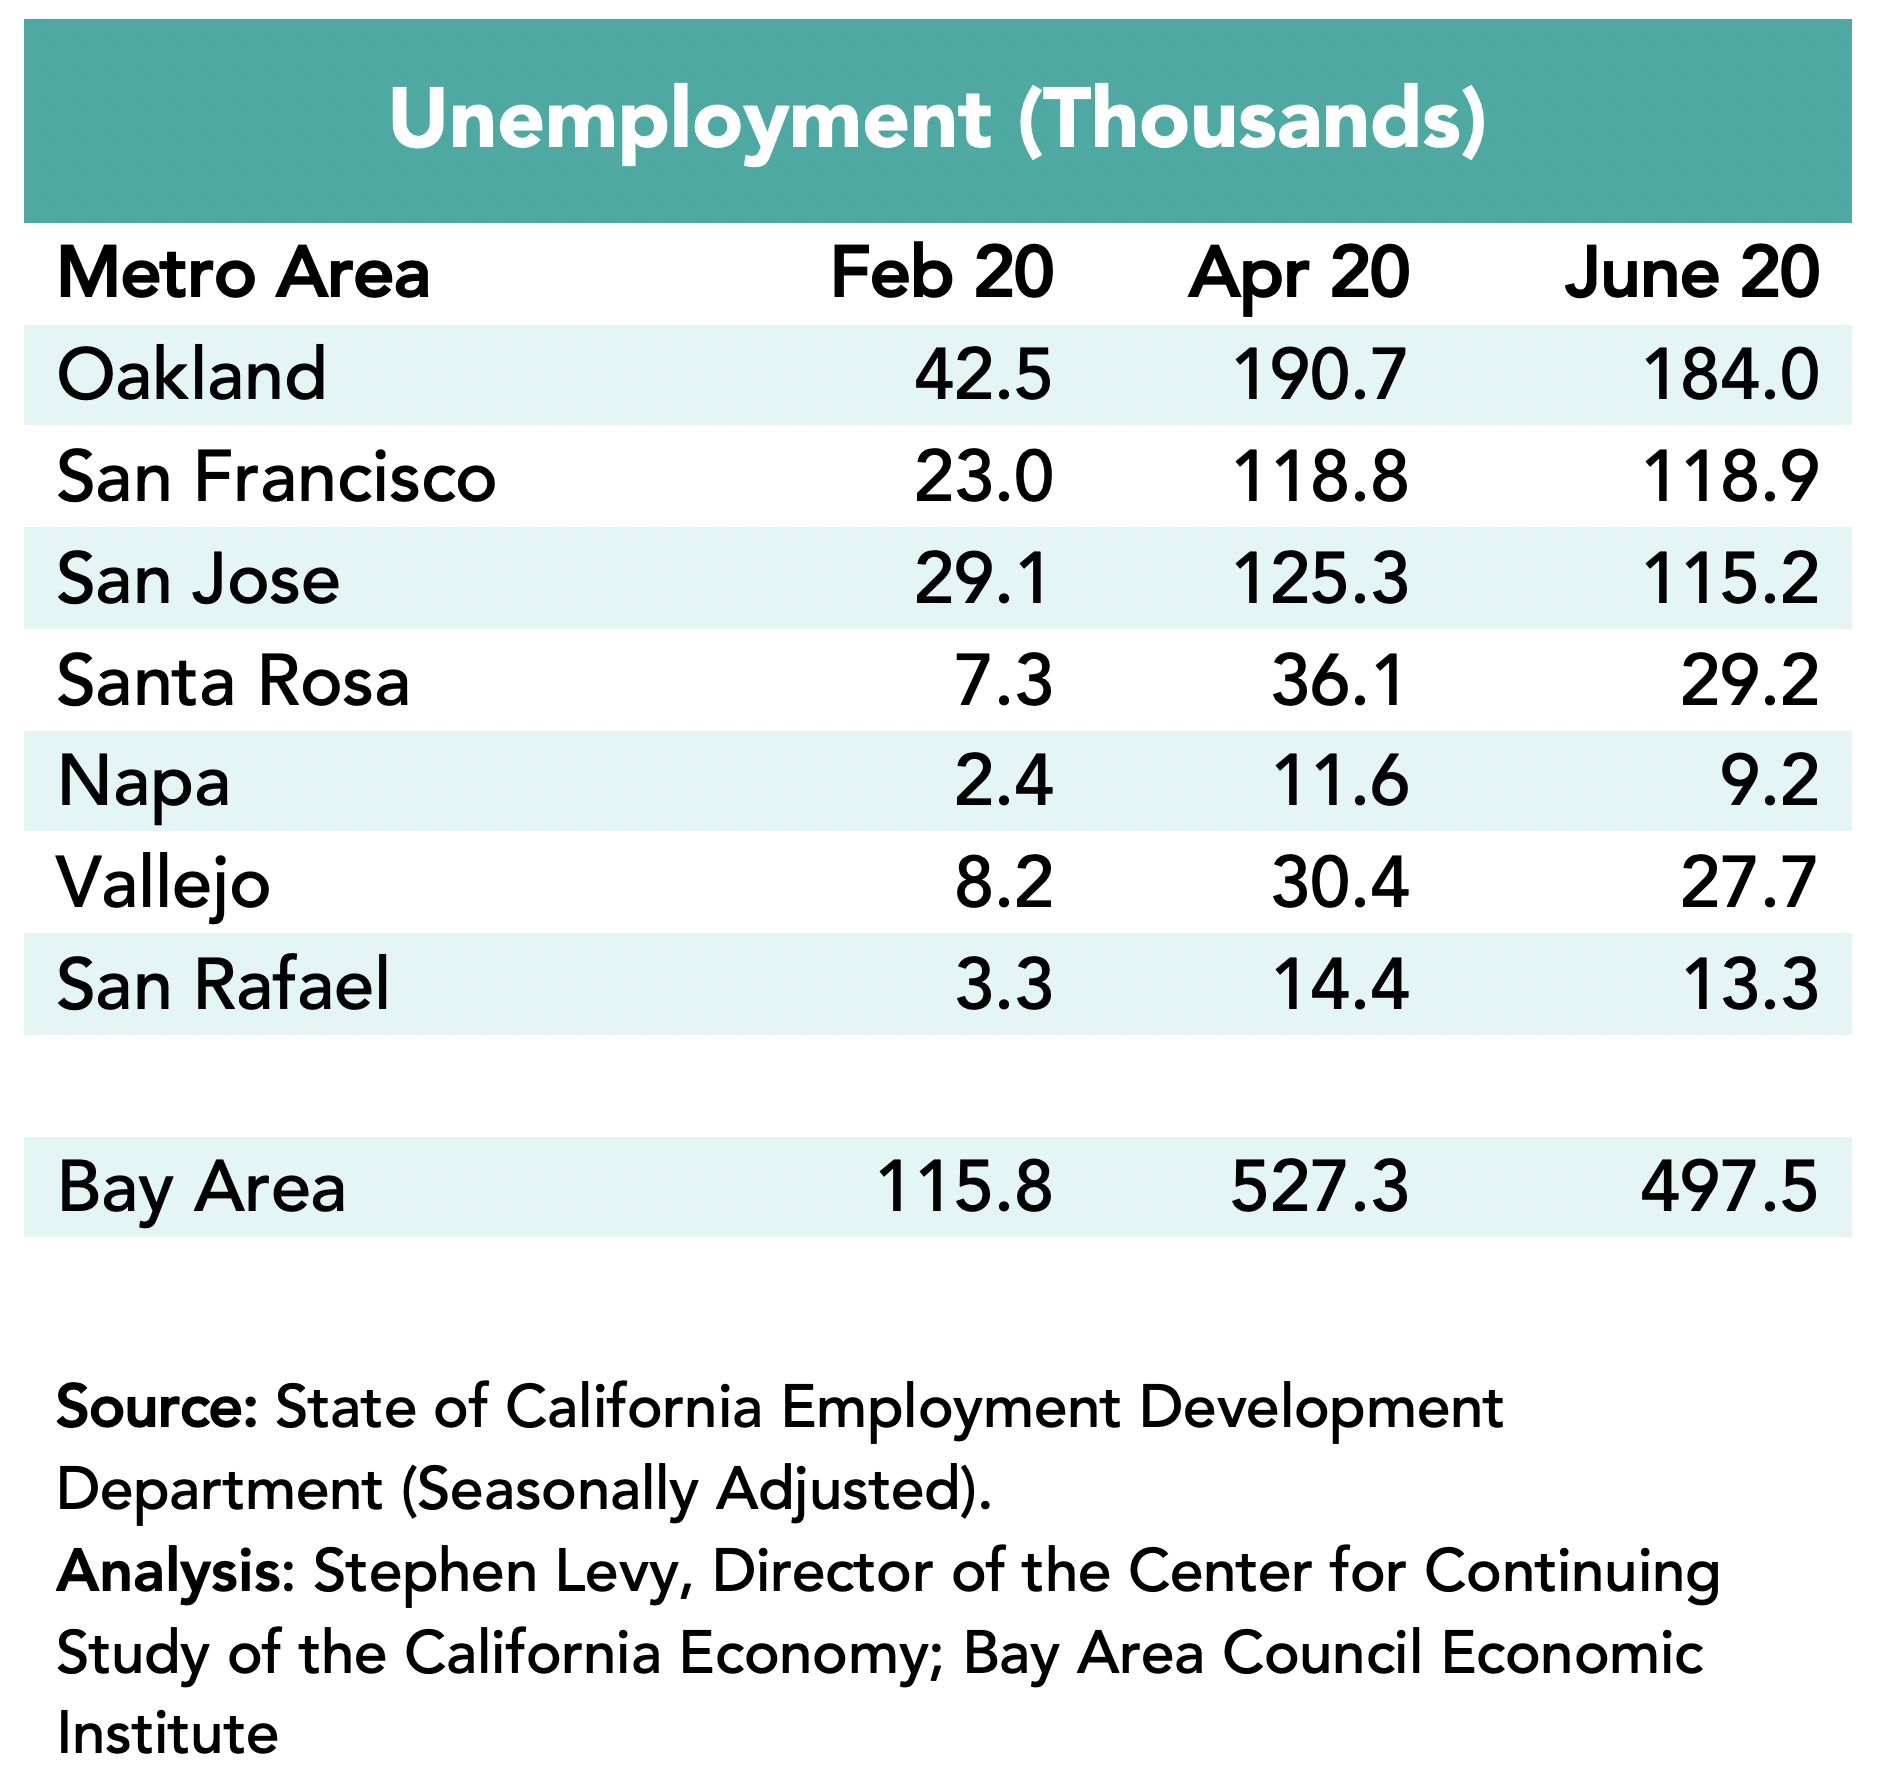
The number of unemployed residents has fallen sharply from the April 2020 high of 543,500 to 90,500 in May 2022 well below the pre-pandemic level in February 2020.
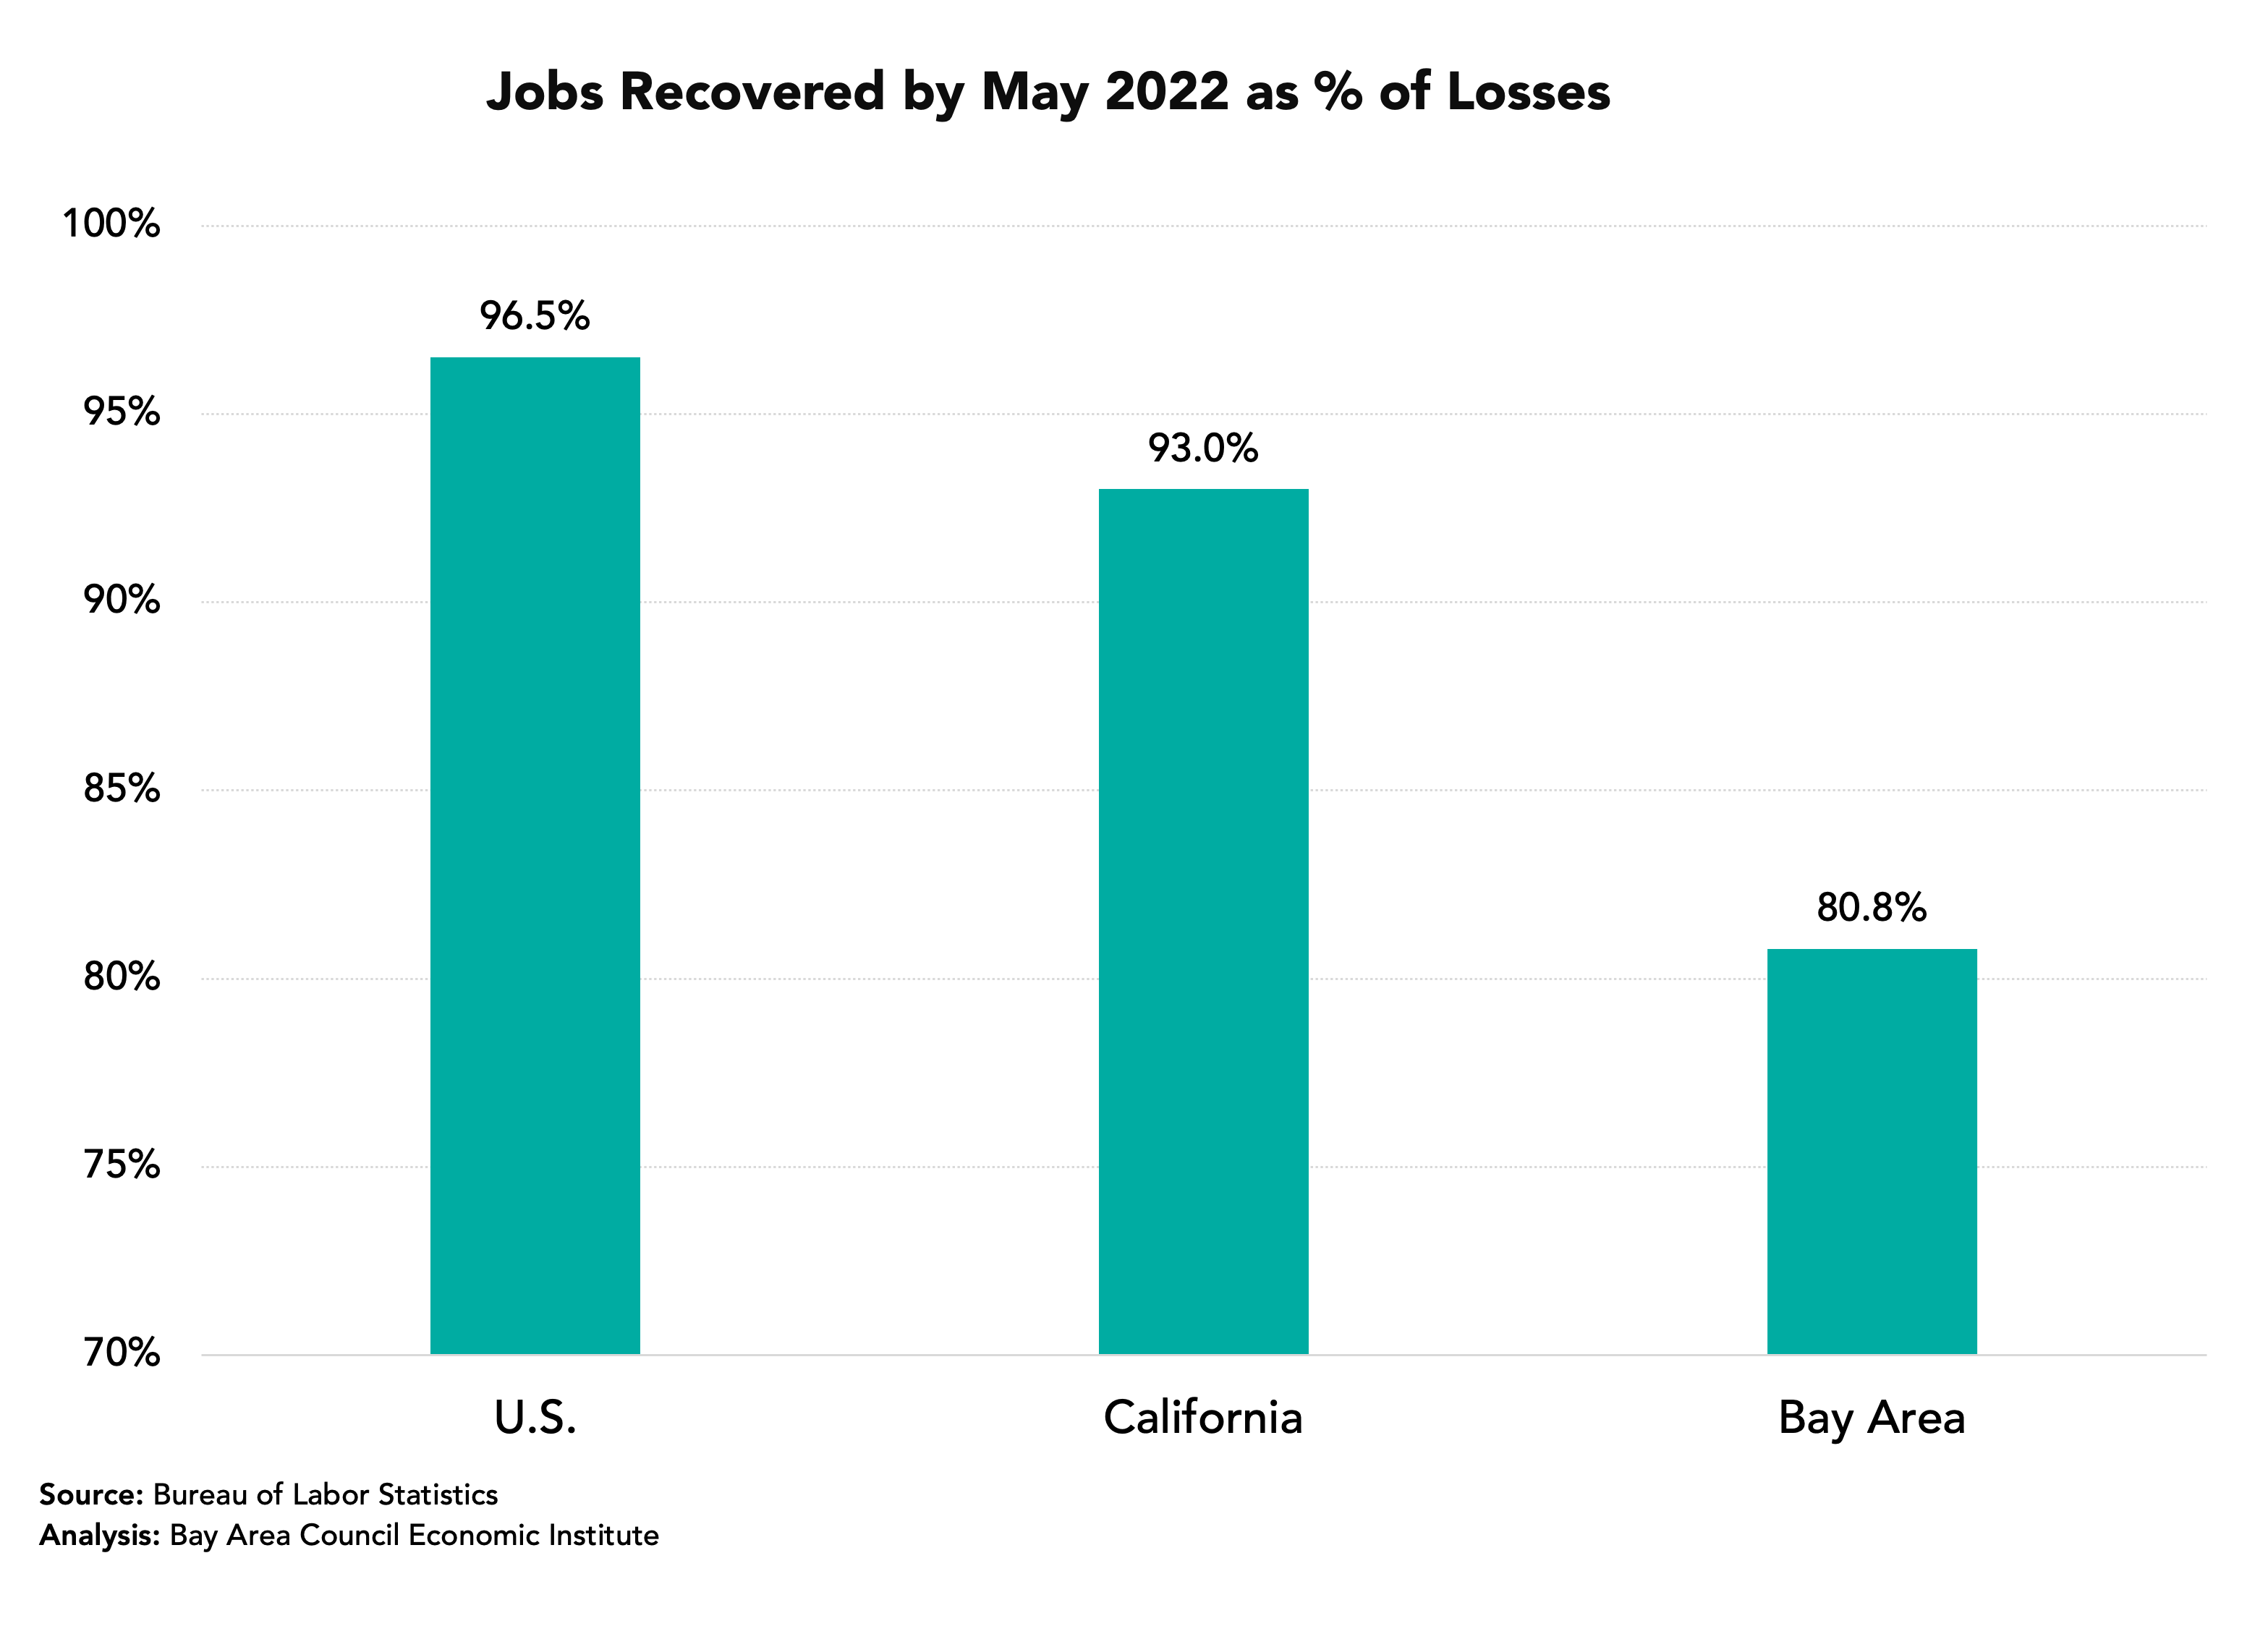
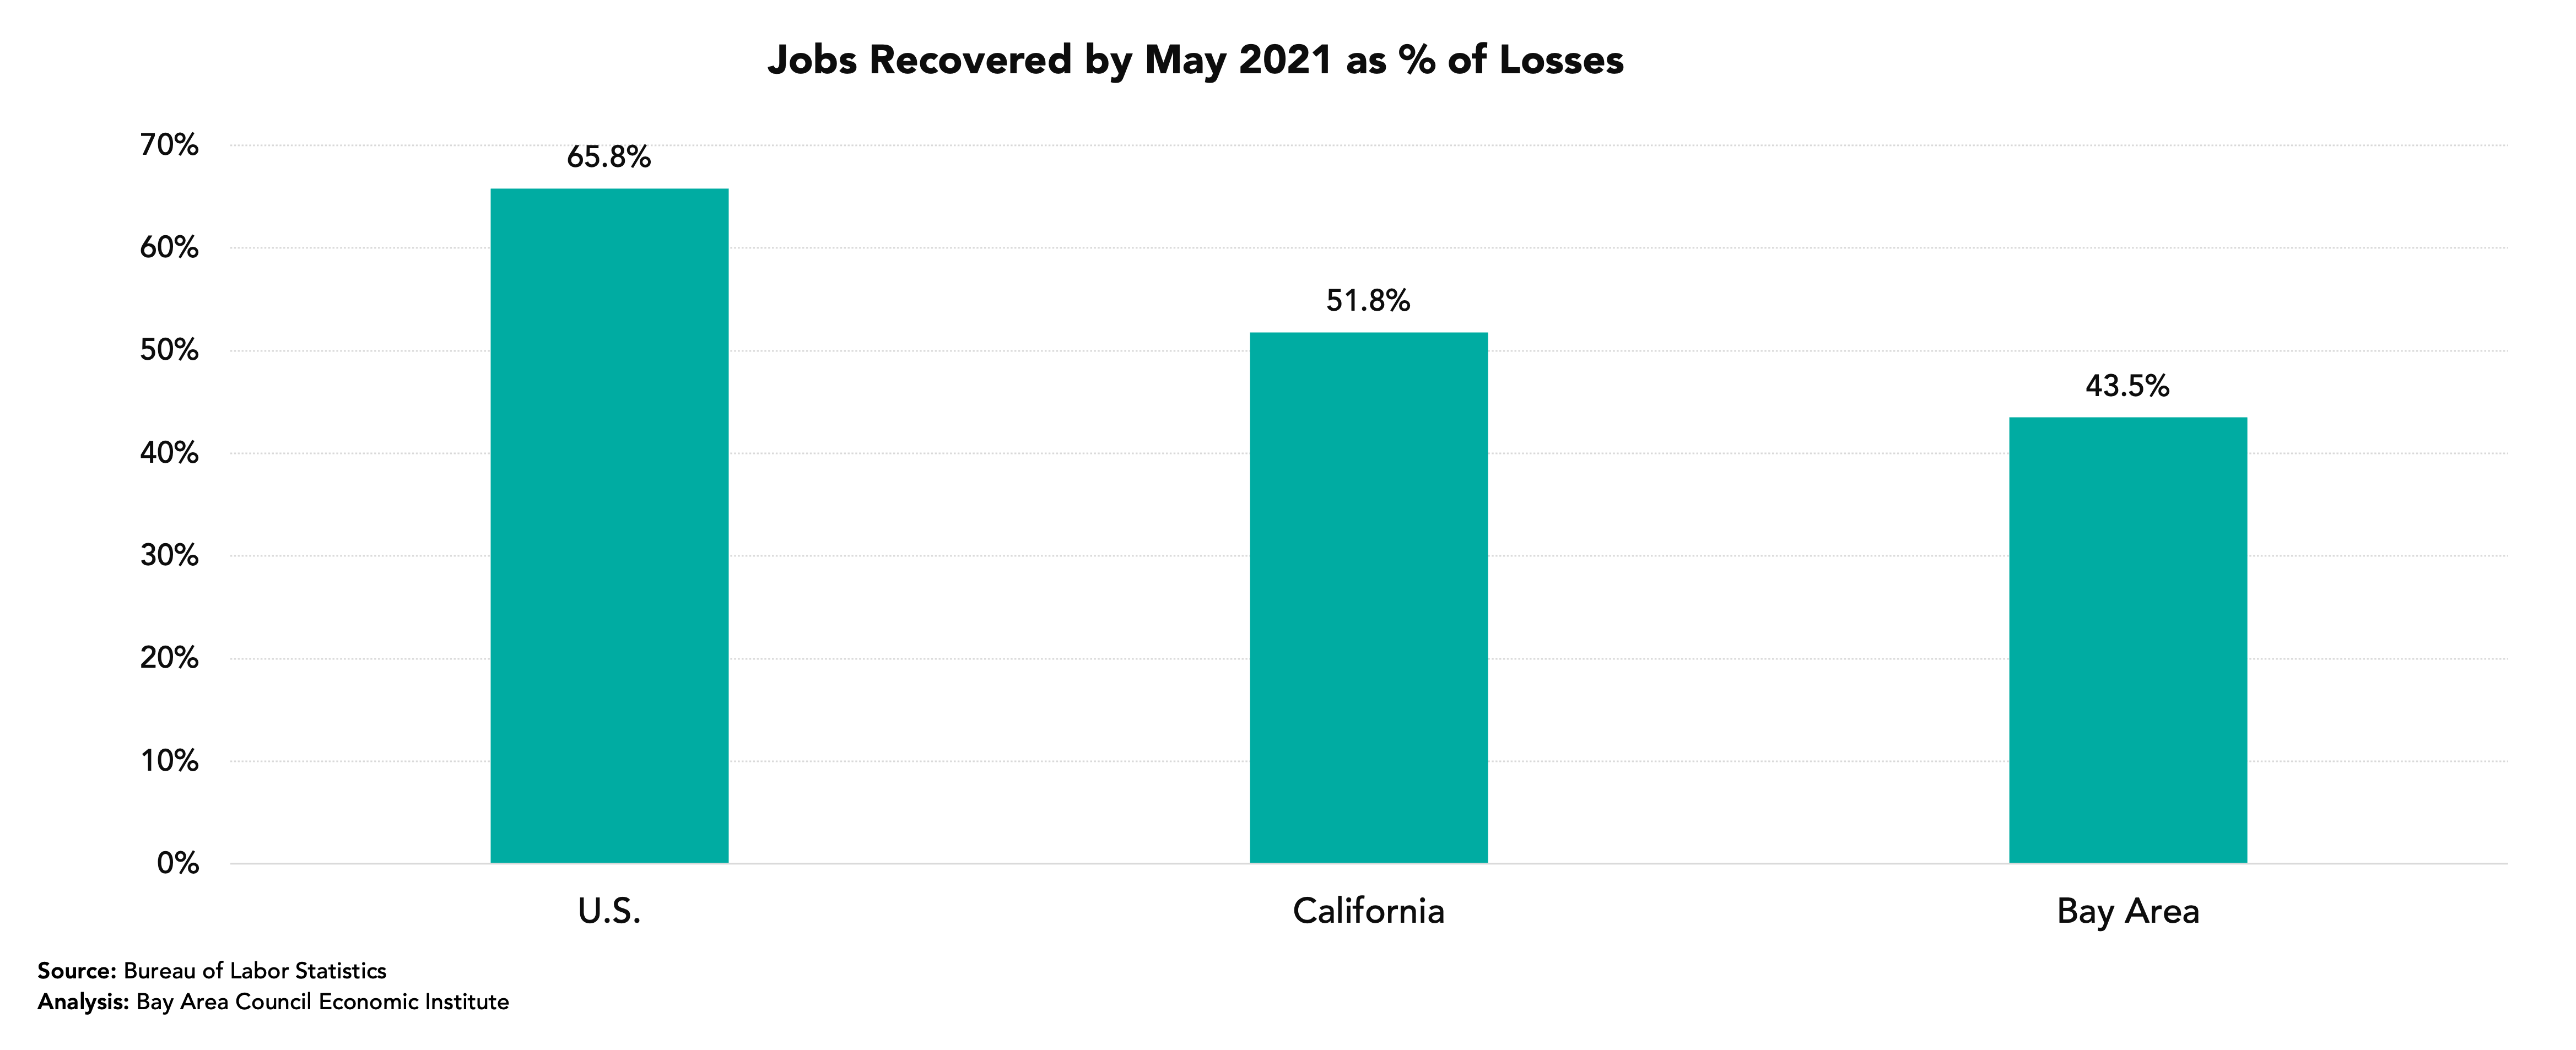
The Bay Area Trails the State and Nation in Payroll Job Recovery
By May 2022 the region had recovered 80.8% of the payroll jobs lost between February and April 2020. This is a lower recovery rate than the state and nation, though the region has closed the gap in recent months.
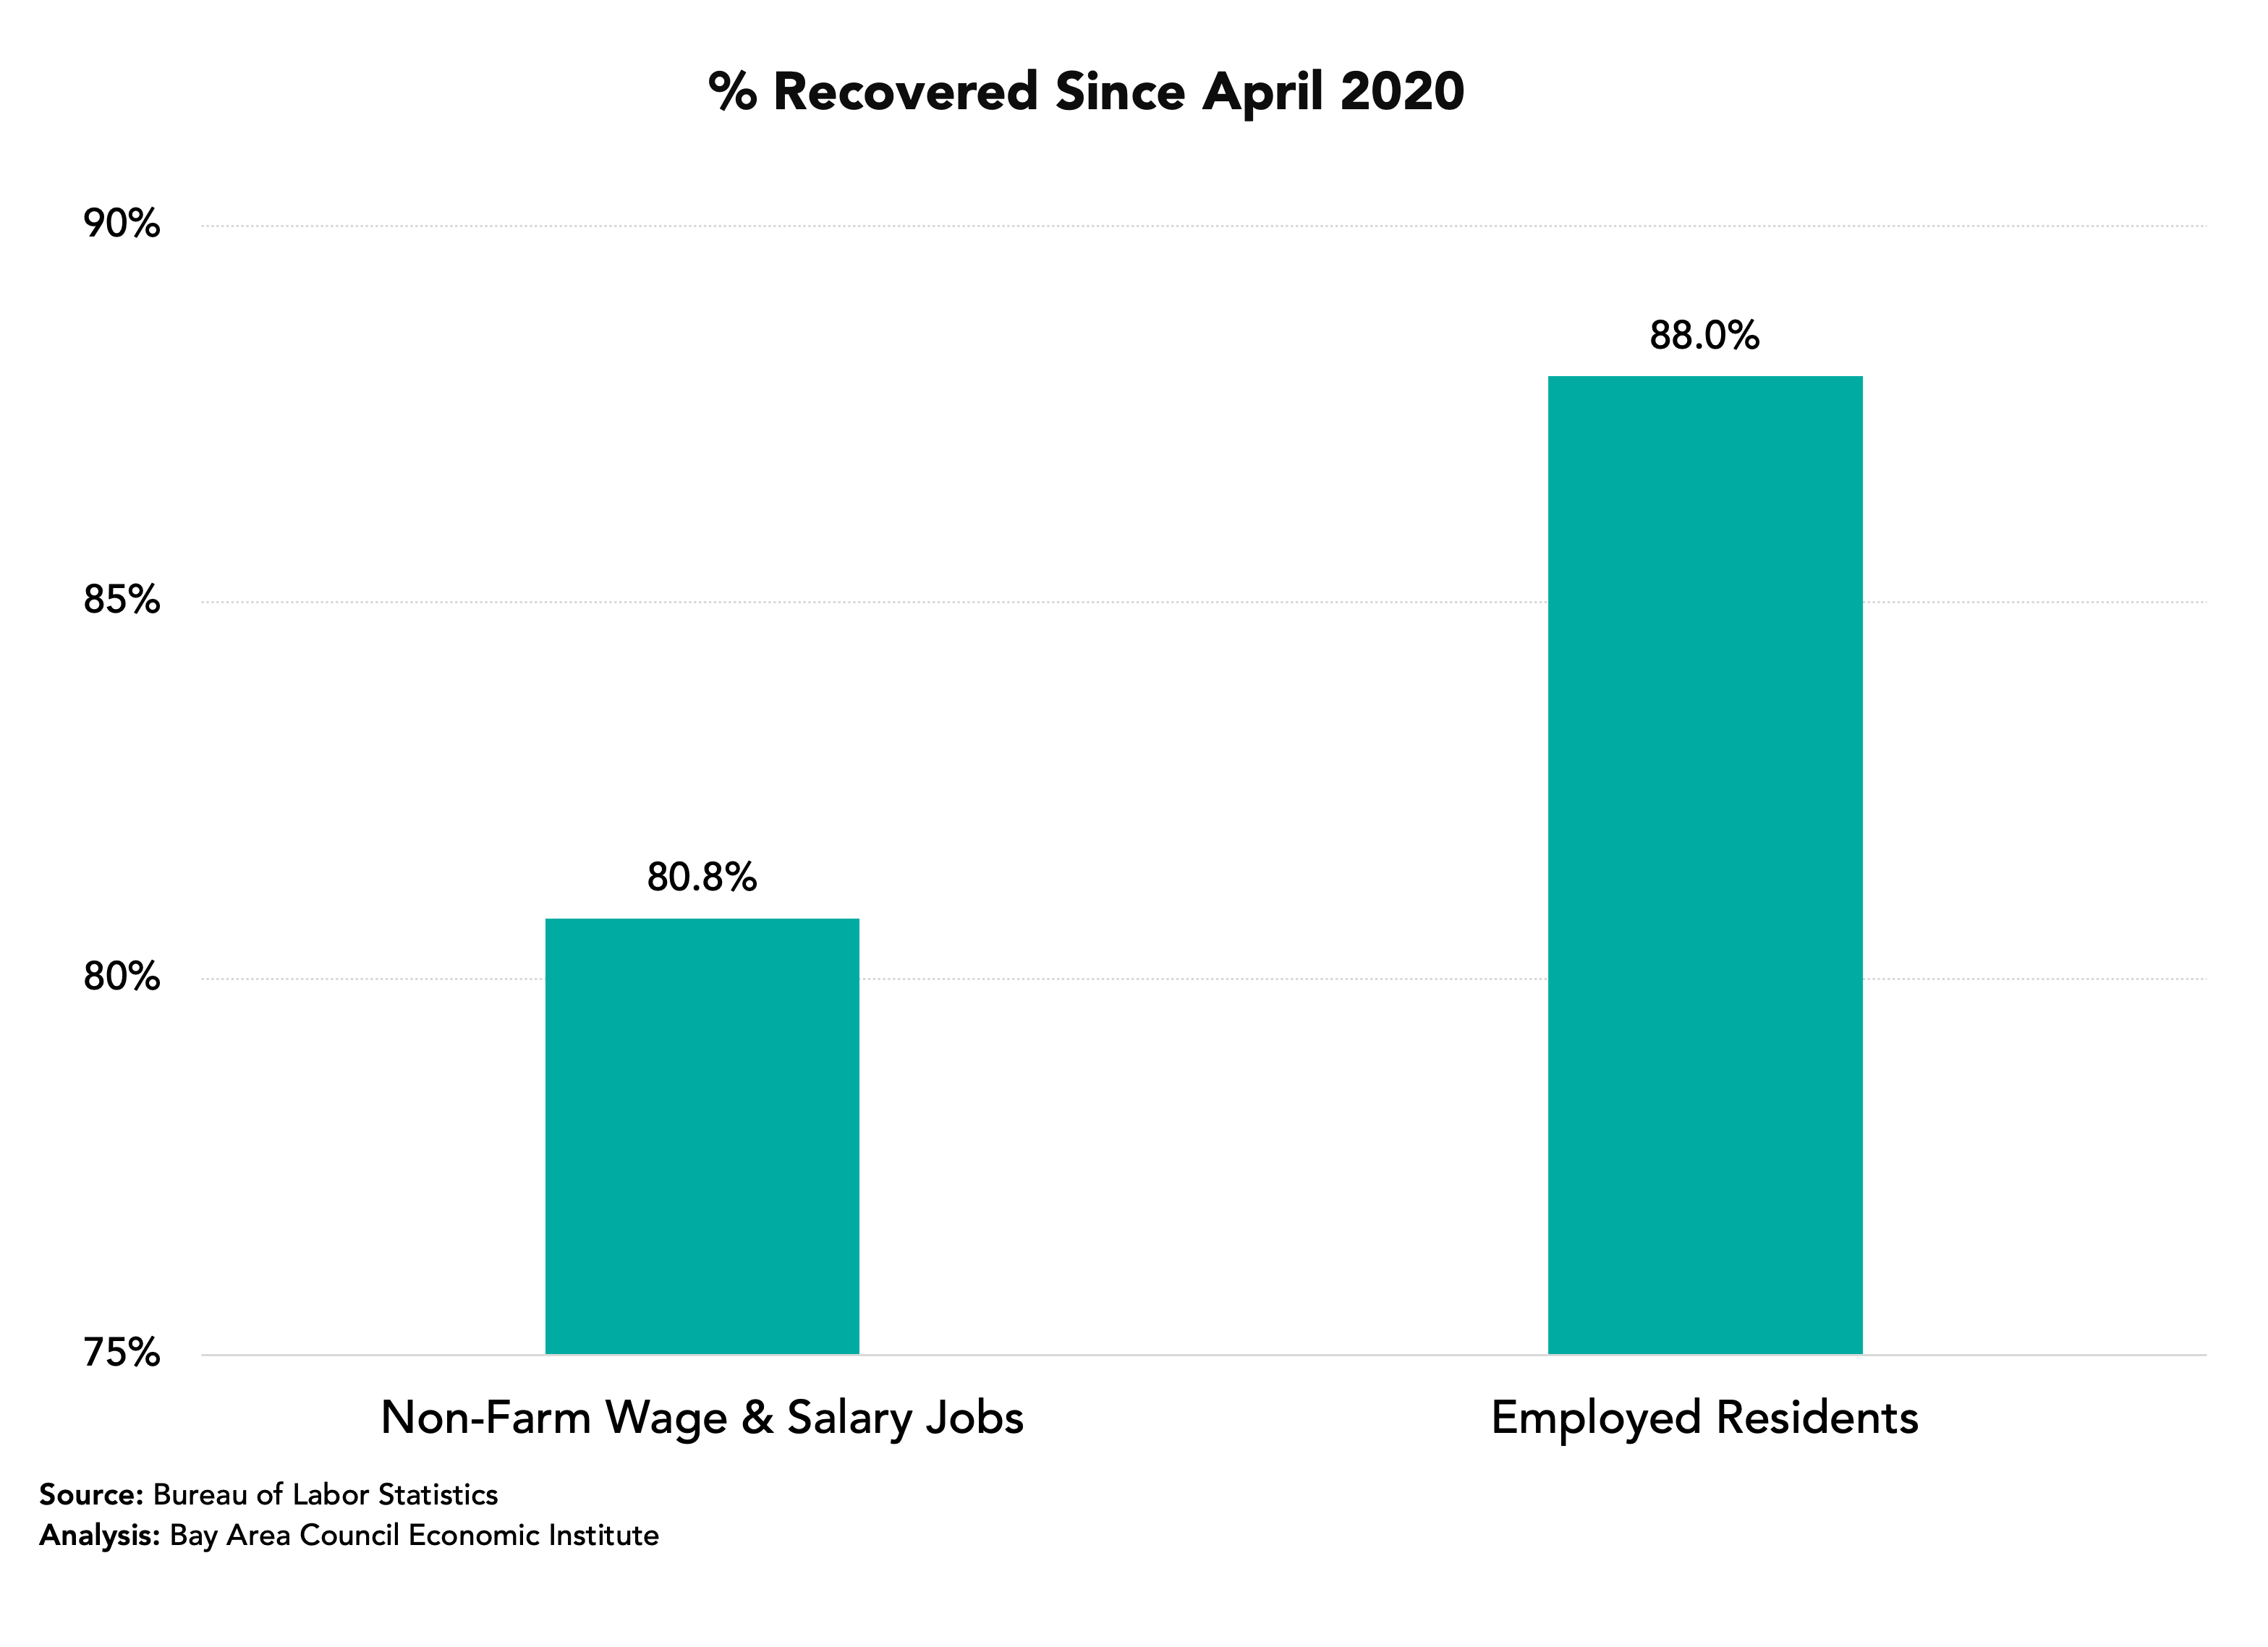
While the region has recovered just 80.8% of the non-farm payroll jobs lost between February and April 2020, it has recovered 88.0% of the decline in the number of residents with jobs. The explanation for the gap between the two measures is an increase in self-employment jobs, most likely gig work jobs.
Payroll Job Growth Strong for the Year Though Lagging Recently
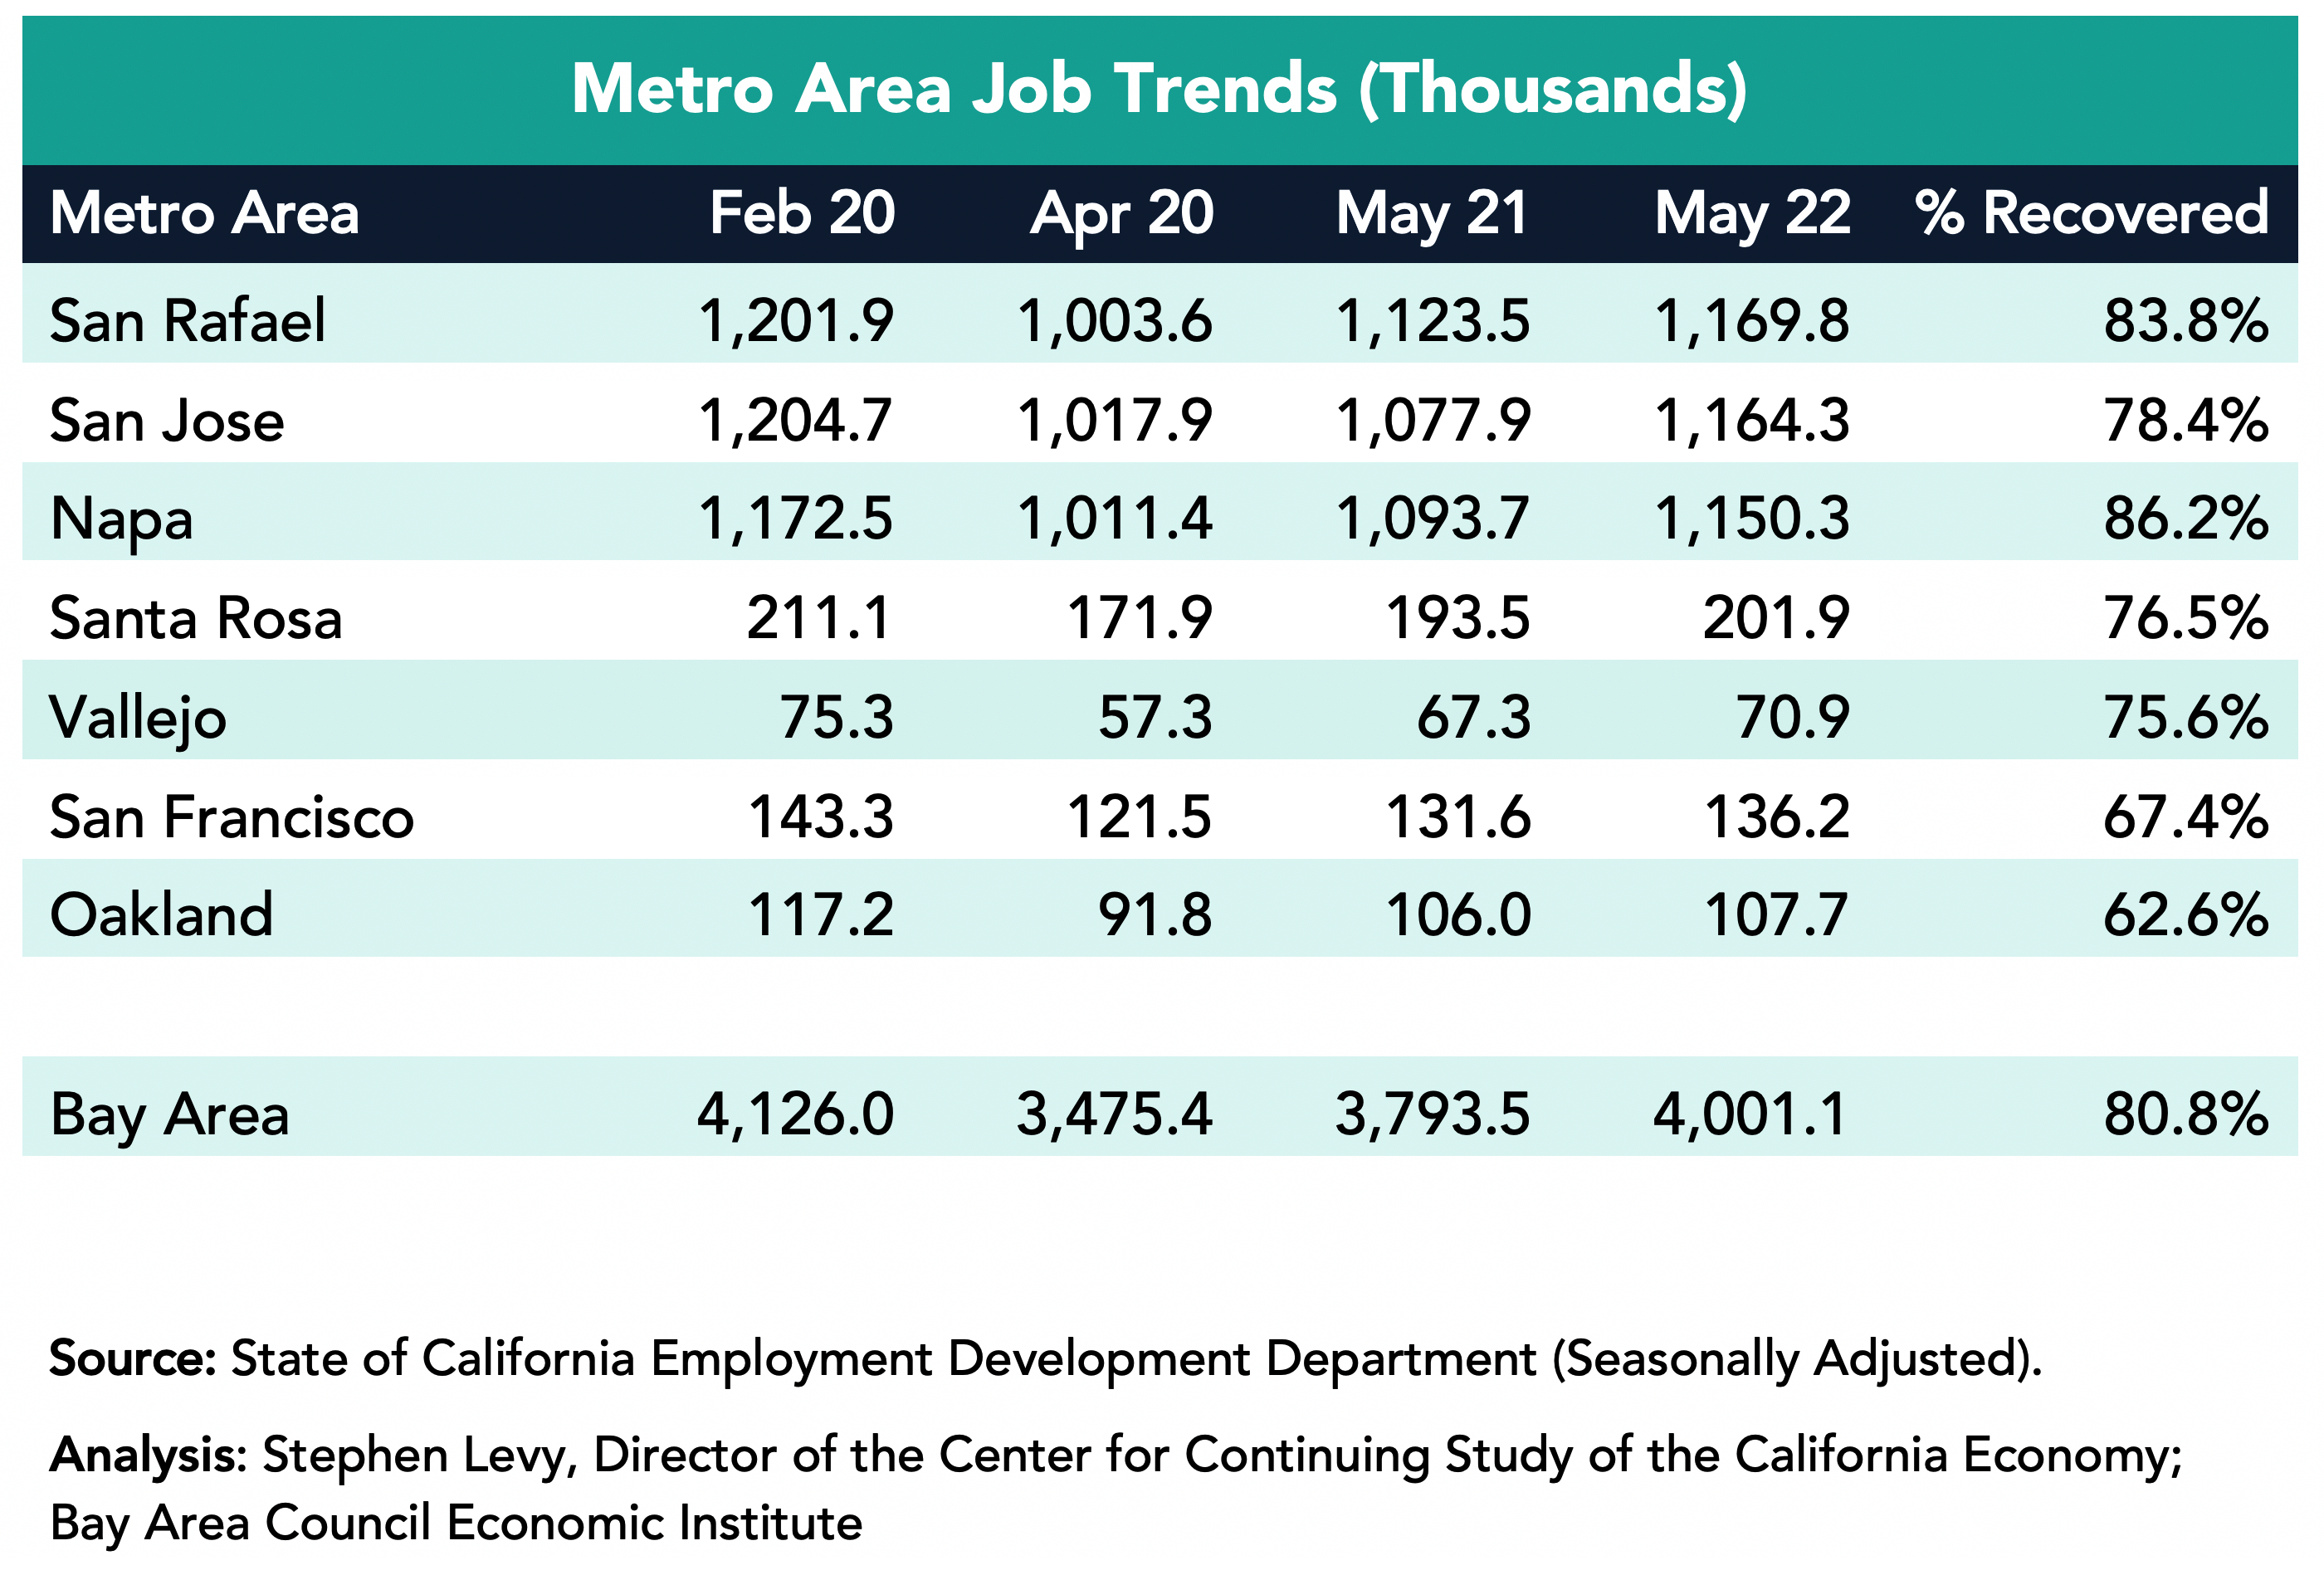
The Bay Area added 207,600 jobs in the past year (+5.5%) led by a gain of 86,400 in the San Francisco metro area though SF has recovered just 78.4% of the jobs lost between February and April 2020. The San Jose metro area added 56,600 jobs and by May 2022 had recovered 86.2% of the payroll jobs lost between February and April 2020. The Oakland metro area added 46,300 jobs during the past year.
But 102,900 Workers Have Not Rejoined the Workforce Since February 2020
Residents who are not in the labor force are not counted as unemployed. As a result, the number of unemployed residents can decline while some are still prevented by choice or lack of child care or work in industries that have not fully recovered. The number of residents not in the labor force has increased recently, perhaps in response to the rise of COVID cases in the region.
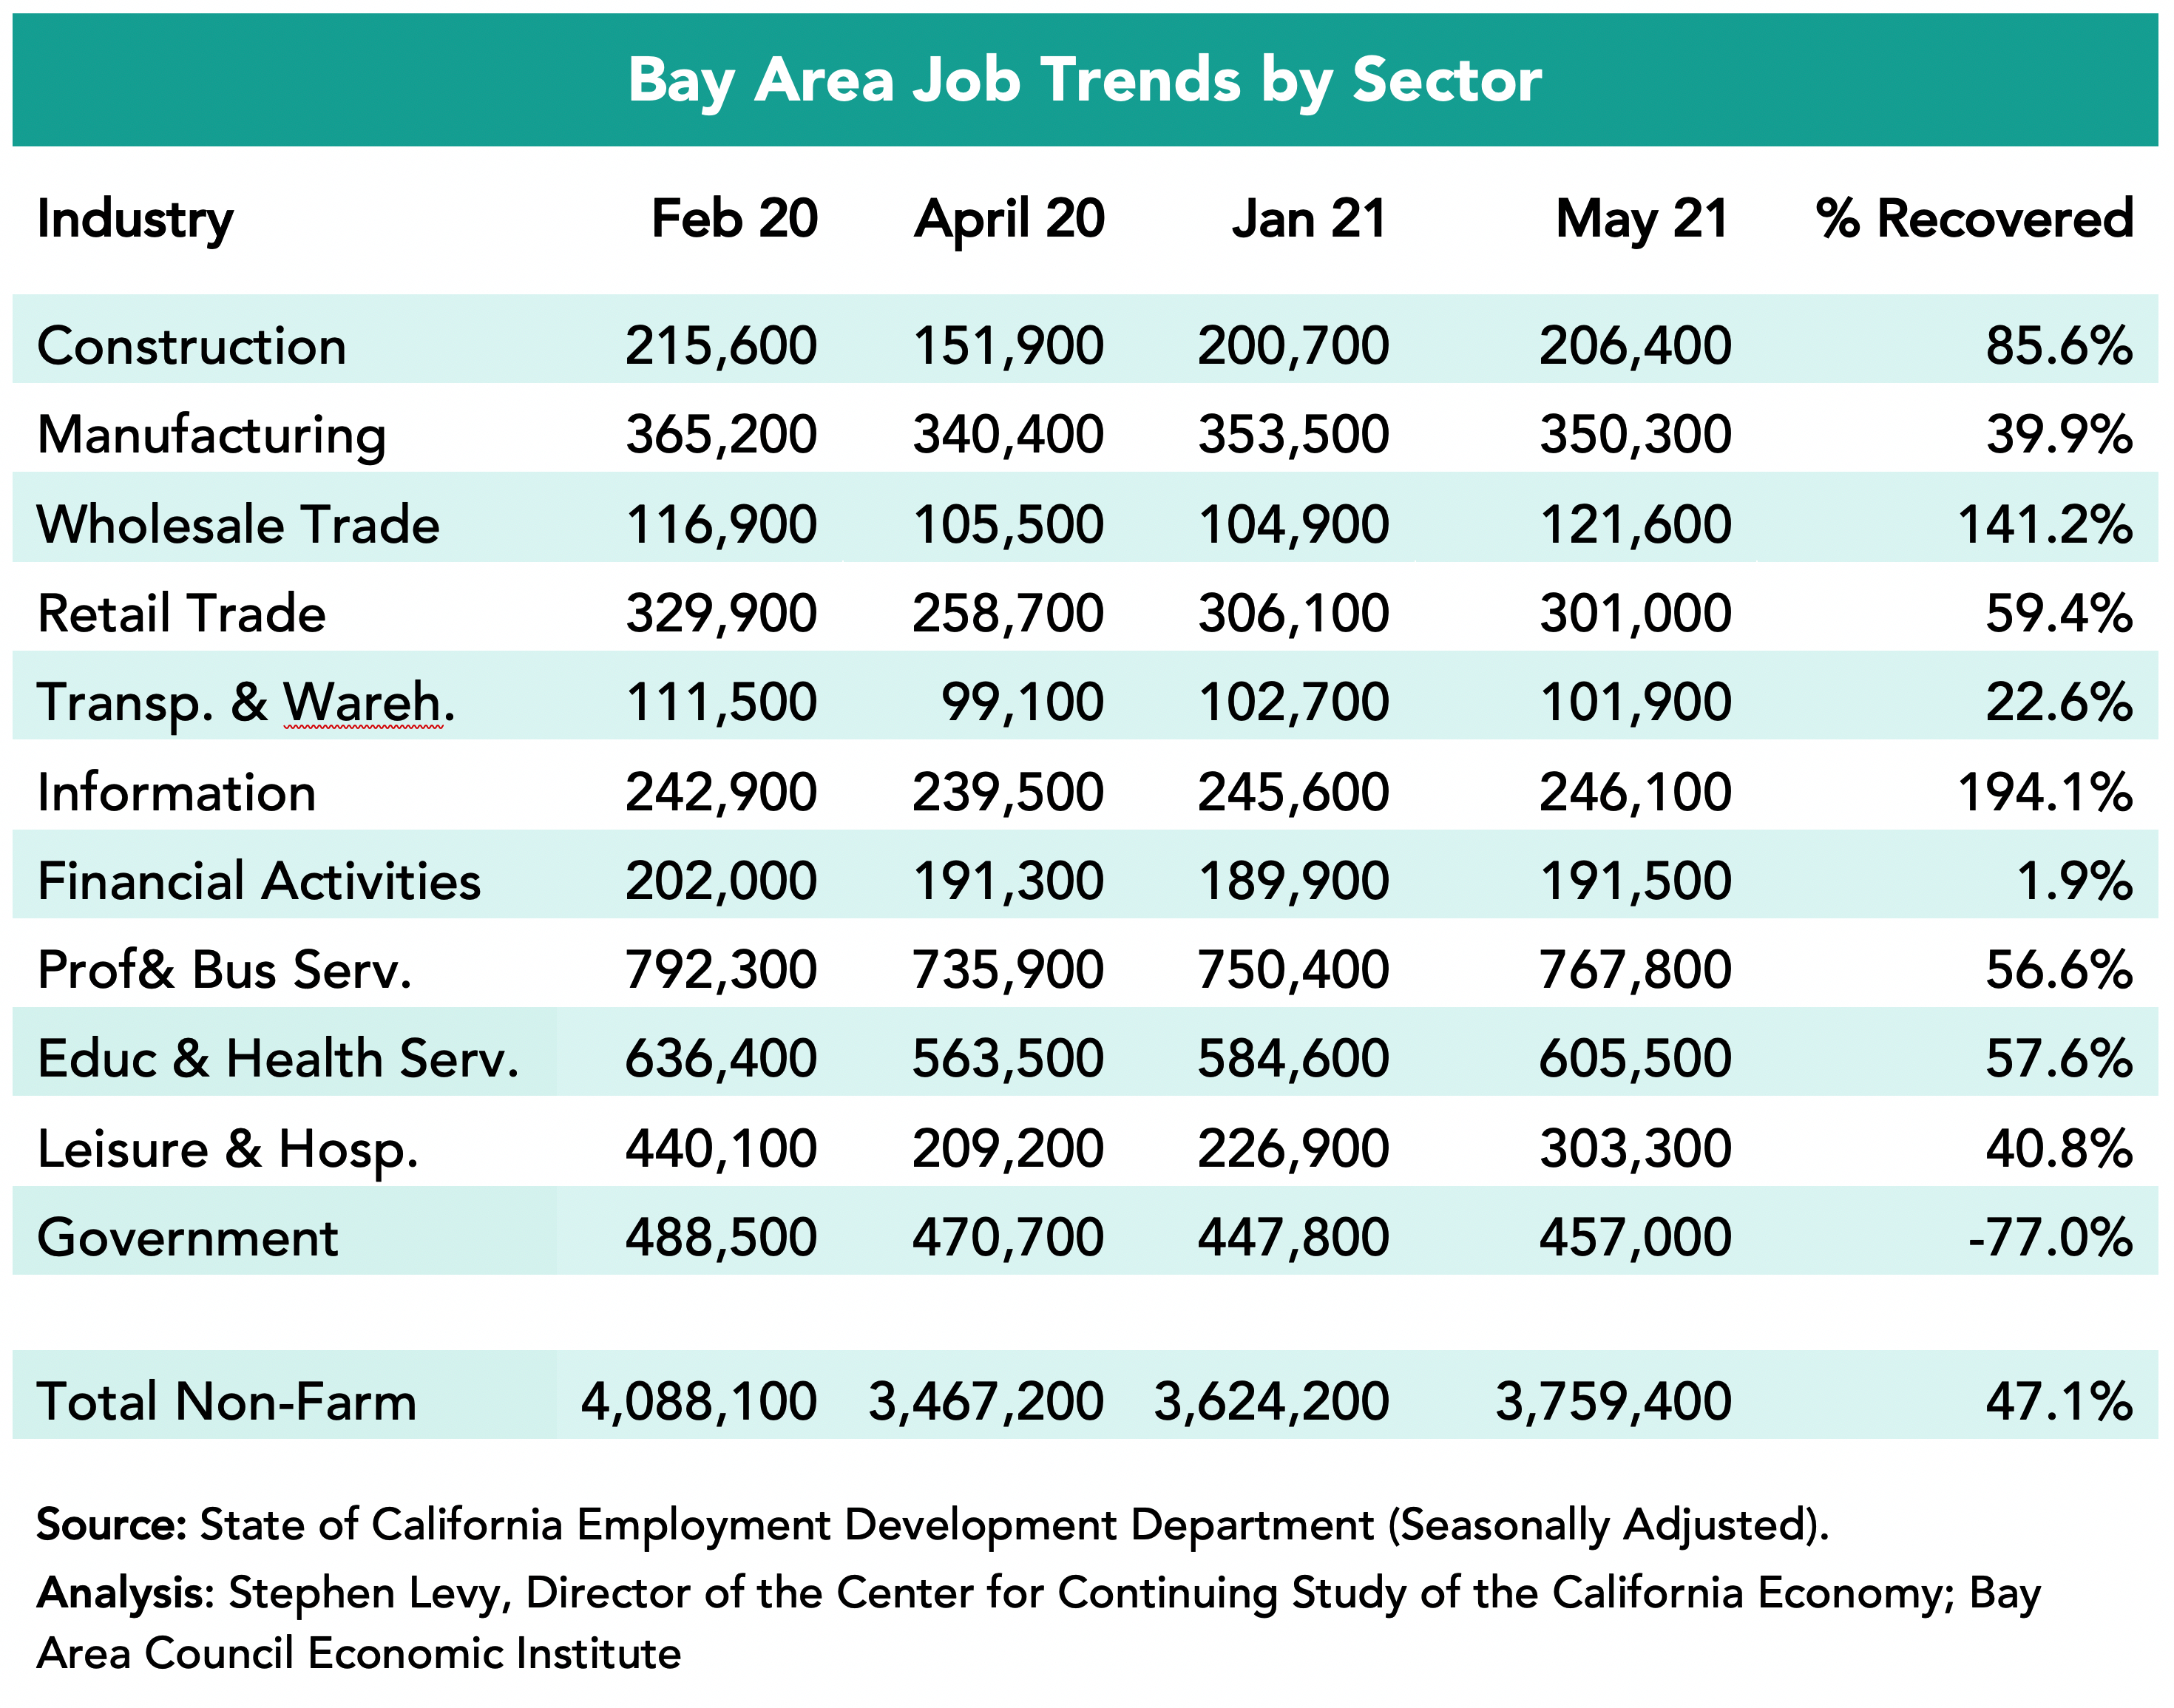
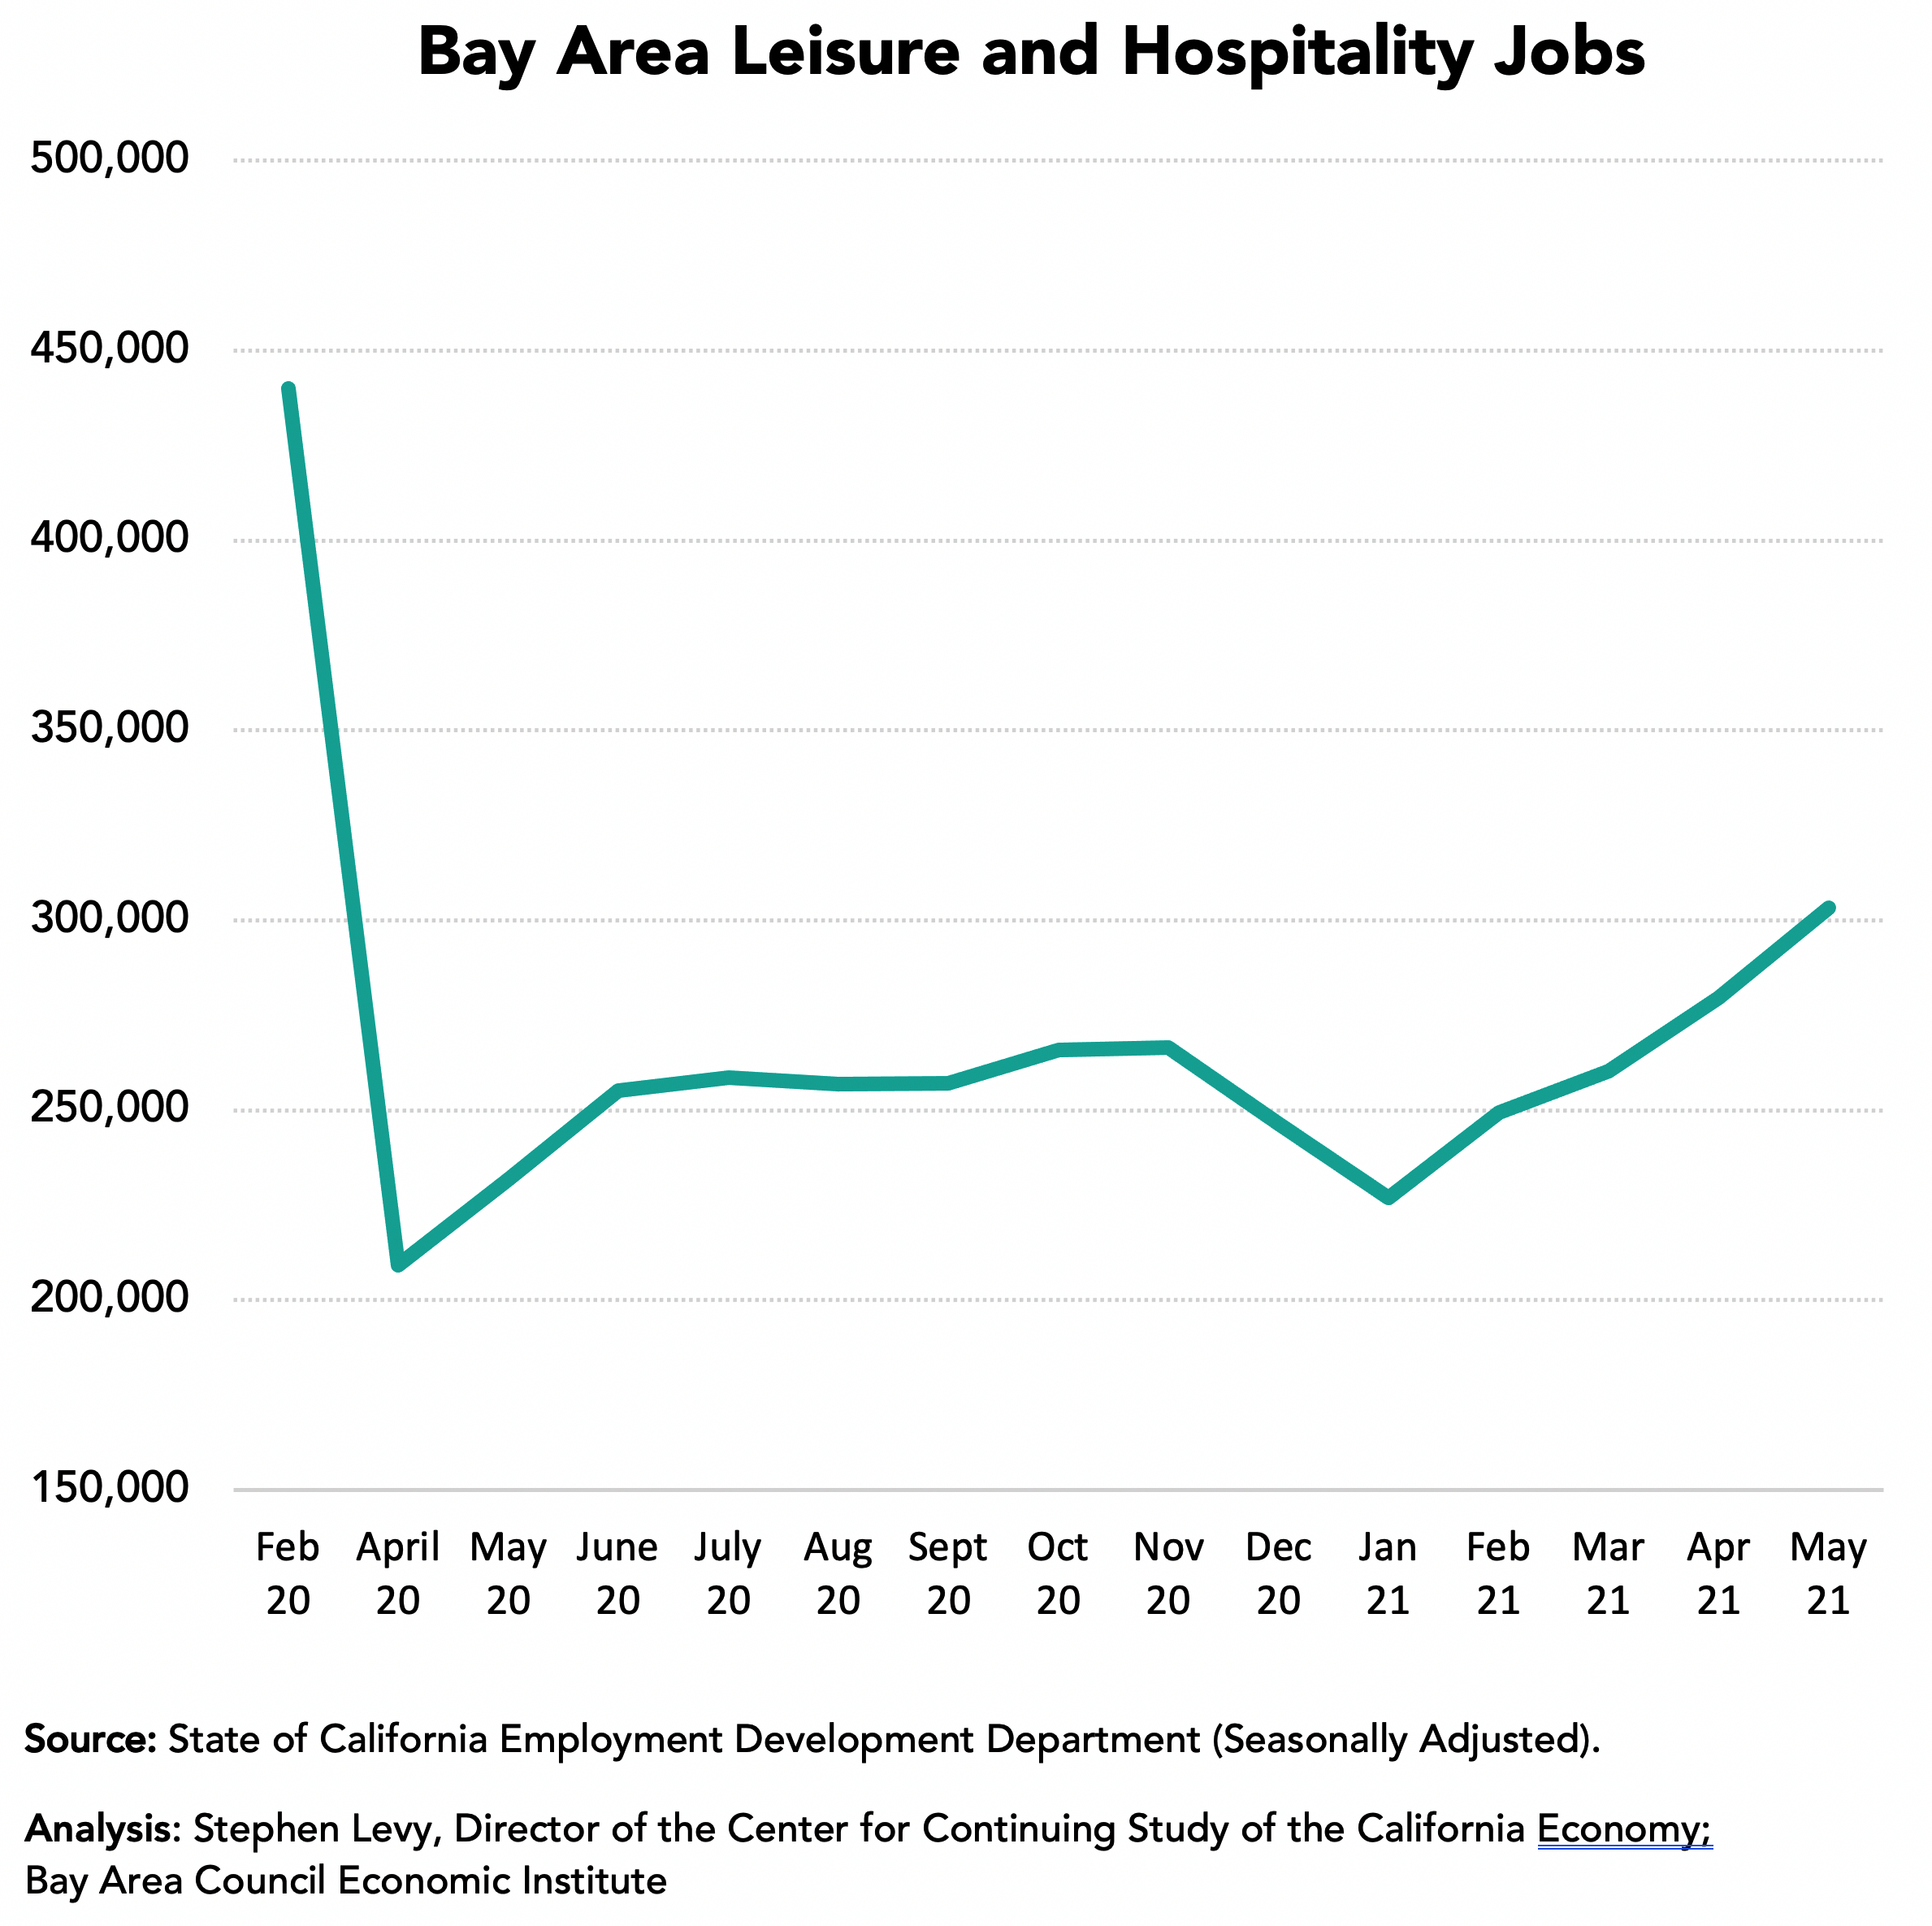
Industries Were Affected Differently
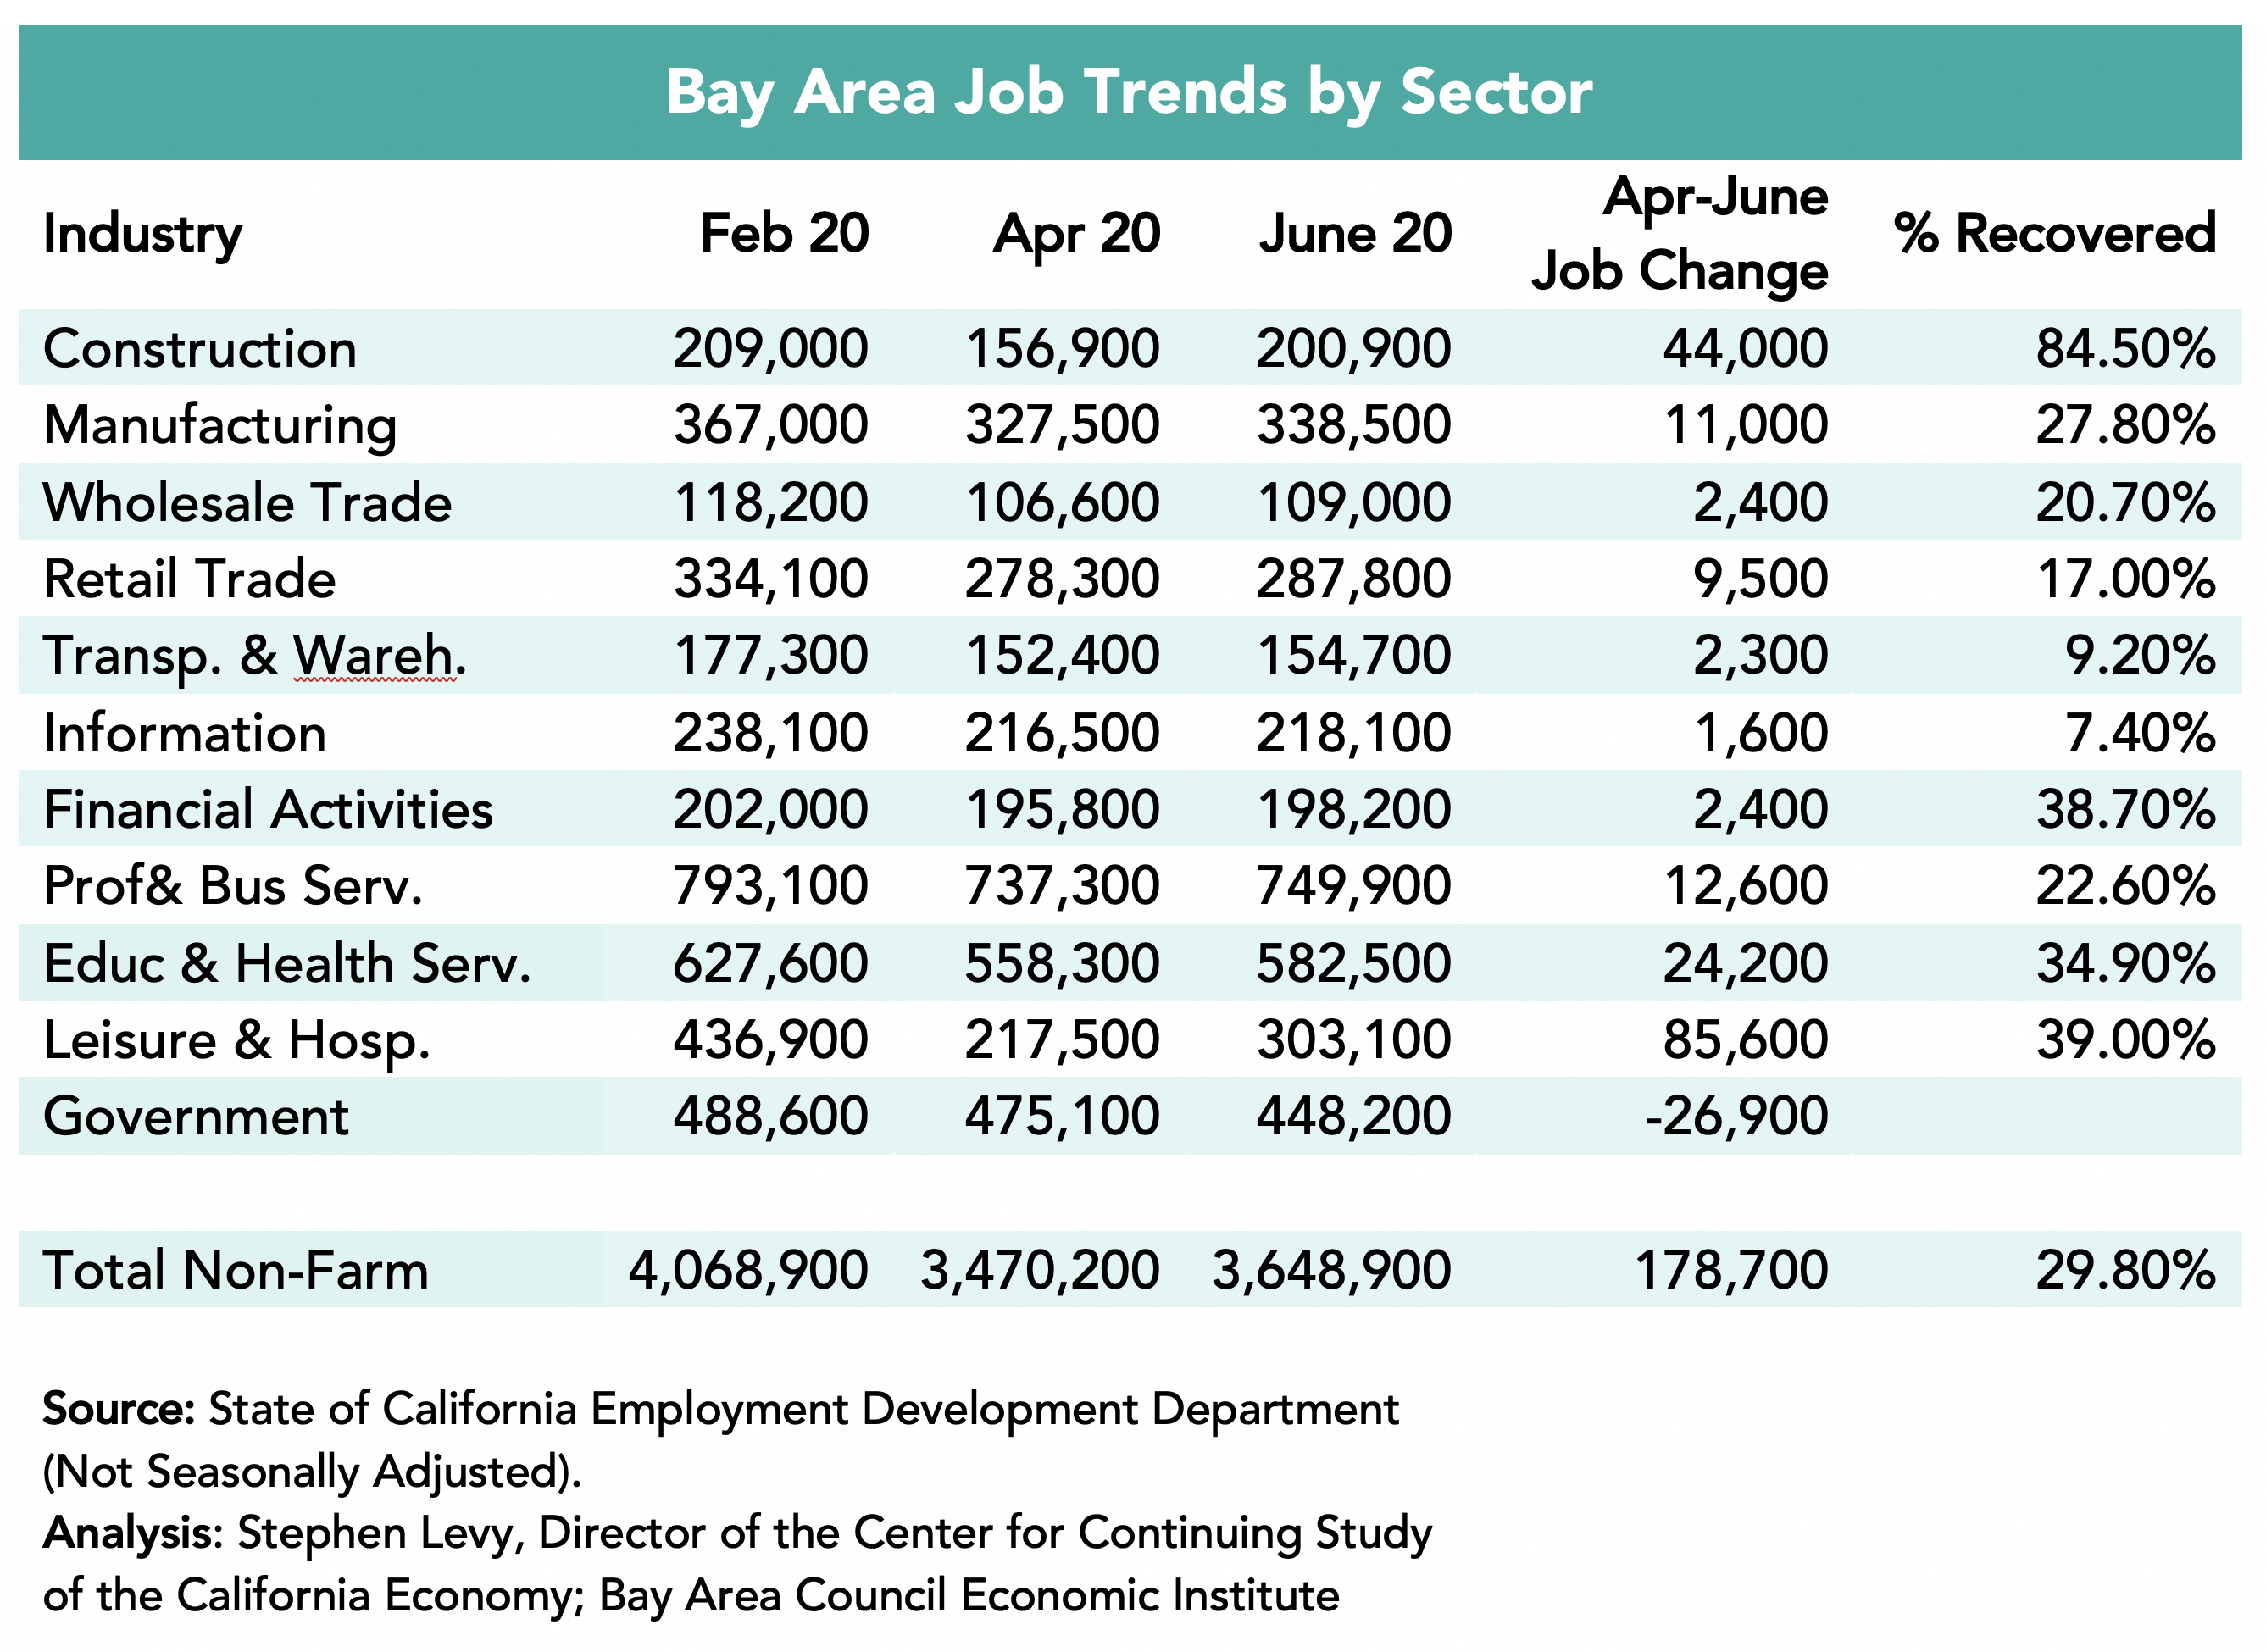
Four sectors—Manufacturing, Transportation and Warehousing, Information and Professional and Business Services—exceeded pre-pandemic job levels in May 2022 and Construction and Education and Health Care Services were close to full recovery. On the other hand, the Leisure and Hospitality sector recovered only 74.7% of lost jobs by May 2022, though travel and tourism jobs are now in a strong recovery. The Government sector is now slowly recovering the jobs lost between February and April 2020.
In the past two months Leisure and Hospitality and Government have shown the largest job growth.
Note that these data are not seasonally adjusted.
These economic updates are authored by Stephen Levy, Director of the Center for Continuing Study of the California Economy, and a member of the Bay Area Council Economic Institute board.
June 24, 2022
In May 2022, the United States and 13 nations launched the Indo-Pacific Economic Framework (IPEF), a next-generation economic initiative designed to bring together economies in the Indian Ocean and Asia-Pacific regions around shared economic objectives. In this article on Medium.com, by Sean Randolph, Senior Director of the Institute, details the potential for the agreement in the future.
For years technology entrepreneurship was almost exclusive domain of Silicon Valley. In this article on Medium.com, by Sean Randolph, Senior Director of the Institute, details how new opportunities for growth and innovation are occurring in different nations across the globe.
Slower Job Growth in April and Some Good News in the Report
May 23, 2022
TThe Bay Area added 11,500 payroll jobs in April down from 15,500 in March and 24,100 in February. Job growth slowed in the state and nation as well and the region is still outpacing the nation in job growth over the past 12 months after the sharp job losses in 2020.
The highlights:
• Bay Area jobs increased by 5.8% between April 2021 and 2022 compared to a 4.6% increase in the nation and 5.6% gain in California.
• The Bay Area unemployment rate in March 2022 was 2.5% compared to 2.7% in the pre-pandemic month of February 2020.
• May 2022 brings major crosscurrents to the global, national and regional economy with the Russian invasion of Ukraine, rising interest rates amidst continuing high inflation, the recent spike in Bay Area COVID cases and the ongoing Bay Area challenges of housing, transportation and competitiveness.
• April 2022 brings major crosscurrents to the global, national and regional economy with the Russian invasion of Ukraine, rising interest rates amidst continuing high inflation and the ongoing Bay Area challenges of housing, transportation and competitiveness.
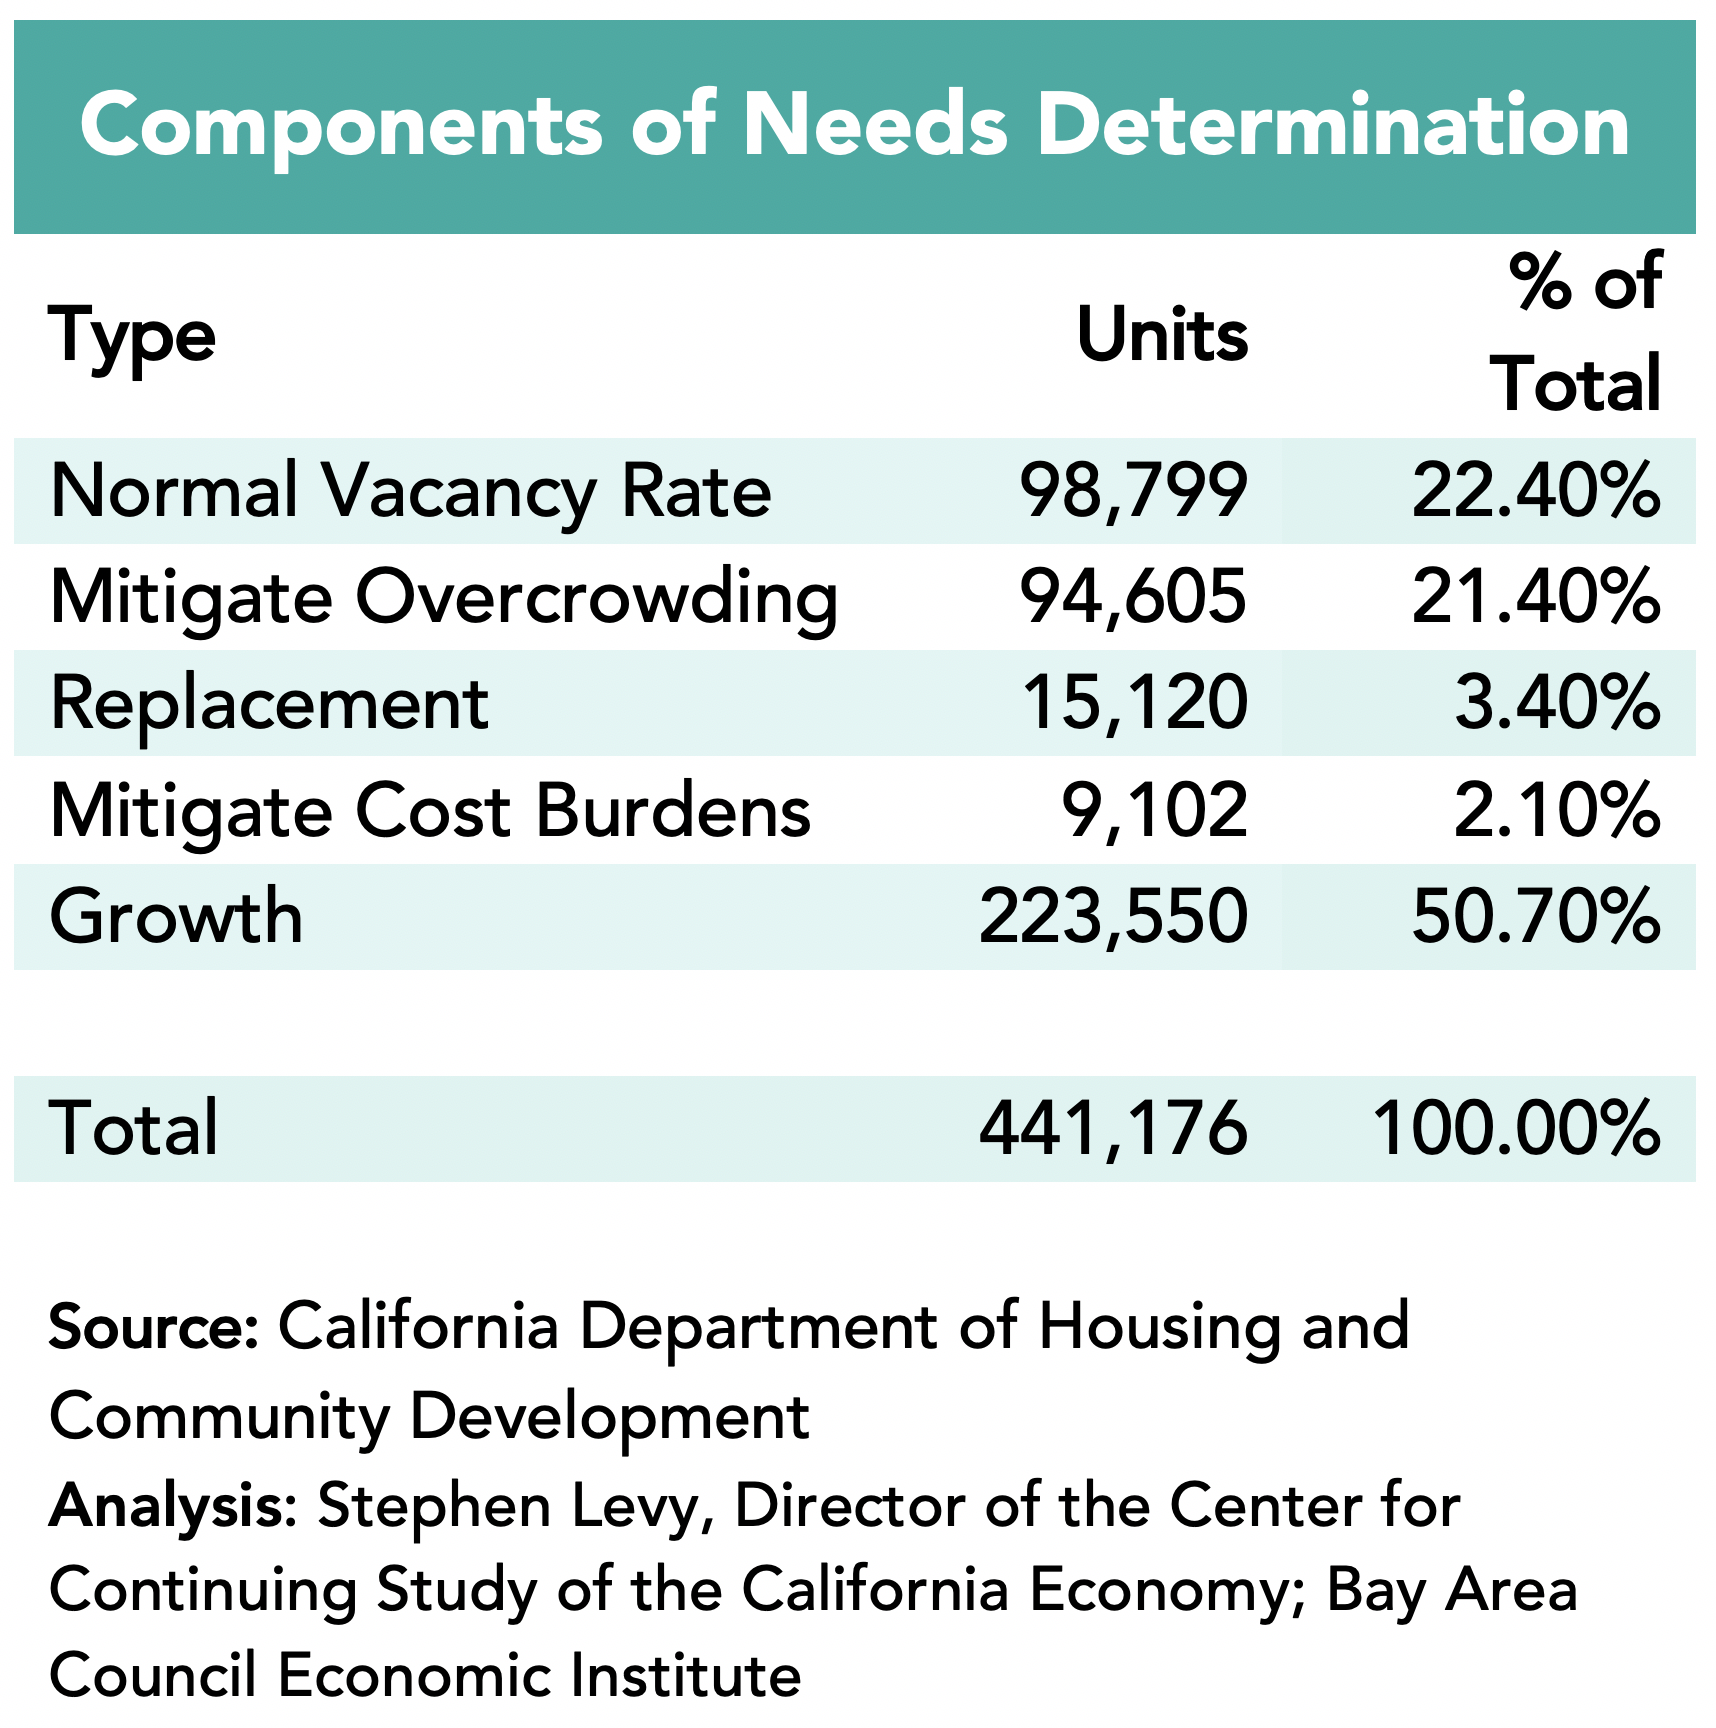
• Bay Area jurisdictions have been given large increases in their housing goals for the next eight years as a result of state legislation and policy to reduce overcrowding and increase affordability. Each jurisdiction is in the process of updating their Housing Elements in 2022 to meet state and regional policy goals and requirements.
The Bay Area Outpaced the Nation in Recent Job Growth
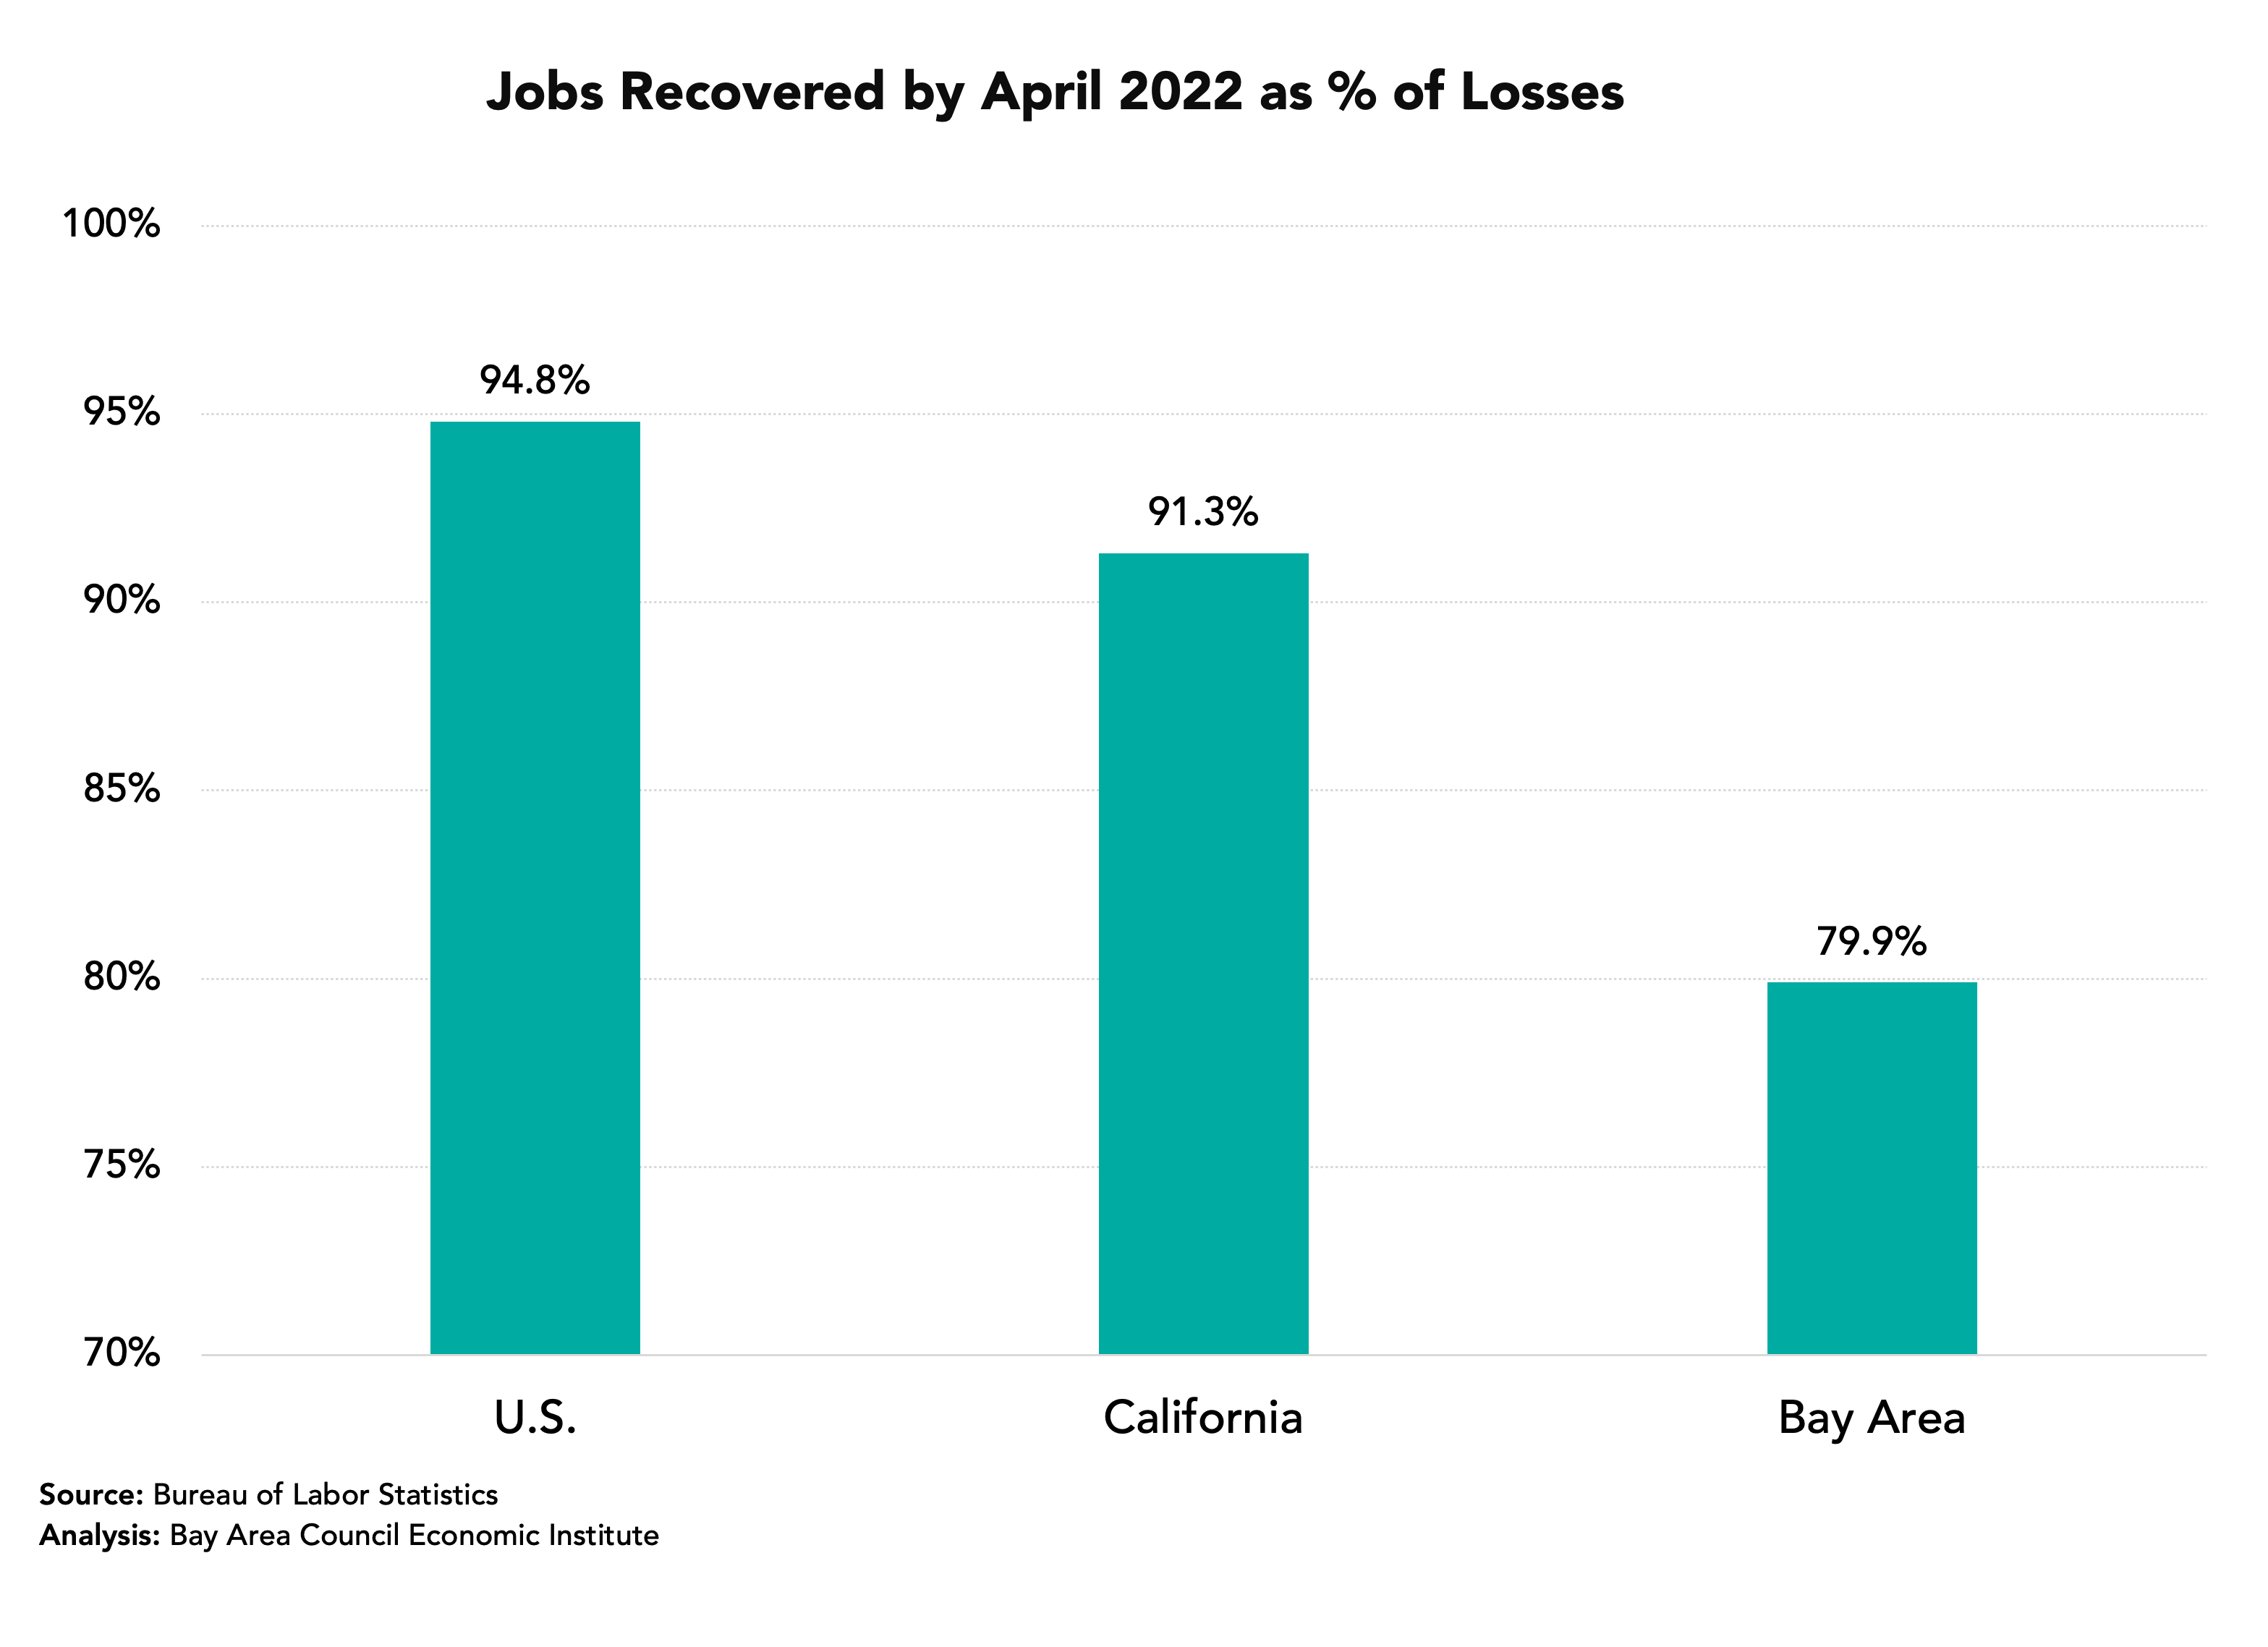
Job growth slowed in the nation, state and region in April. Still, Bay Area payroll jobs increased by 5.8% between April 2021 and April 2022 outpacing the U.S. 4.6% growth rate. The region still lags the nation and state in the % of jobs recovered since April 2020 as a result of the large job losses in 2020.
By April 2022 the region had recovered 79.9% of the jobs lost between February and April 2020. This is a lower recovery rate than the state and nation, though the region has closed the gap in recent months.
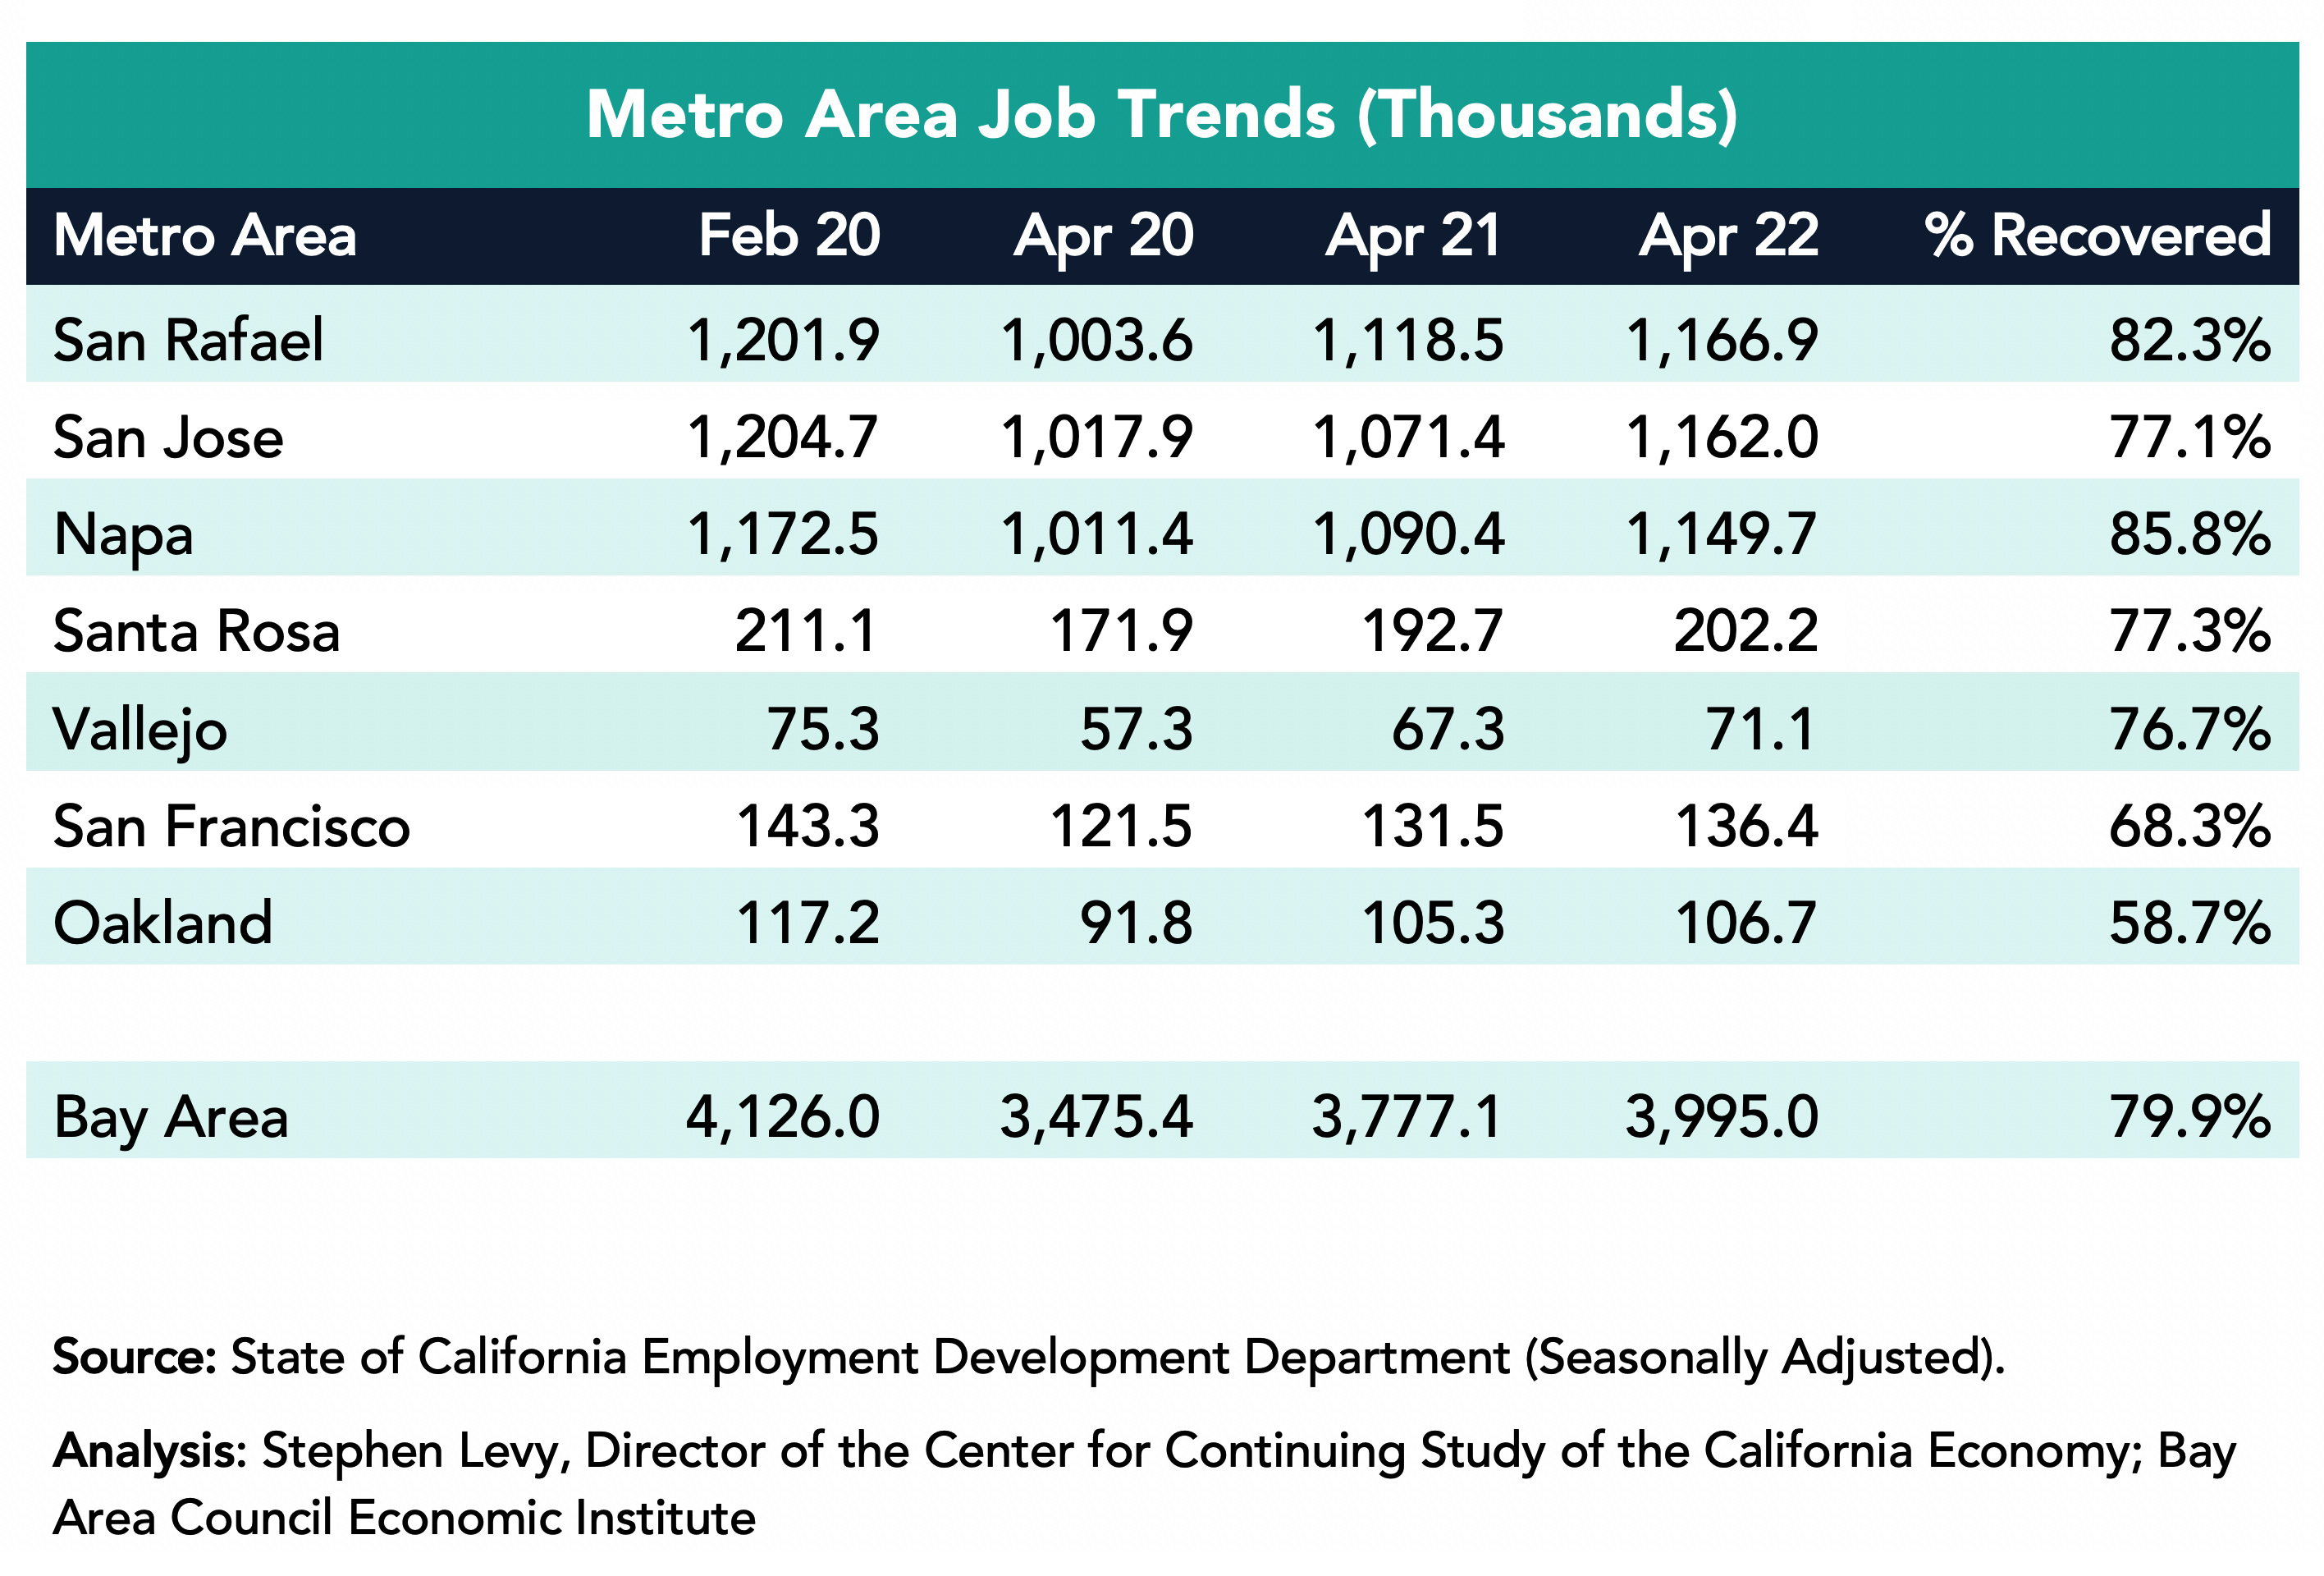
The Bay Area added 217,900 jobs in the past year led by a gain of 90,600 in the San Francisco metro area though SF has recovered just 77.1% of the jobs lost between February and April 2020. The San Jose metro area added 59,300 jobs and by April 2022 had recovered 85.8% of the jobs lost between February and April 2020. The Oakland metro area added 47,400 jobs during the past year.
While the region has recovered just 79.9% of the non-farm wage & salary jobs lost between February and April 2020, it has recovered 85.6% of the decline in the number of residents with jobs. The explanation for the gap between the two measures is an increase in self-employment jobs, most likely gig work jobs.
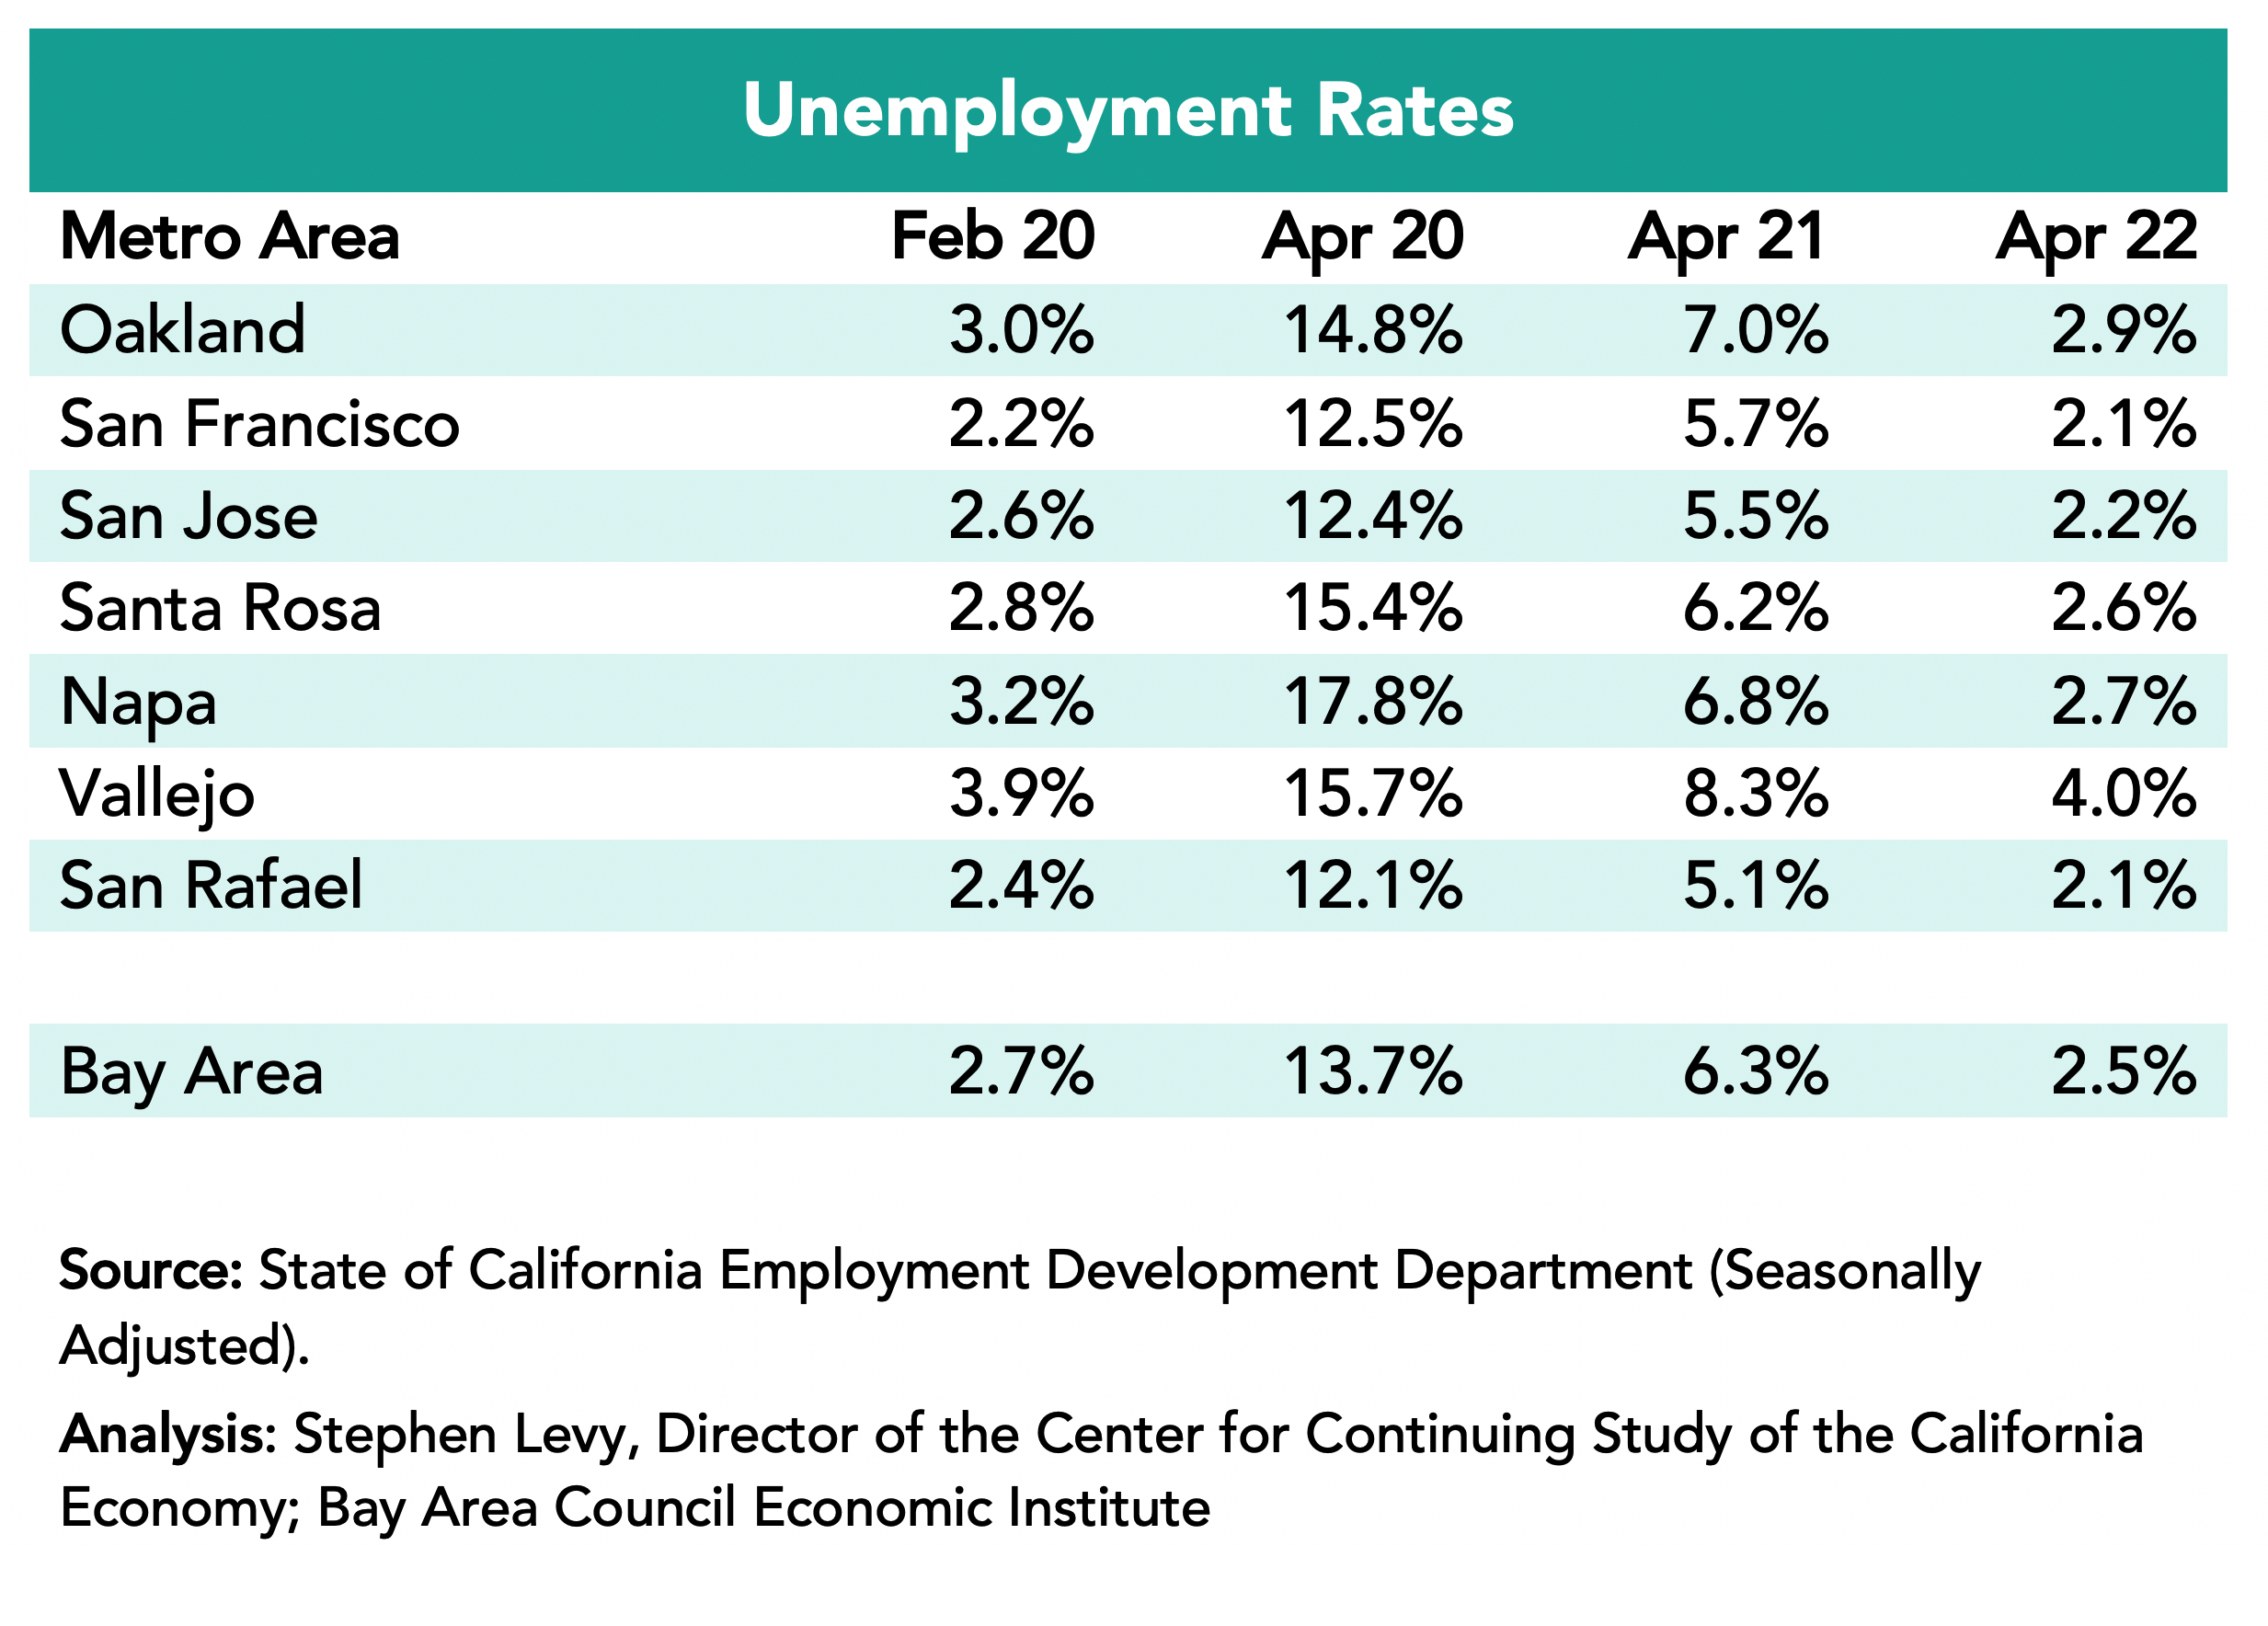
Unemployment Rates Fell to 2.5% in the Region in April 2022 from 6.3% in April 2021 and is now below the pre-pandemic level in February 2020
The lowest rates were in the San Rafael and San Francisco metro areas (2.1%) followed by the San Jose metro areas (2.2%) in April 2022.
The number of unemployed residents has fallen sharply from the April 2020 high 103,400 in April 2022 below the pre-pandemic level in February 2020.
But 105,600 Workers Have Not Rejoined the Workforce Since February 2020
Residents who are not in the labor force are not counted as unemployed. As a result, the number of unemployed residents can decline while some are still prevented by choice or lack of child care or work in industries that have not fully recovered. The number of residents not in the labor force has increased recently, perhaps in response to the rise of COVID cases in the region.
Industries Were Affected Differently
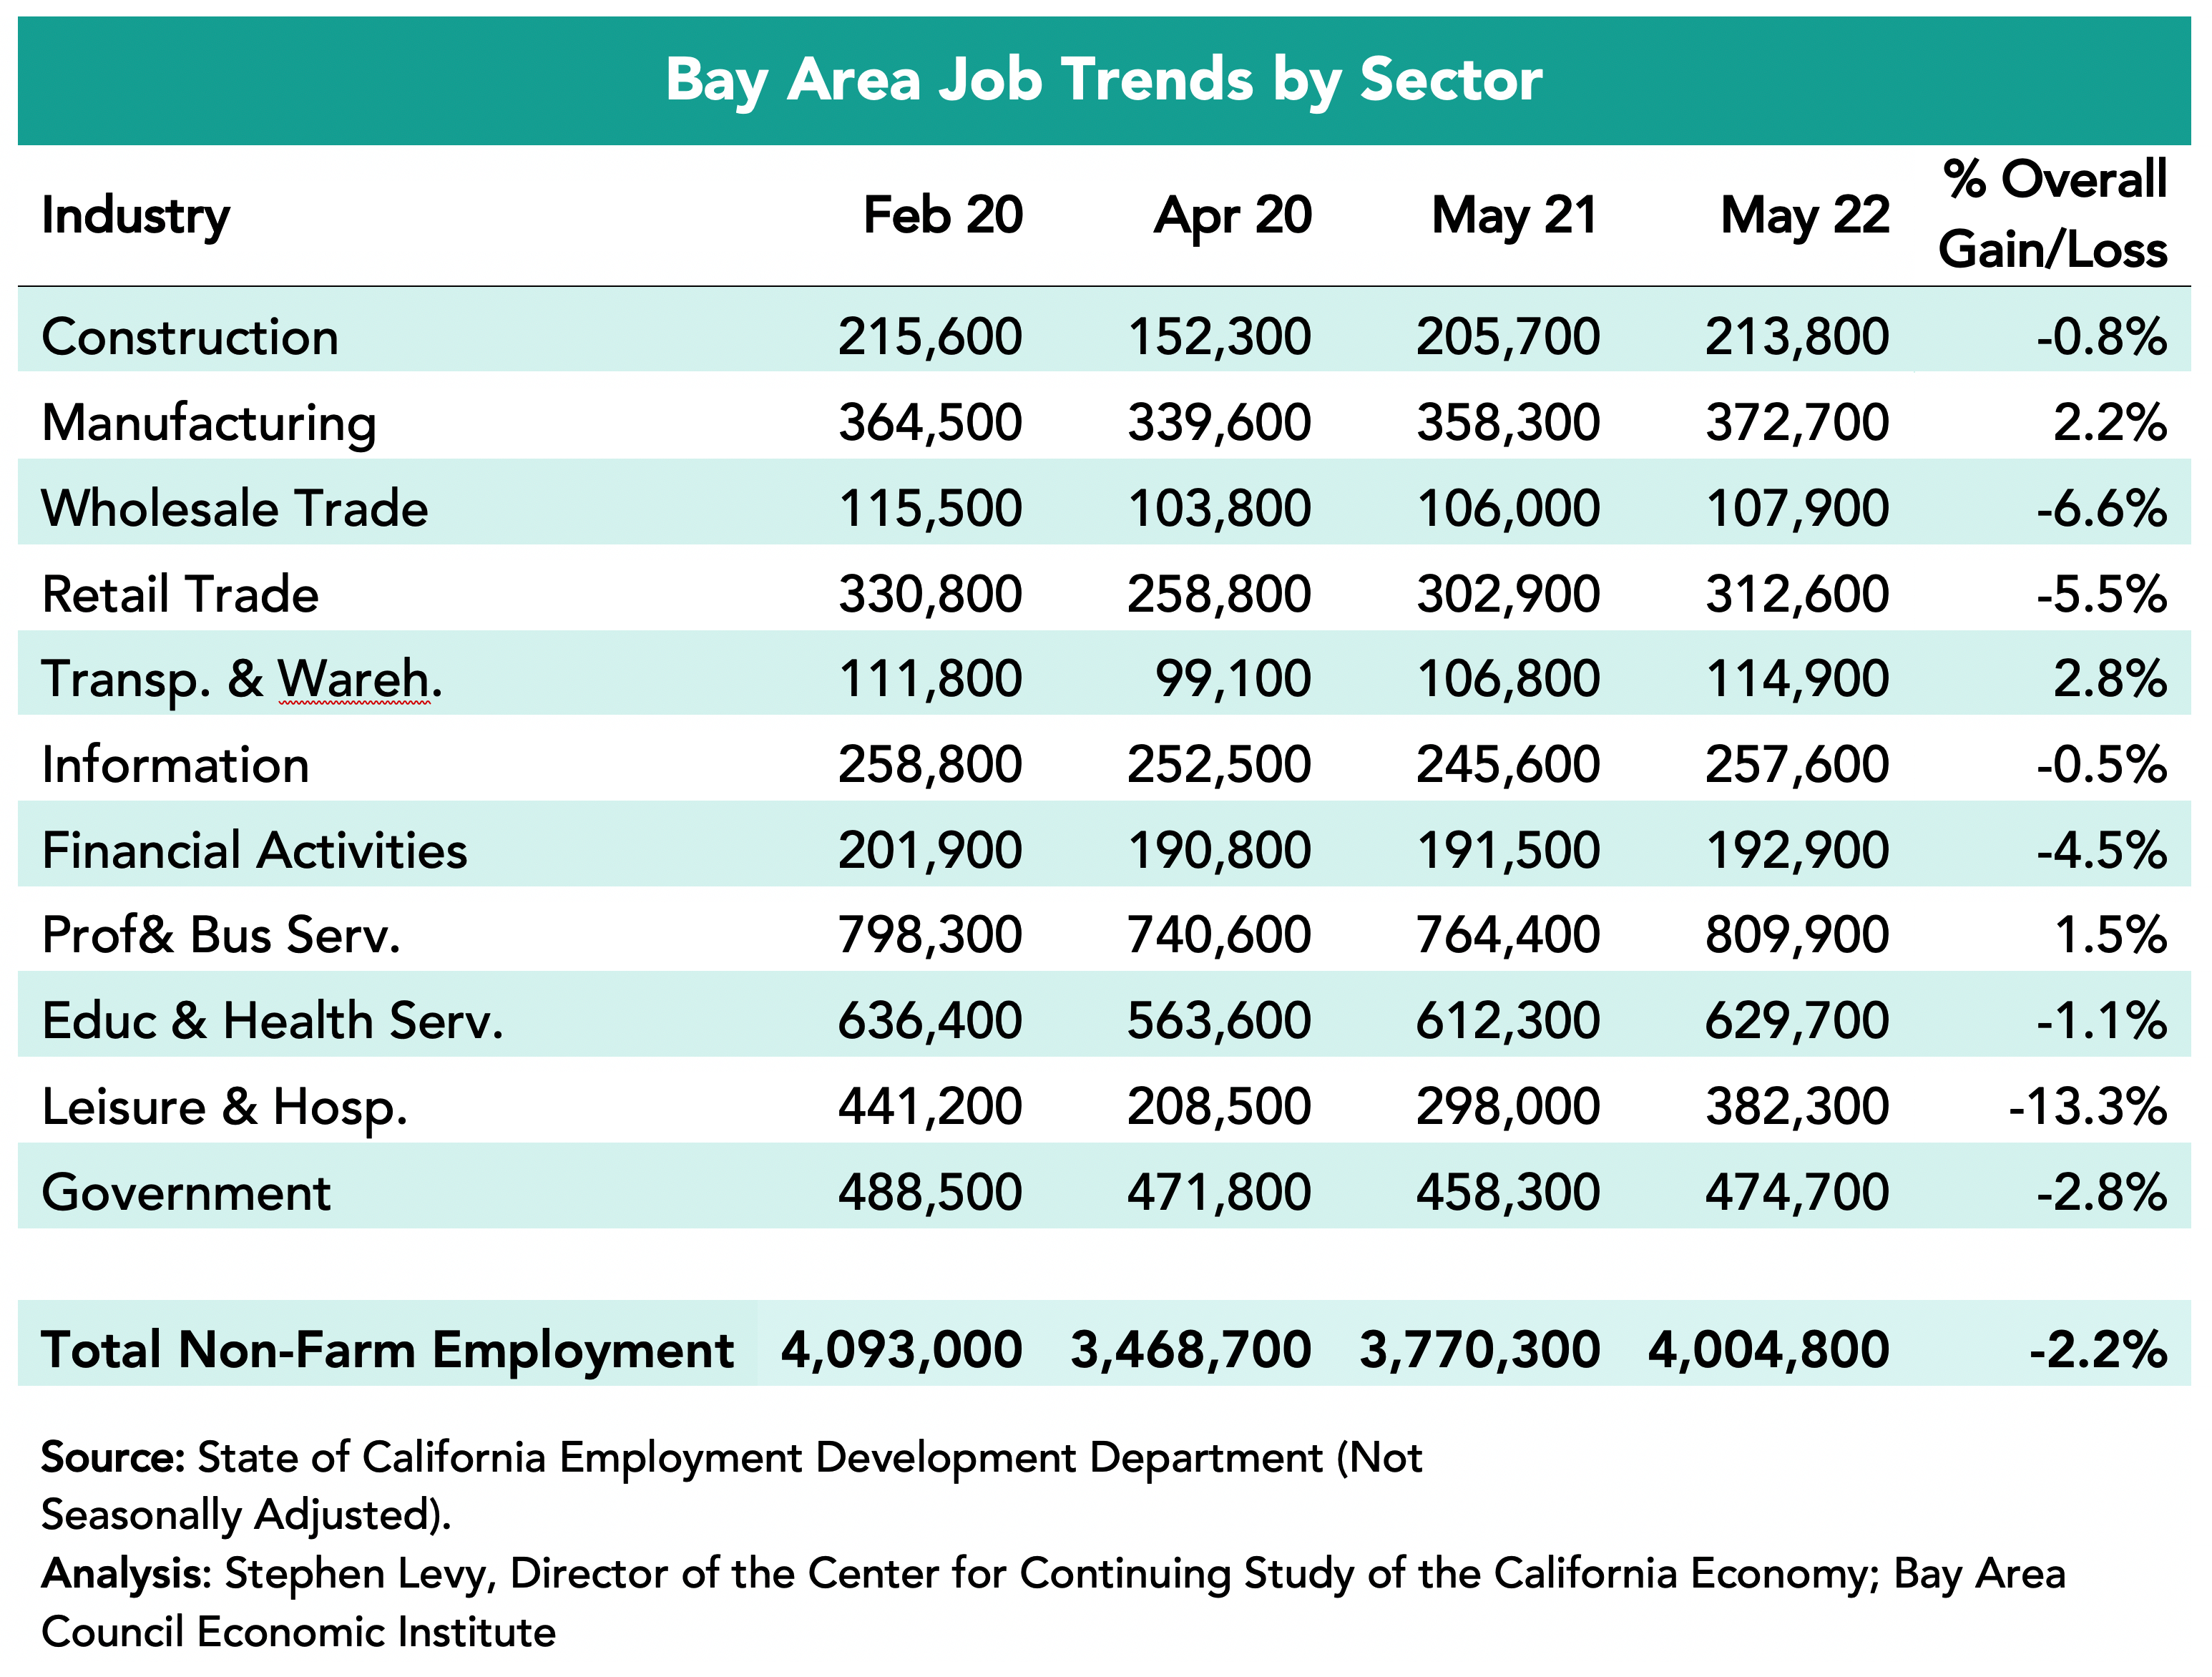
Four sectors—Manufacturing, Transportation and Warehousing, Information and Professional and Business Services—exceeded pre-pandemic job levels in April 2022 and Construction and Education and Health Care Services were close to full recovery. On the other hand, the Leisure and Hospitality sector recovered only 72% of lost jobs by April 2022, though travel and tourism jobs are now picking up again. The Government sector is now slowly recovering the jobs lost between February and April 2020.
Housing Permits Rebound to 2019 Levels in 2021
Housing permit levels were up 35.5% in 2021 over 2020 levels and equaled permit levels in 2019. In the first two months of 2022, permit levels were slightly above comparable 2021 months. There are positive and negative trends going forward. On the one hand, each week brings new large housing proposals and approvals. At the same time mortgage rates and prices and rents are surging.
This year all Bay Area cities are required to update their Housing Elements to meet greatly increased regional and local jurisdiction housing goals. Below is a link to a report released on March 18th that I prepared at the request of the Silicon Valley Community Foundation to help residents understand and engage in their city’s Housing Element update process. Although the report focuses on five Midpeninsula cities—Cupertino, Menlo Park, Mountain View, Palo Alto and Sunnyvale—it has broad applicability for other communities. The report is part of an engagement effort led by SV@Home with local partners.
The report is part of an engagement effort led by SV@Home with local partners.
These economic updates are authored by Stephen Levy, Director of the Center for Continuing Study of the California Economy, and a member of the Bay Area Council Economic Institute board.
Slower Job Growth in March and Some Good News in the Report
February 19, 2022
The Bay Area added 13,100 payroll jobs in March down from 22,100 in February but is still outpacing the nation in job growth over the past 12 months after the sharp job losses in 2020.
The highlights:
• Bay Area jobs increased by 6.2% between March 2021 and 2022 compared to a 4.5% increase in the nation and 6.4% gain in California.
• The Bay Area unemployment rate in March 2022 was 2.9% compared to 2.7% in the pre-pandemic low.
• More workers returned to the workforce in March and non-traditional job growth continues to outpace payroll job growth drawing workers back to the labor force and pushing unemployment levels down.
• April 2022 brings major crosscurrents to the global, national and regional economy with the Russian invasion of Ukraine, rising interest rates amidst continuing high inflation and the ongoing Bay Area challenges of housing, transportation and competitiveness.
• Bay Area jurisdictions have been given large increases in their housing goals for the next eight years as a result of state legislation and policy to reduce overcrowding and increase affordability. Each jurisdiction is in the process of updating their Housing Elements in 2022 to meet state and regional policy goals and requirements.
The Bay Area Outpaced the Nation in Recent Job Growth
Bay Area payroll jobs increased by 6.2% between March 2021 and March 2022 outpacing the U.S. 4.5% growth rate. The region still lags the nation and state in the % of jobs recovered since April 2020 as a result of the large job losses in 2020.
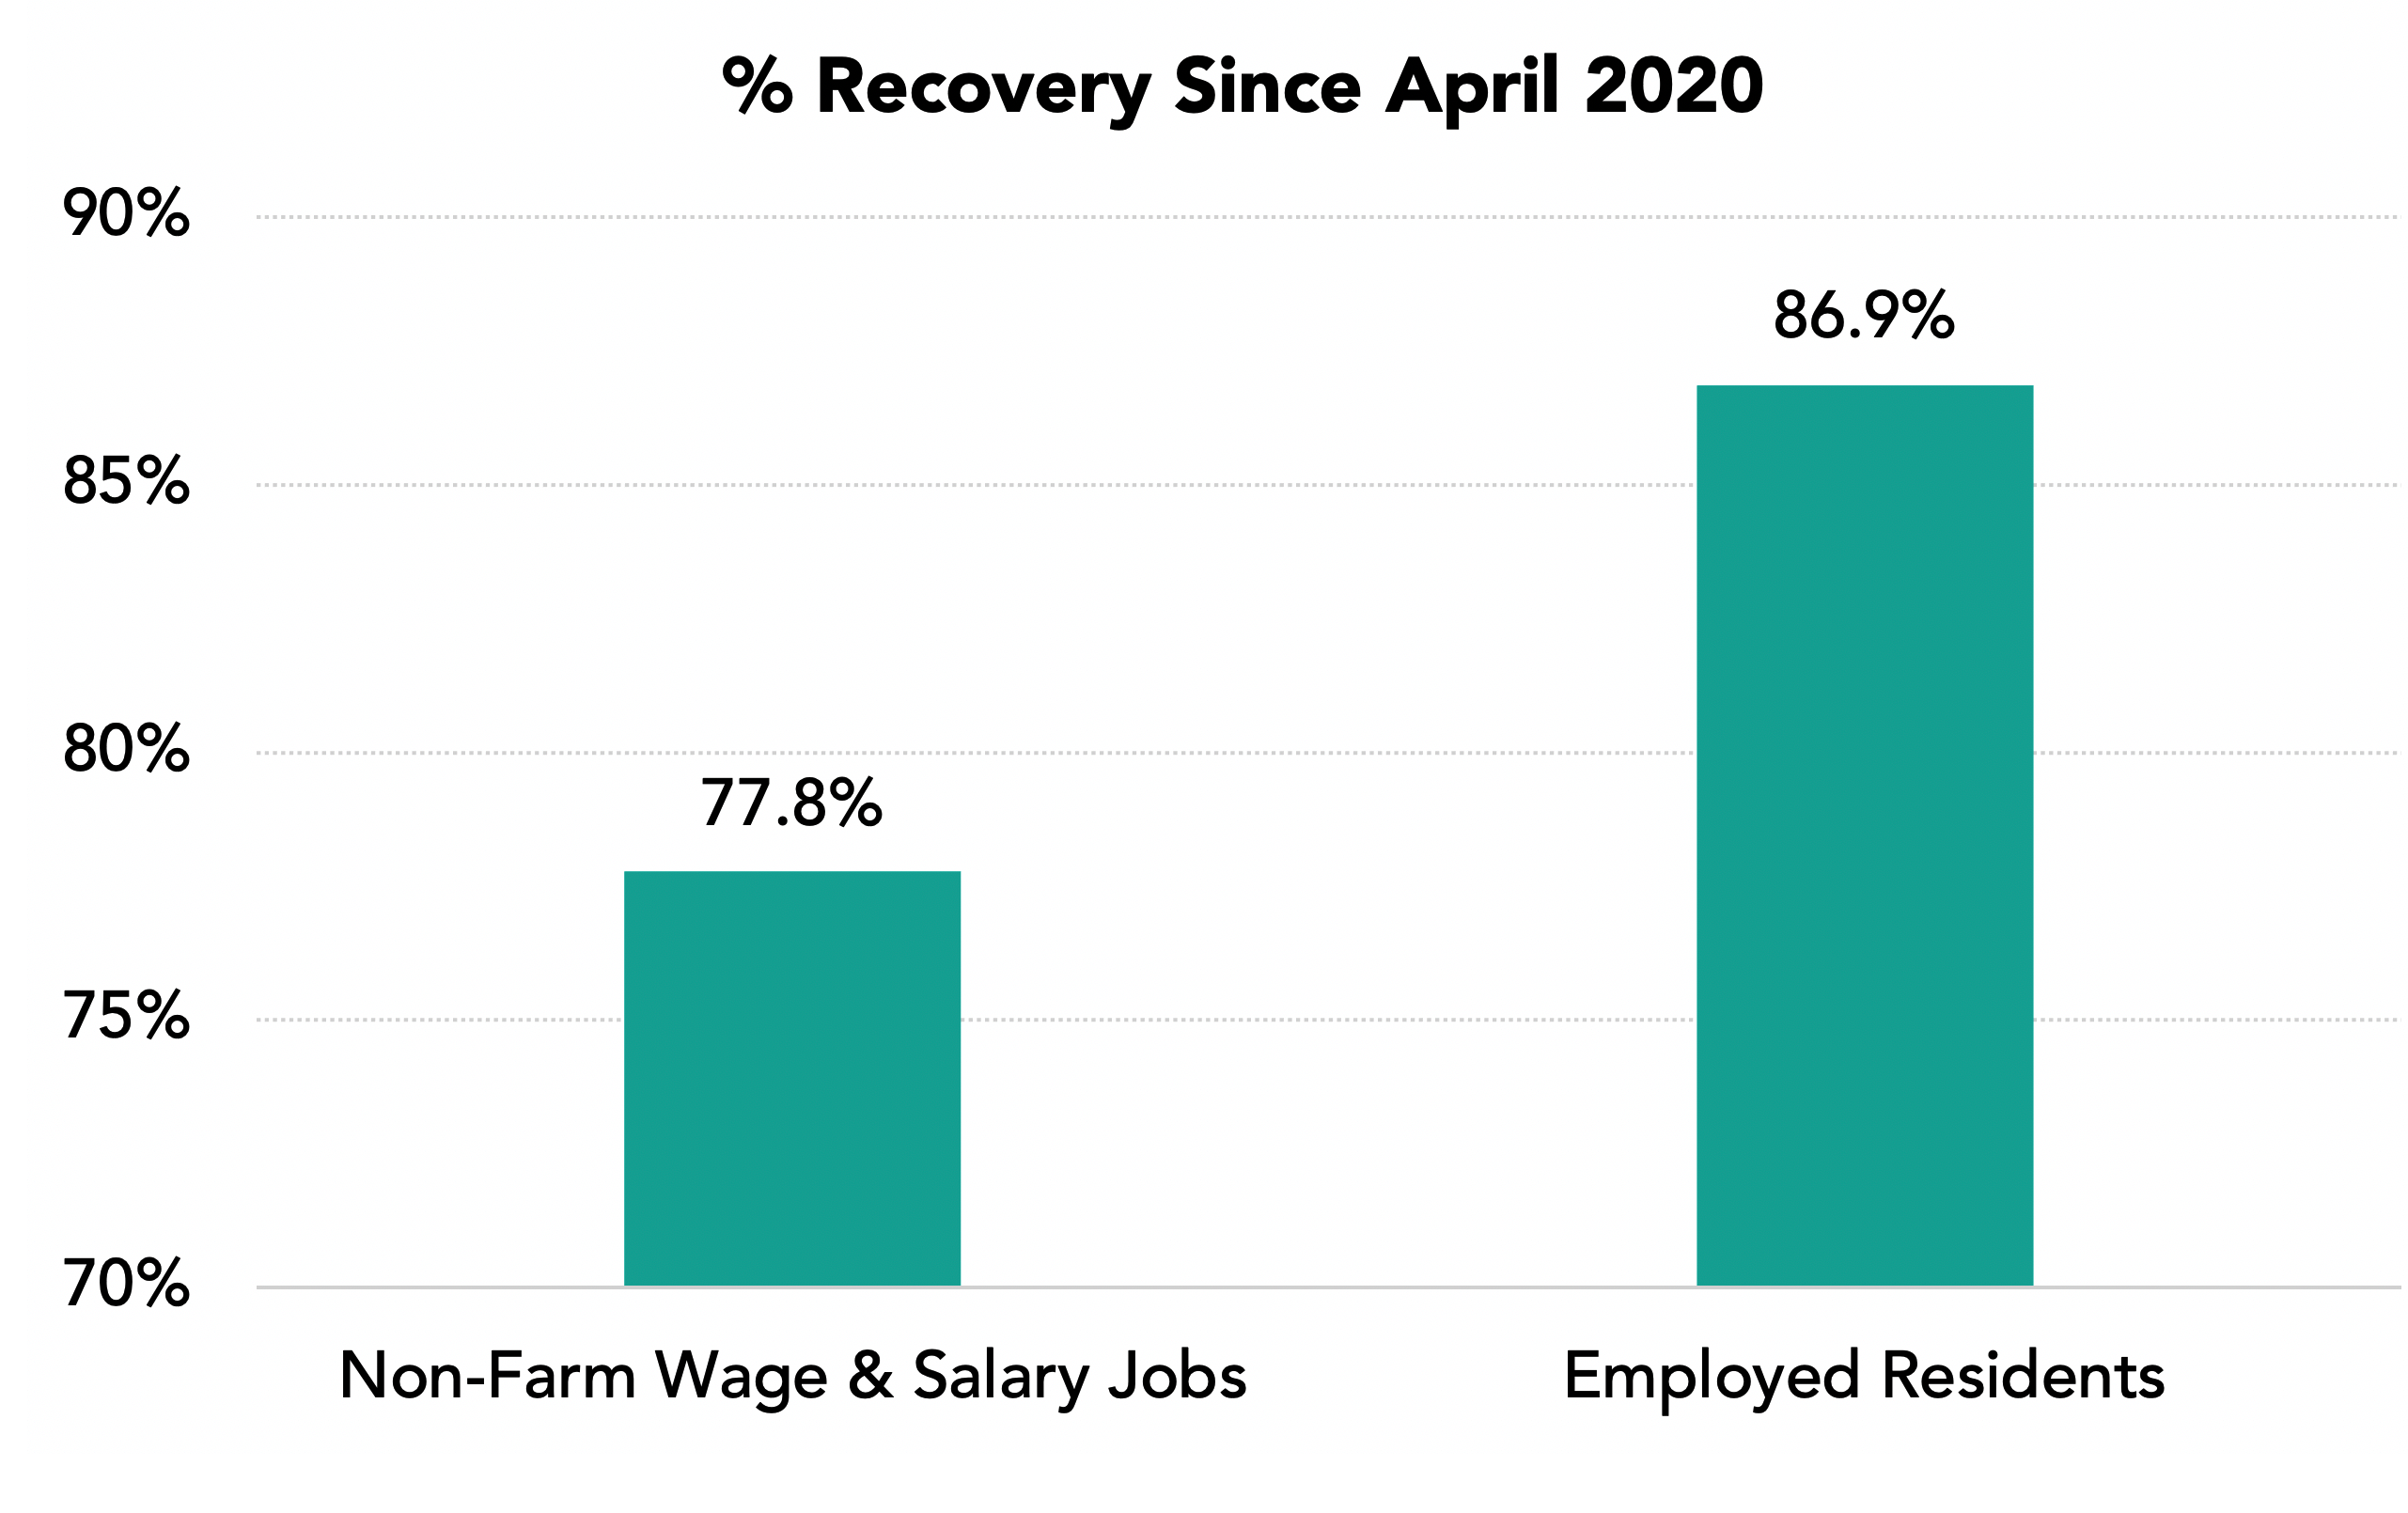
By March 2022 the region had recovered 77.8% of the jobs lost between February and April 2020. This is a lower recovery rate than the state and nation, though the region has closed the gap in recent months.
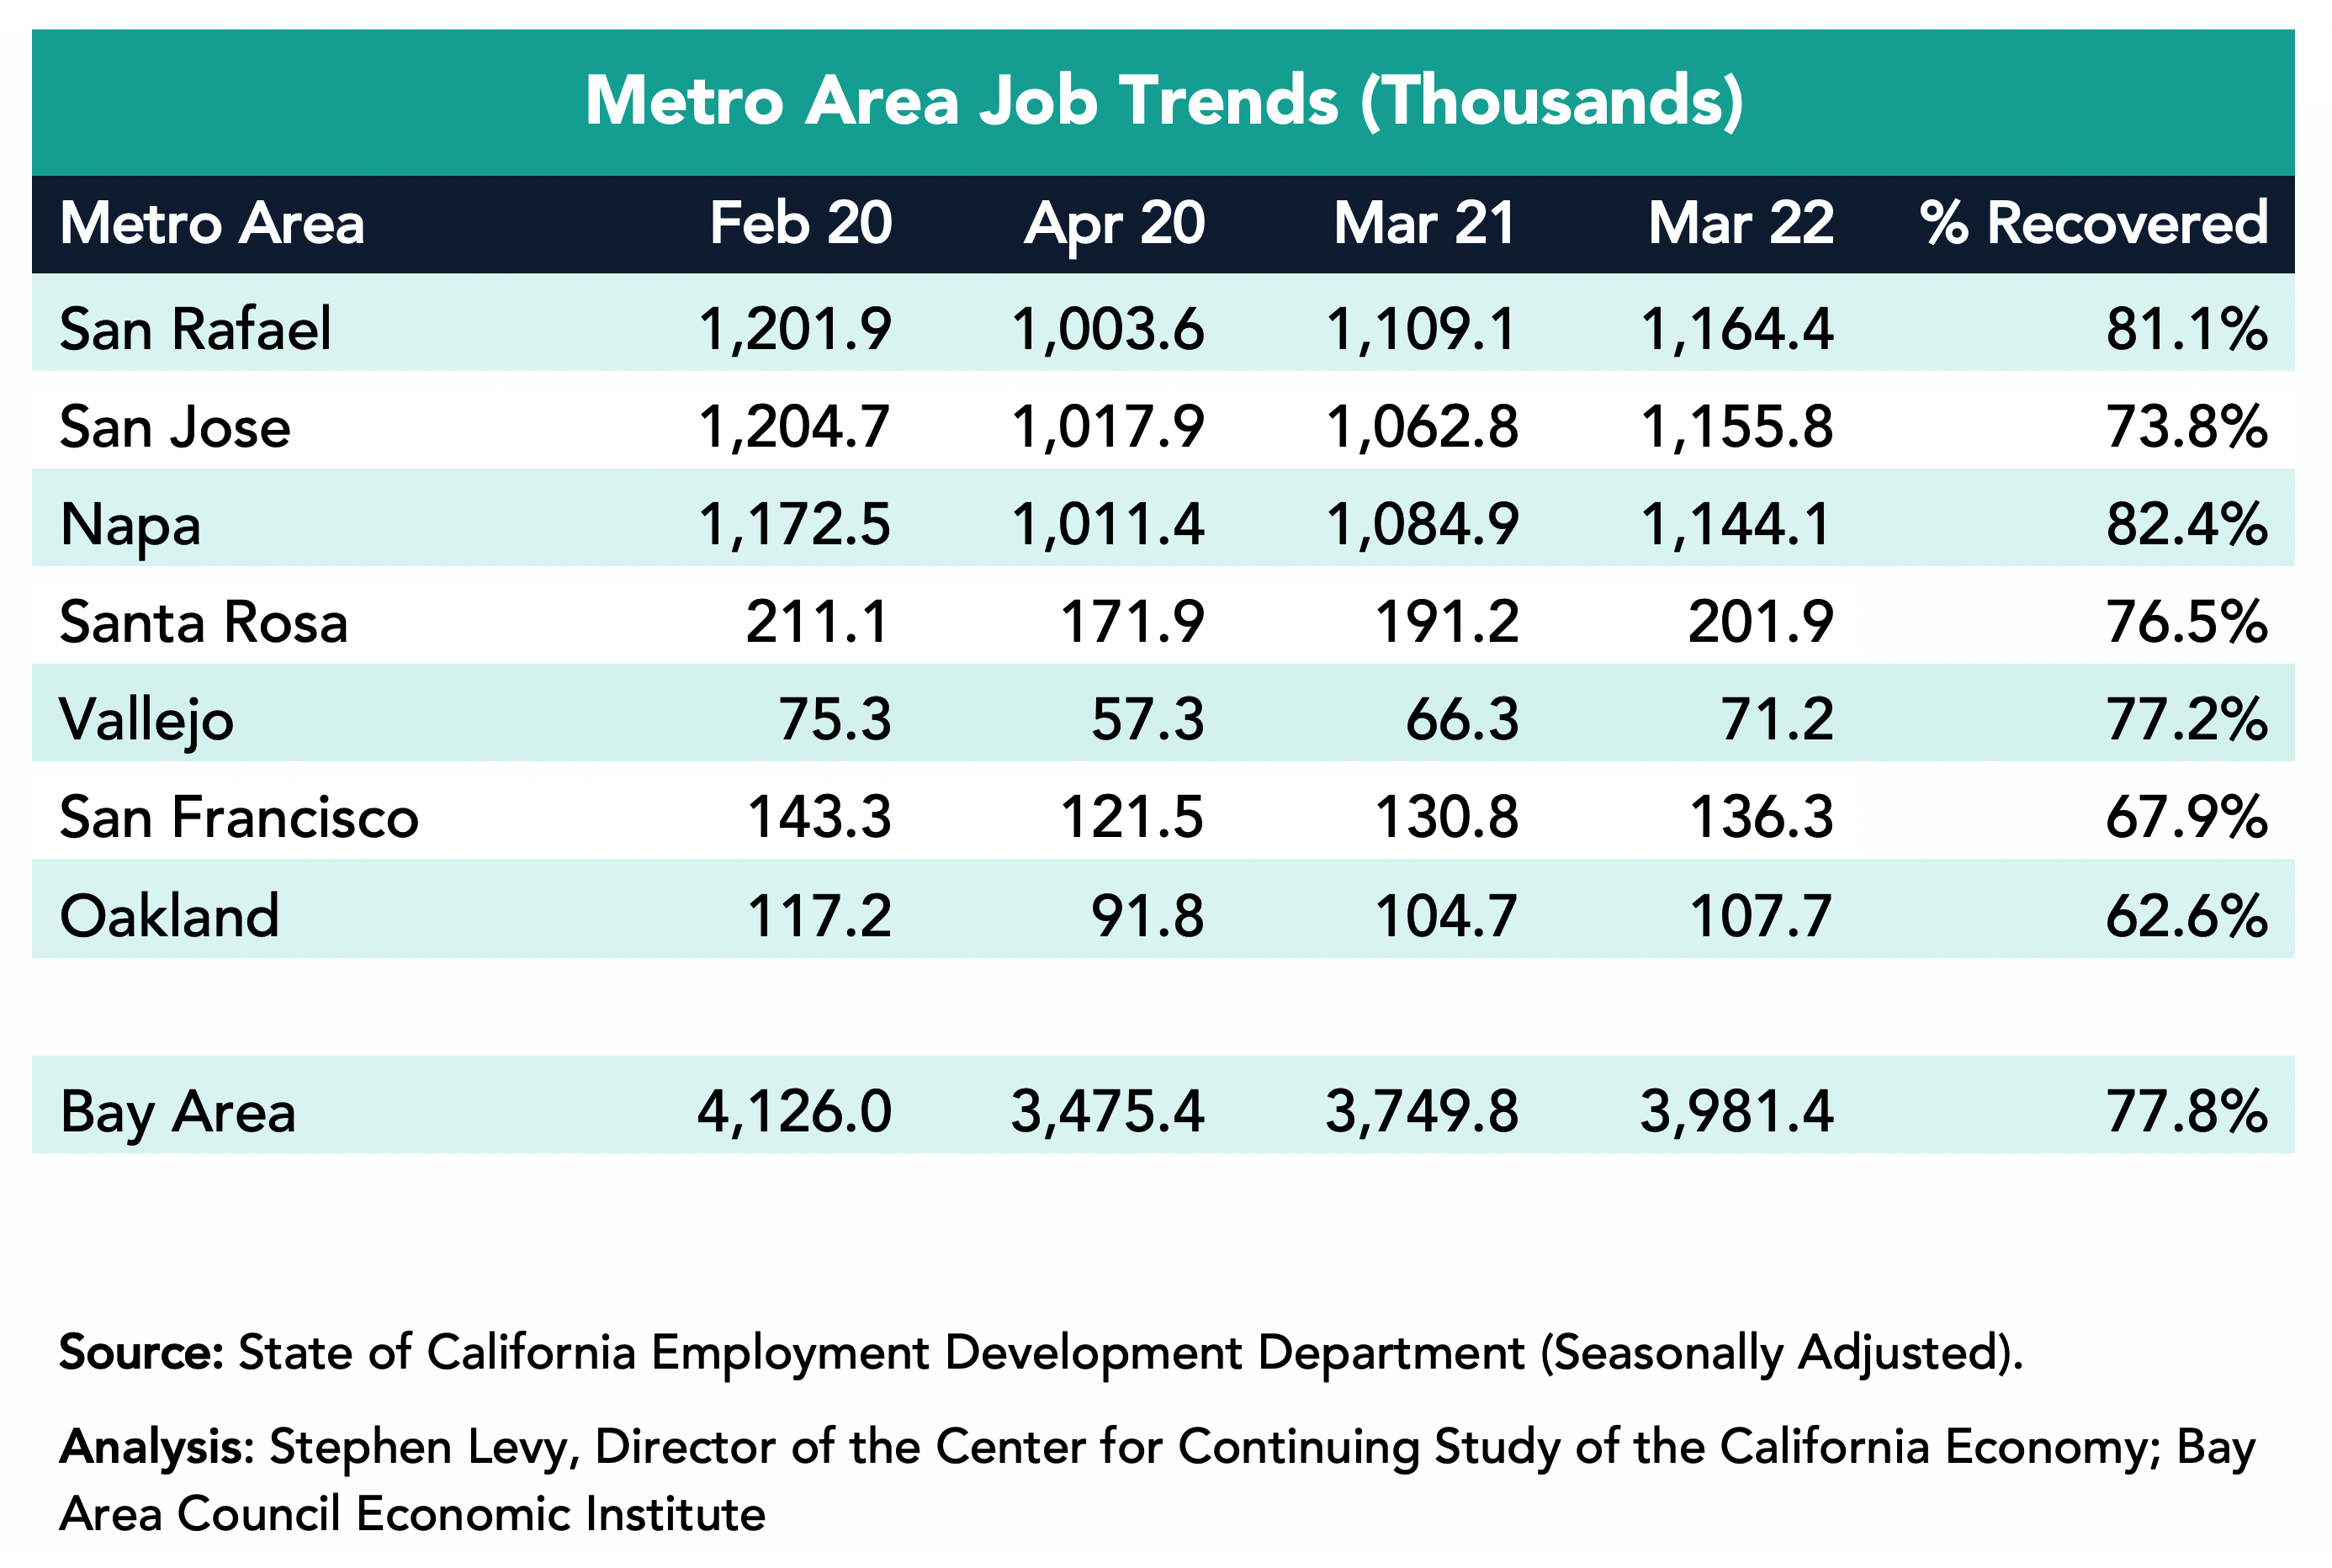
The Bay Area added 231,600 jobs in the past year led by a gain of 93,000 in the San Francisco metro area though SF has recovered just 73.8% of the jobs lost between February and April 2020. The San Jose metro area added 59,200 jobs and by March 2022 had recovered 82.4% of the jobs lost between February and April 2020. The Oakland metro area added 55,300 jobs.
By March 2022 the region had recovered 77.8% of the jobs lost between February and April 2020. This is a lower recovery rate than the state and nation, though the region has closed the gap in recent months.
Unemployment Rates Fell to 2.9% in the Region in March 2022 from 6.5% in March 2021.
The lowest rates were in the San Rafael and San Francisco metro areas (2.4%) followed by the San Jose metro areas (2.5%) in March 2022.
The number of unemployed residents has fallen sharply from the April 2020 high and from March 2021 to 120,500 in February 2022 close to the pre-pandemic low in February.
But 58,700 Workers Have Not Rejoined the Workforce Since February 2020
Residents who are not in the labor force are not counted as unemployed. As a result, the number of unemployed residents can decline while some are still prevented by choice or lack of child care or work in industries that have not fully recovered. However, more workers are now returning to the workforce with an addition of 24,800 in March and 170,800 over the past 12 months.
Industries Were Affected Differently
Four sectors—Manufacturing, Transportation and Warehousing, Information and Professional and Business Services—exceeded pre-pandemic job levels in March 2022 and Construction and Education and Health Care Services were close to full recovery. On the other hand, the Leisure and Hospitality sector recovered only 66.8% of lost jobs by March 2022 though travel and tourism are now picking up again. The Government sector still has fewer jobs now than in April 2020.
Housing Permits Rebound to 2019 Levels in 2021
Housing permit levels were up 35.5% in 2021 over 2020 levels and equaled permit levels in 2019. In the first two months of 2022, permit levels were slightly above comparable 2021 months. There are positive and negative trends going forward. On the one hand, each week brings new large housing proposals and approvals. At the same time mortgage rates and prices and rents are surging.
This year all Bay Area cities are required to update their Housing Elements to meet greatly increased regional and local jurisdiction housing goals. Below is a link to a report released on March 18th that I prepared at the request of the Silicon Valley Community Foundation to help residents understand and engage in their city’s Housing Element update process. Although the report focuses on five Midpeninsula cities—Cupertino, Menlo Park, Mountain View, Palo Alto and Sunnyvale—it has broad applicability for other communities. The report is part of an engagement effort led by SV@Home with local partners.
The report is part of an engagement effort led by SV@Home with local partners.
These economic updates are authored by Stephen Levy, Director of the Center for Continuing Study of the California Economy, and a member of the Bay Area Council Economic Institute board.
What is SB288?
The purpose of SB288 (Wiener) is to reduce the time and cost of delivering sustainable transportation projects across California by exempting certain projects from CEQA that are in the public right of way and are in an environmentally cleared long-term plan. SB288 is a safer route than taking advantage of existing categorical exemptions, which can require extensive analyses to prove the project is exempt and can still be challenged in court. The law sunsets on December 31, 2022.
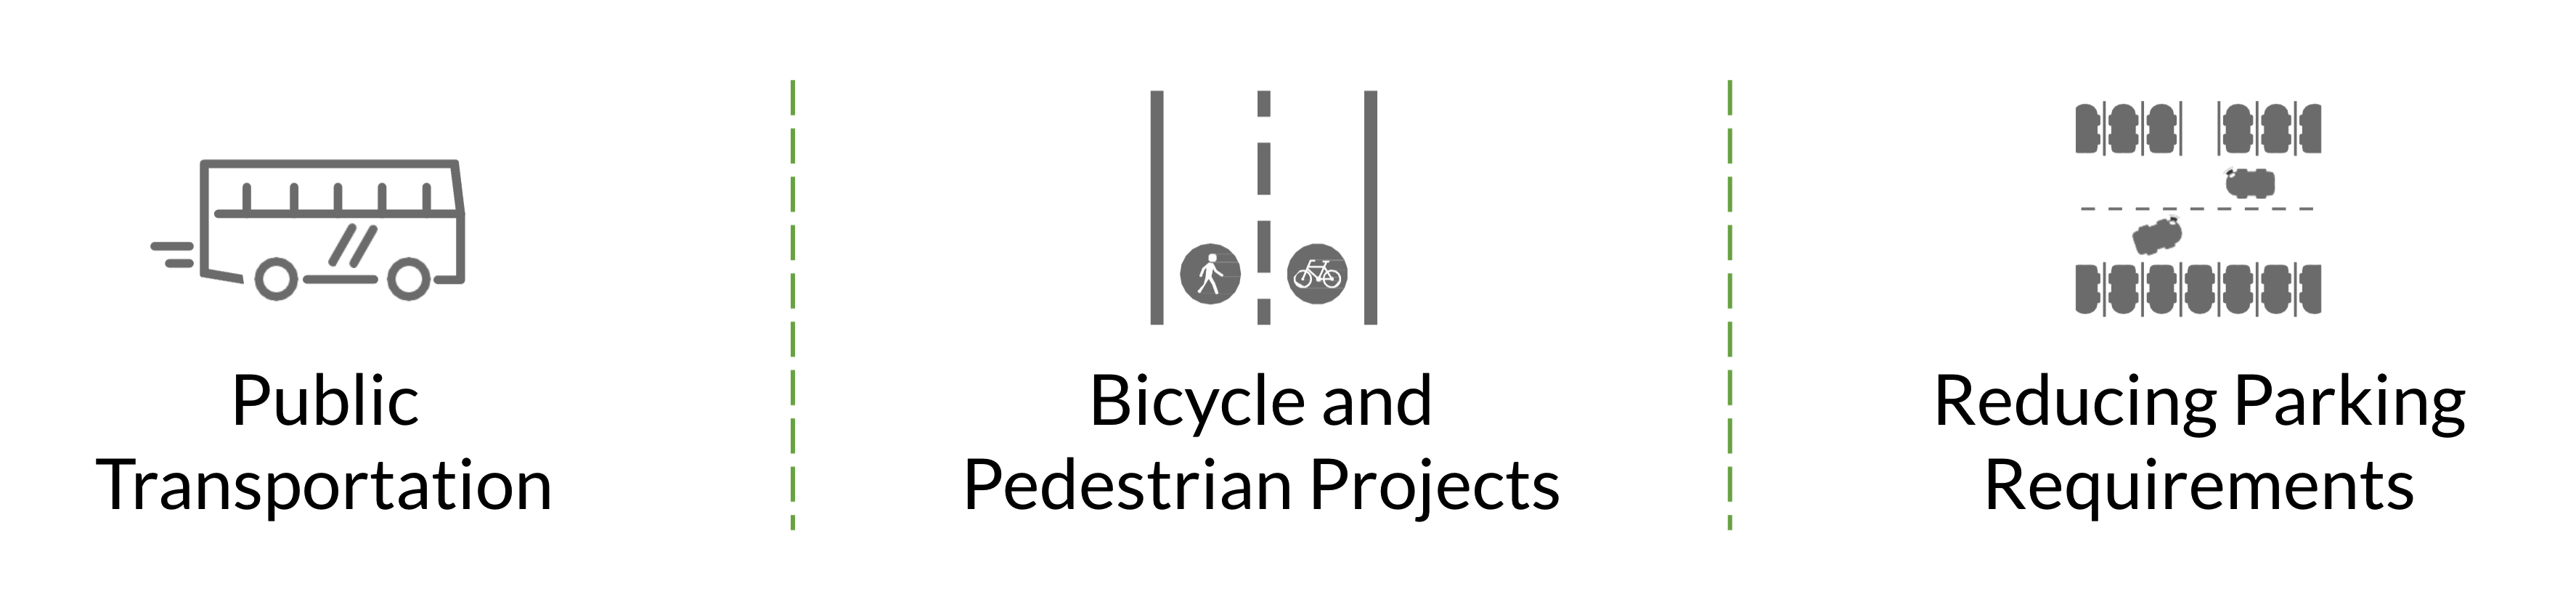
SB288 provides statutory exemptions from CEQA for:
Potential benefits include:
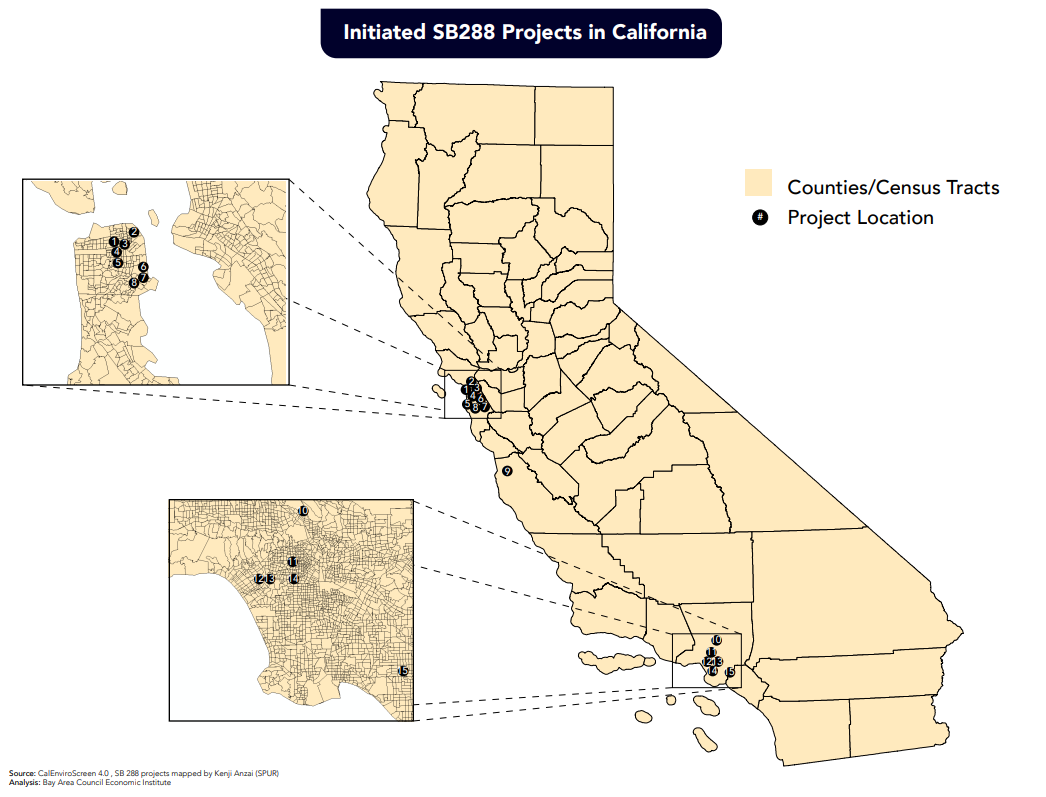
Bill’s Impacts to-date:
The SB288 project team mapped the CEQA projects that have been initiated to date, and those under consideration to understand where agencies have been using the exemption and for what project types the exemption is most frequently used.
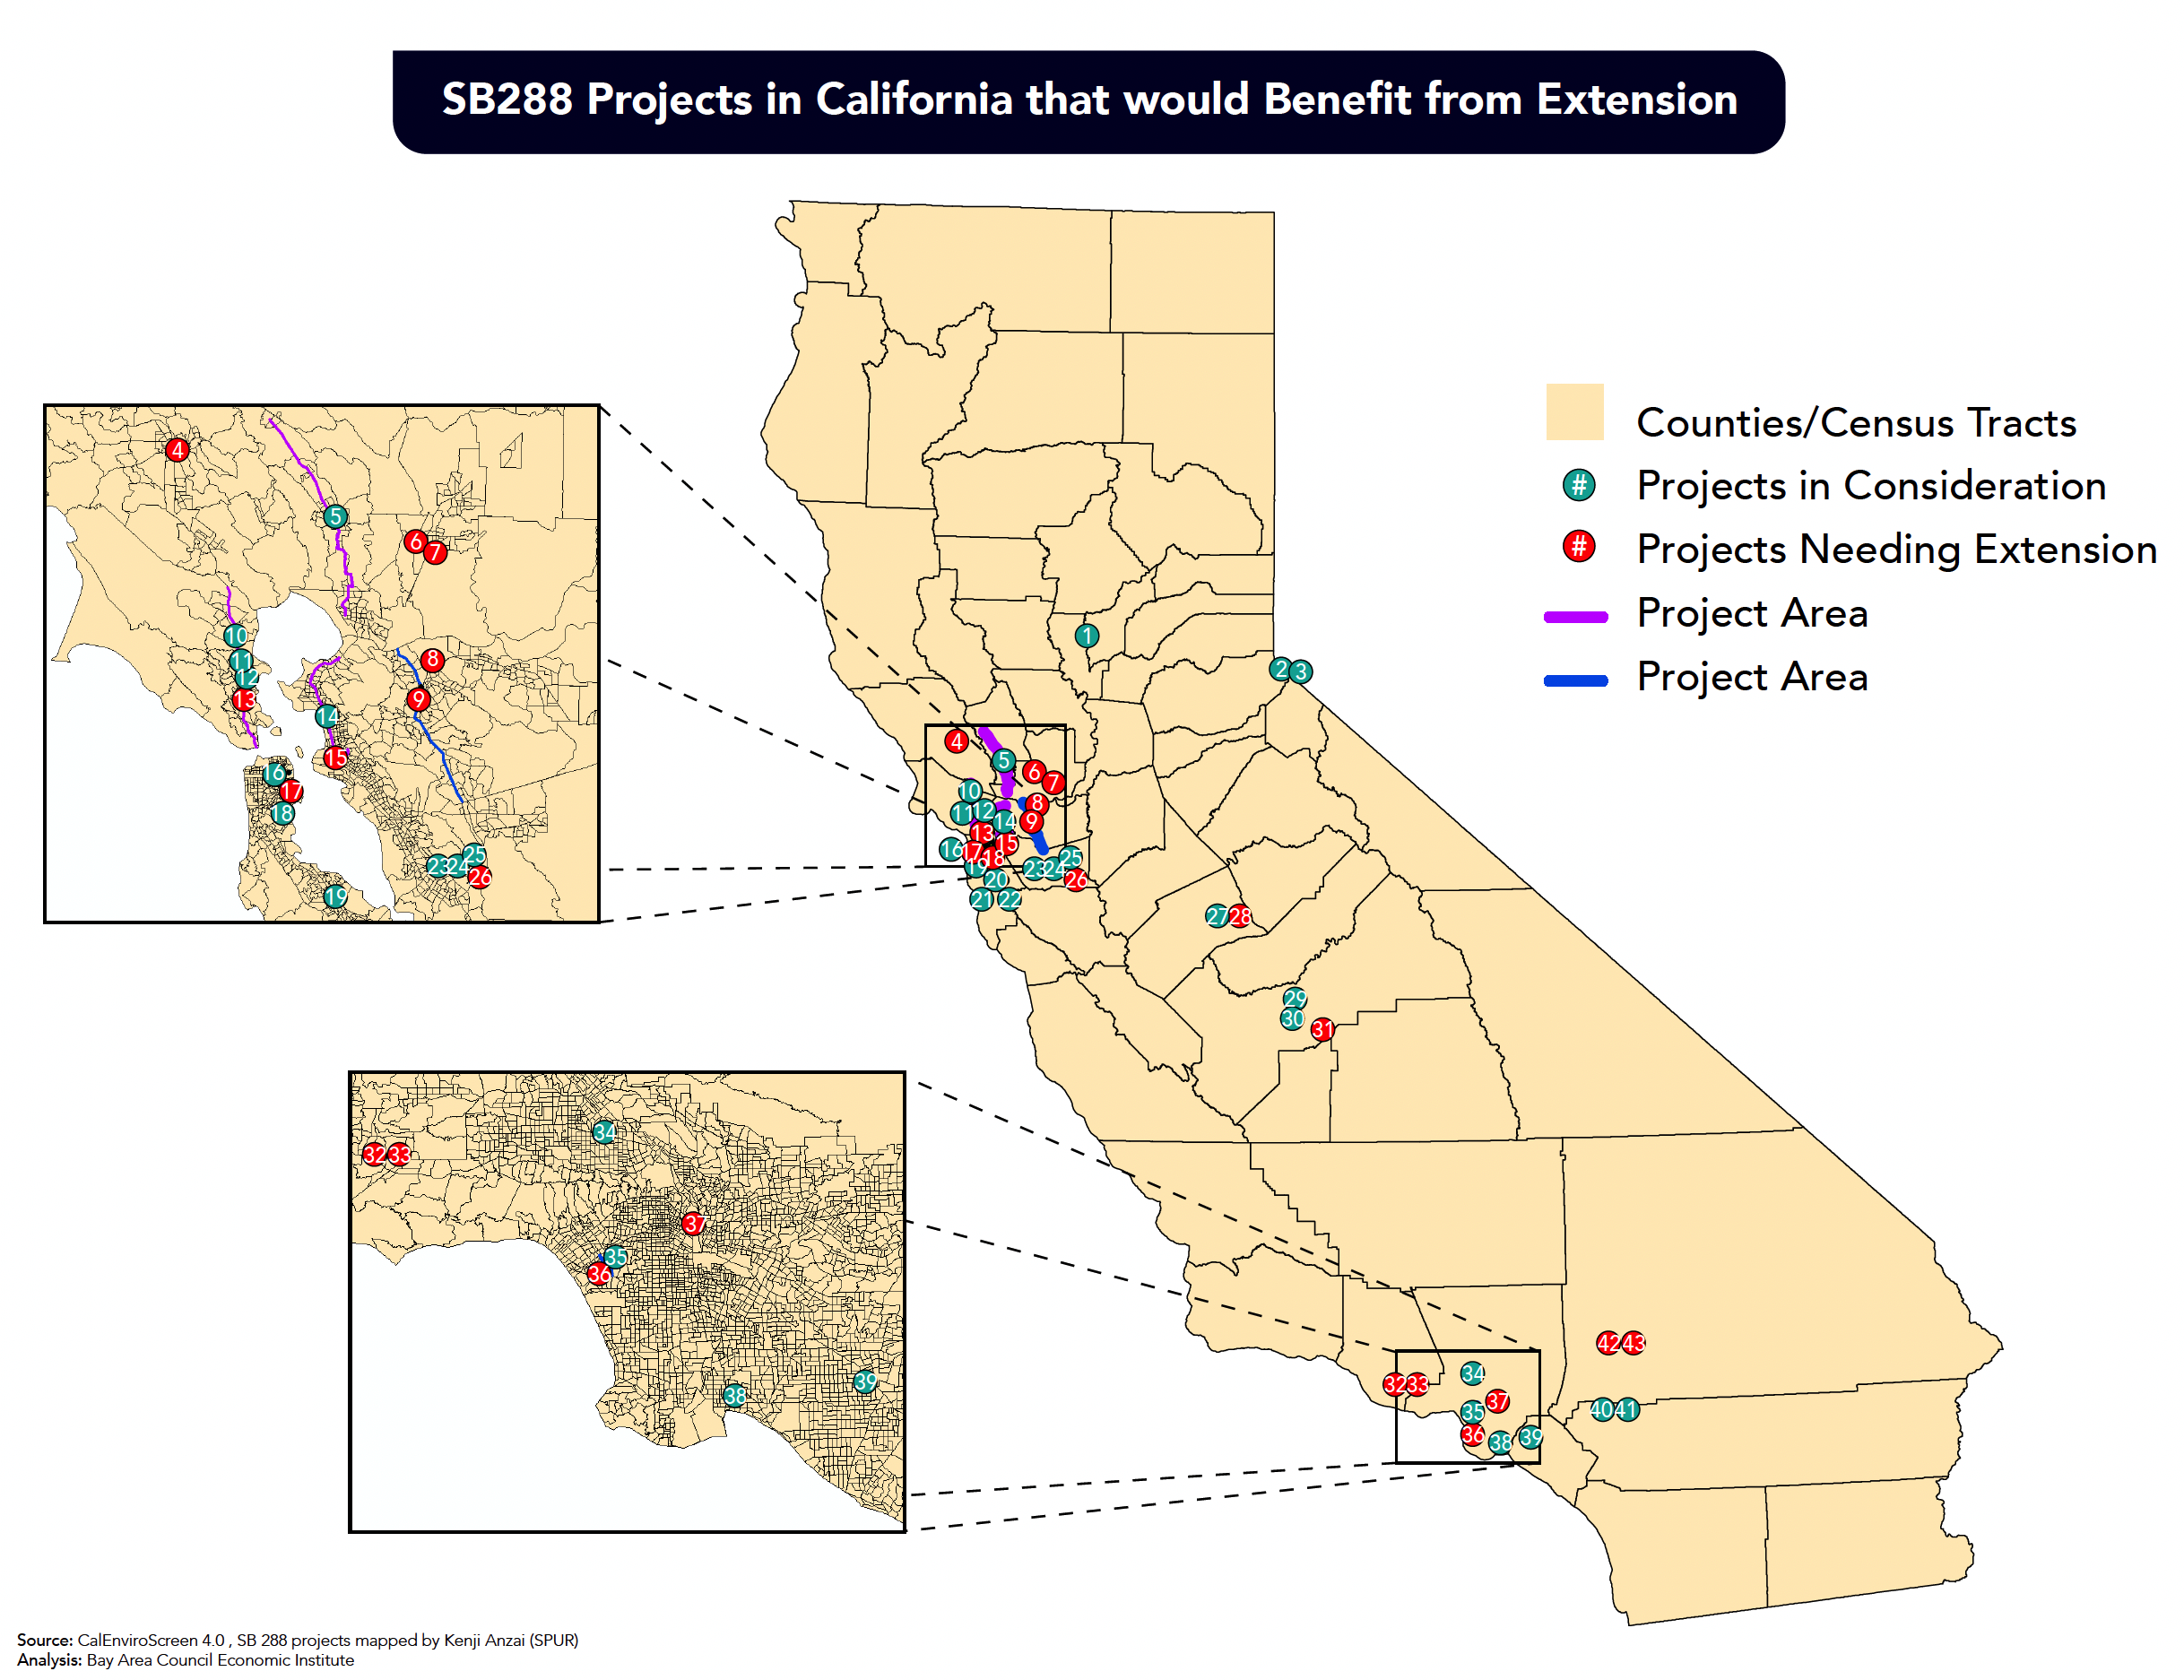
SB922 was introduced in February 2022 by Senator Wiener; the bill extends the existing exemption, fine-tunes the law for ease of implementation, has targeted expansions for electric fleet conversion, and adds an anti-displacement analysis requirement.
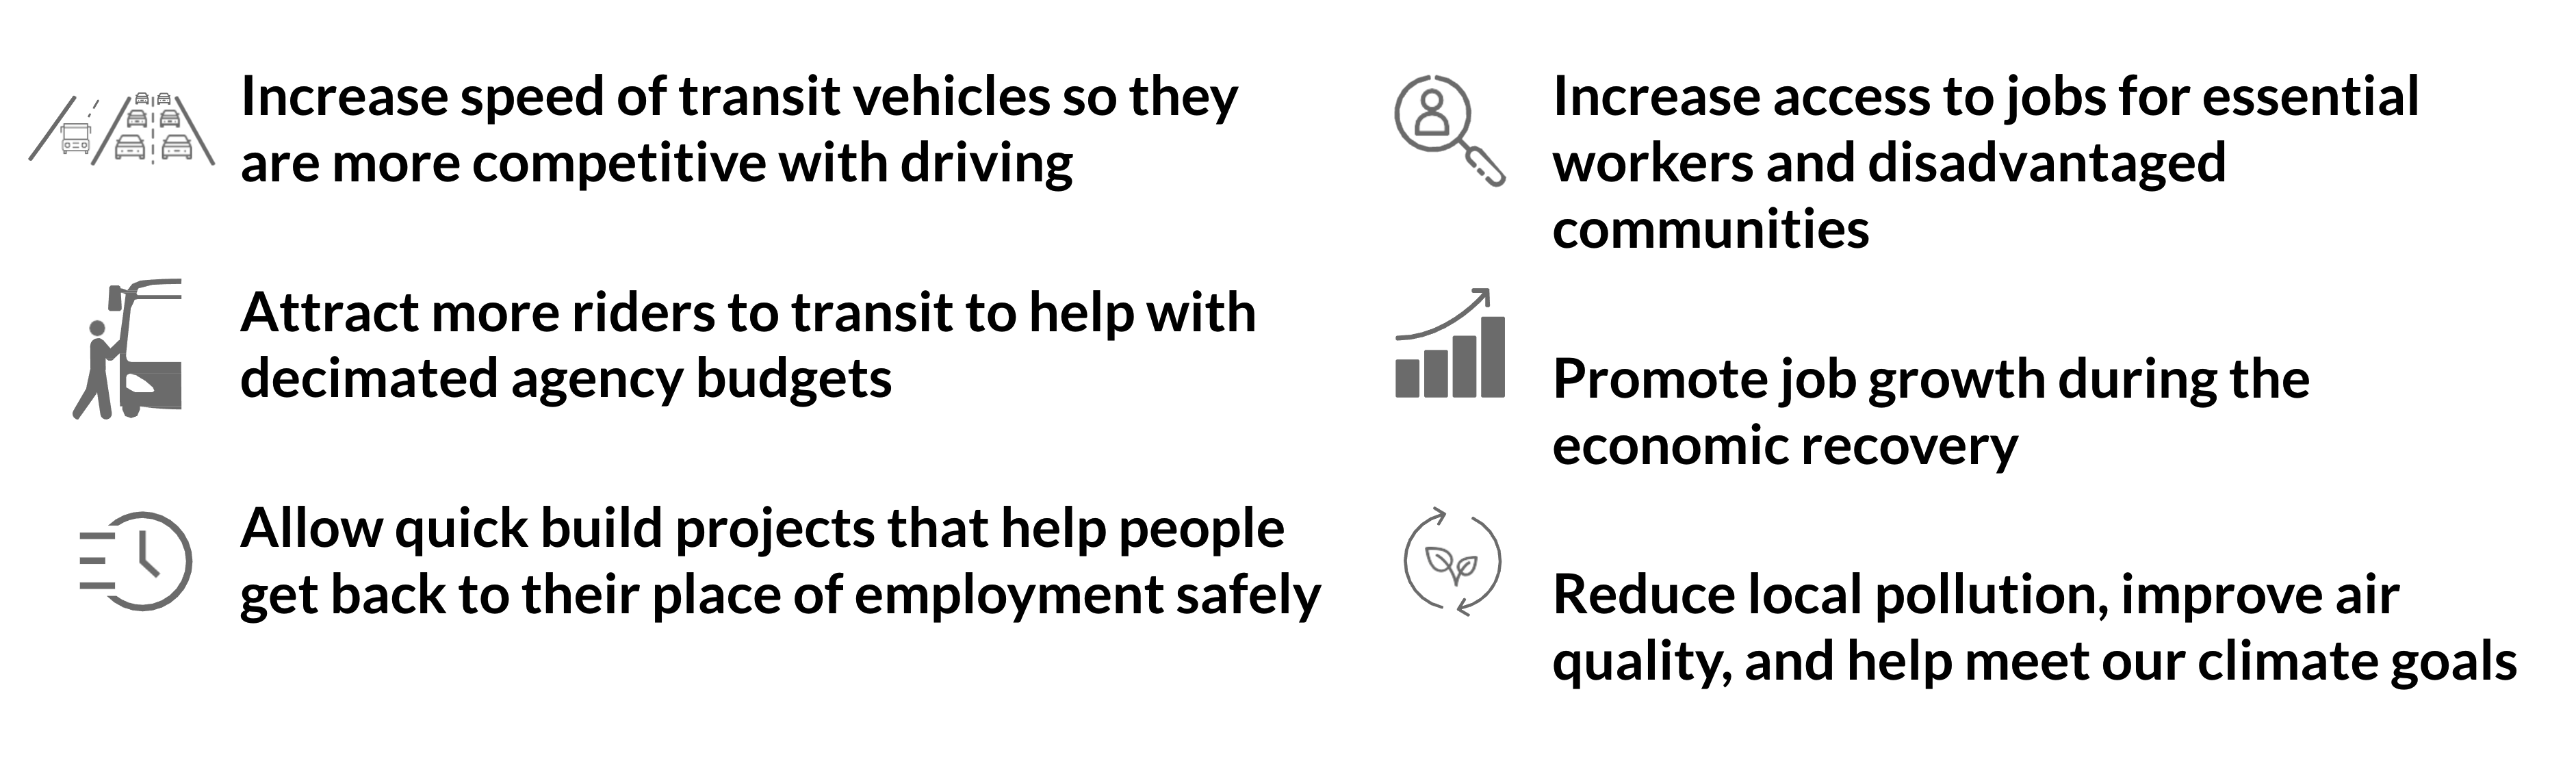
The goals of the bill are to:
• create safe, accessible and healthy communities for all;
• ensure reliable, high-quality transit for all;
• attract people back to transit;
• reduce climate pollution and congestion;
• reduce cumulative pollution burden in disadvantaged communities; and
• ensure meaningful involvement from communities impacted by the project.
With strict qualifying criteria, projects must be in an existing public right-of-way, be located in an urbanized area or urban cluster (50,000+ people), not add new auto capacity, not demolish affordable housing, and use a skilled and trained workforce. Projects that are over $100 million have additional criteria which include holding at least three public meetings, completion of a project business case to help the public engage in the project early, completion of a racial equity analysis and suggest mitigations for disproportionate impacts, and completion of a residential anti-displacement analysis on high-frequency projects in areas at risk of displacement.
The following organizations are co-sponsors of SB922:
Bay Area Economy Continues Recovery but Still Lags the Nation
March 31, 2022
The Bay Area added 24,500 jobs in February and outpaced the nation in job growth over the past 12 months but still lags the state and nation in job recovery since April 2020
The highlights:
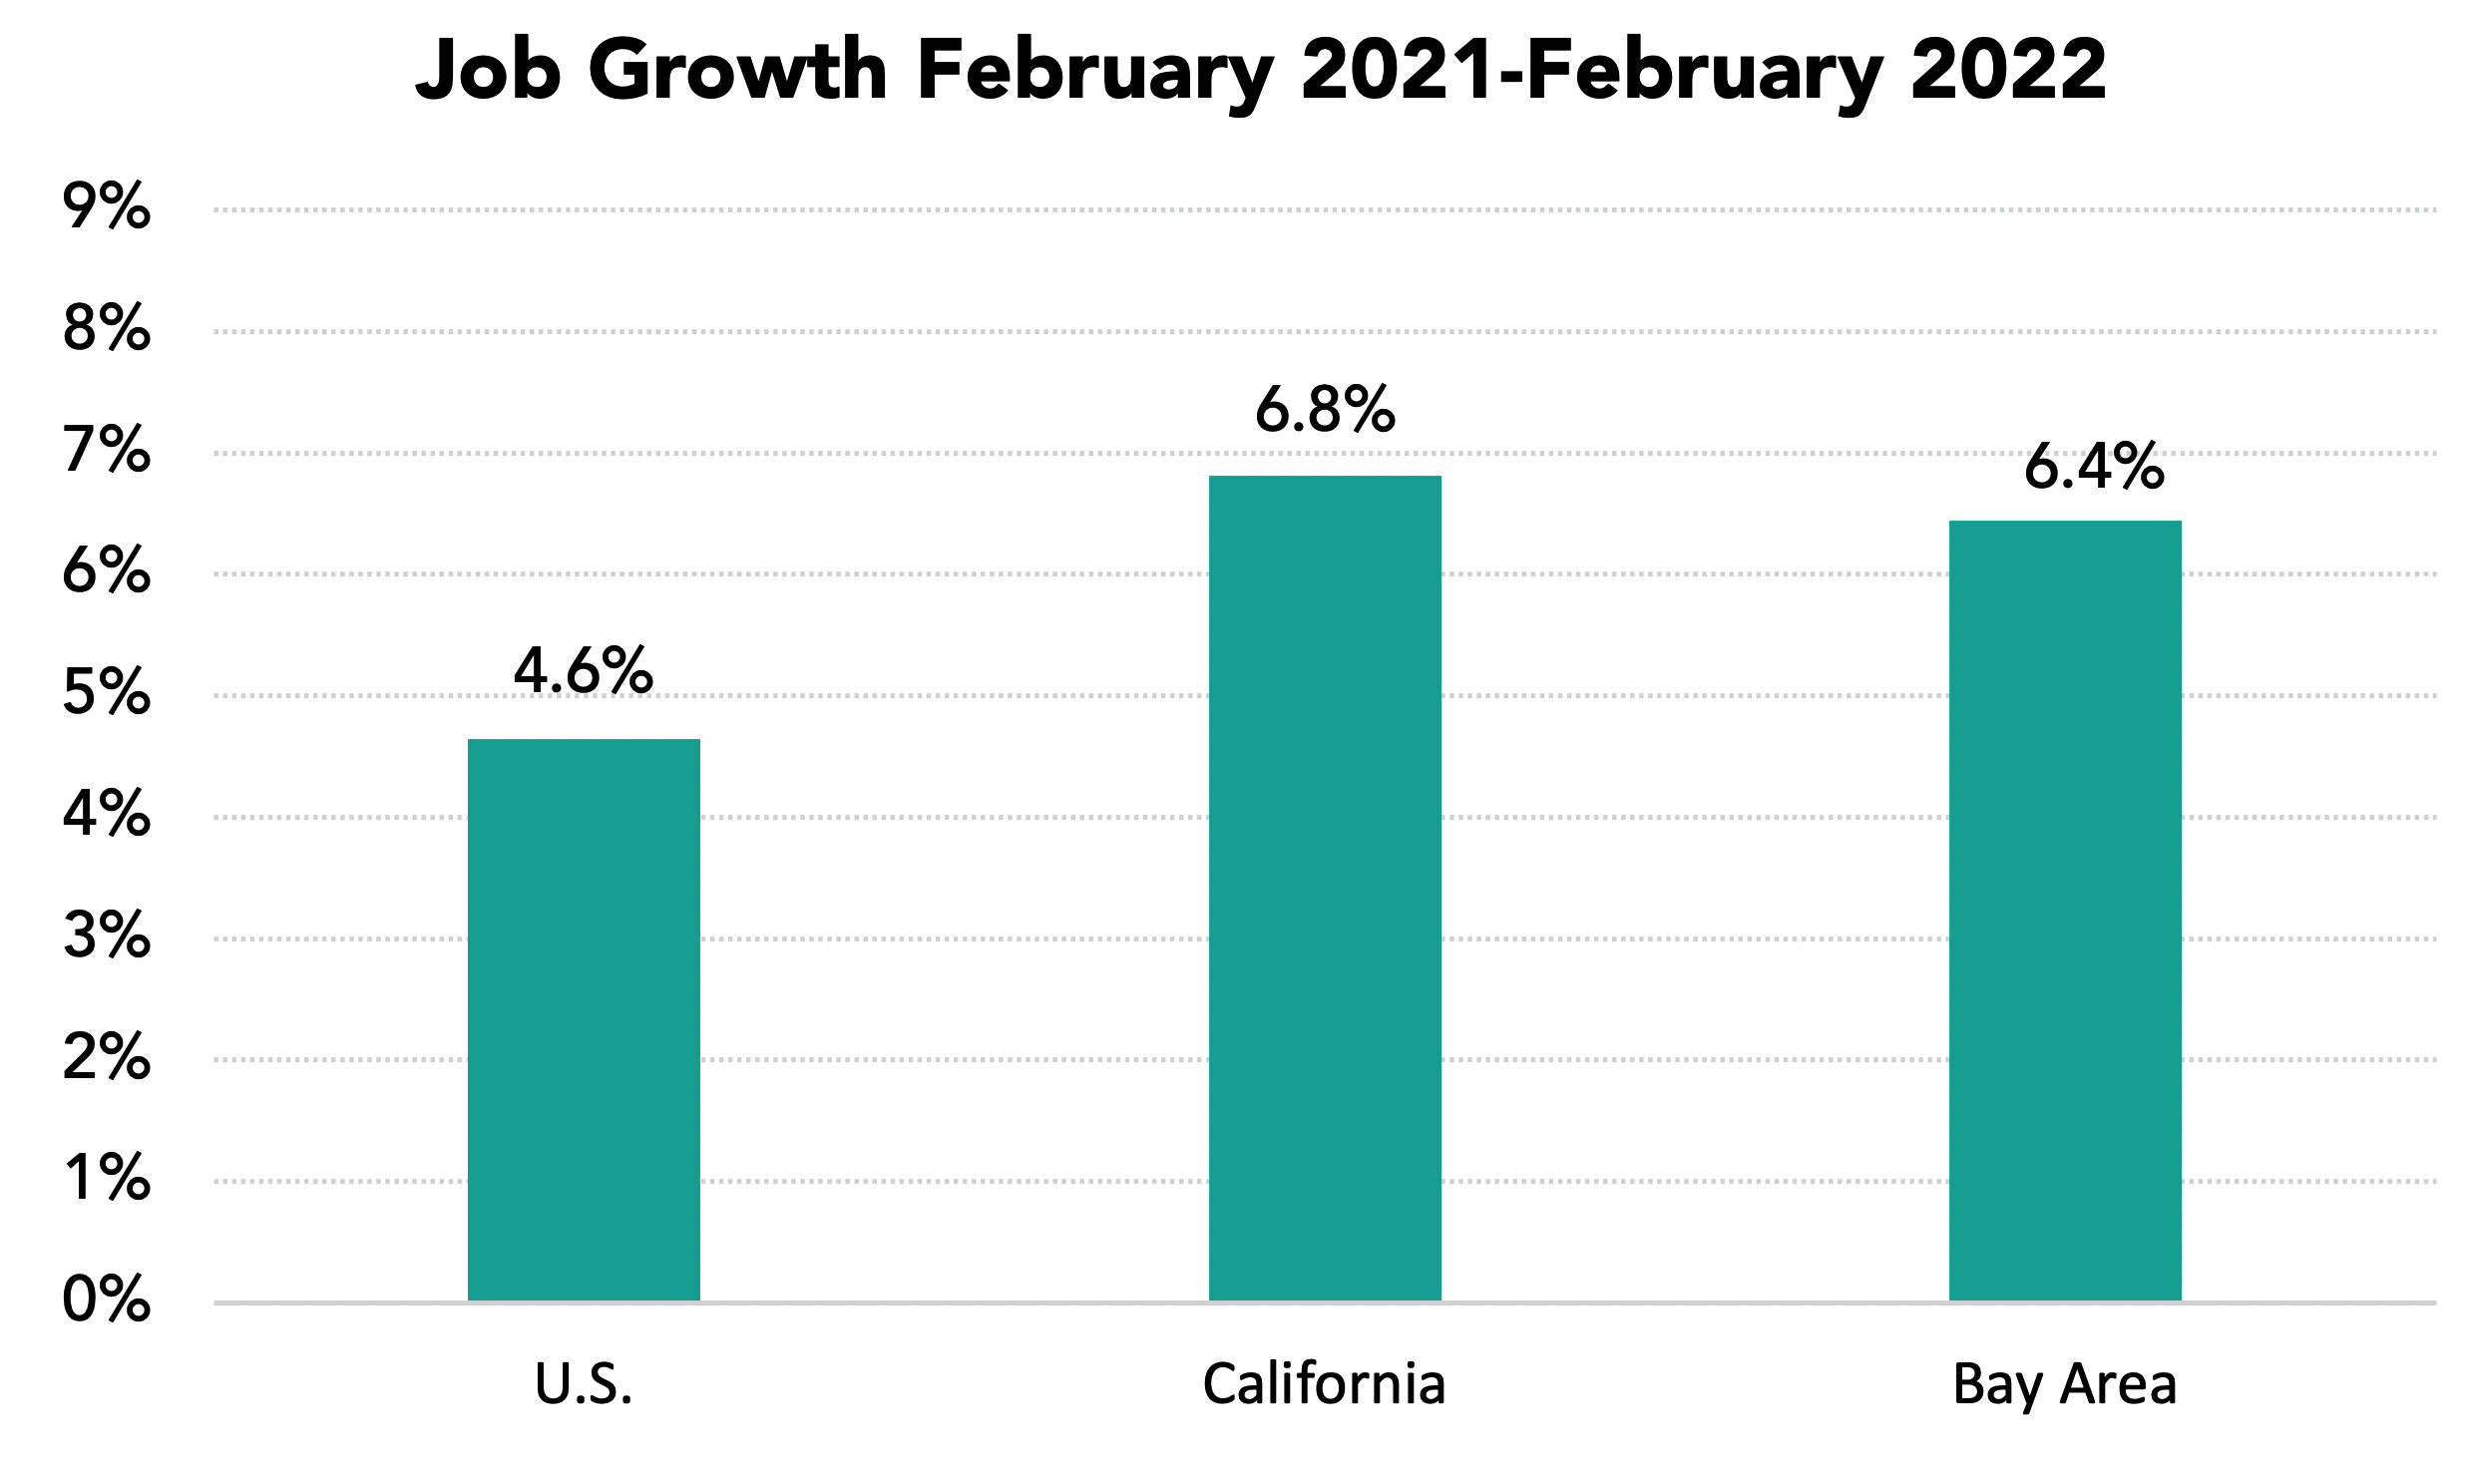
• Bay Area jobs increased by 6.4% between February 2021 and 2022 compared to a 4.6% increase in the nation and 6.8% gain in California.
• The Bay Area unemployment rate in February 2022 was 3.4% compared to 2.7% in the pre-pandemic low.
• Venture capital funding reached a record $105.4 billion in 2021 up from $49.8 billion in 2020.
• March 2022 brings major crosscurrents to the global, national and regional economy with the Russian invasion of Ukraine, rising interest rates amidst continuing high inflation, the easing of COVID cases and related activity restrictions and the ongoing Bay Area challenges of housing, transportation and competitiveness.
• Bay Area jurisdictions have been given large increases in their housing goals for the next eight years as a result of state legislation and policy to reduce overcrowding and increase affordability. Each jurisdiction is in the process of updating their Housing Elements in 2022 to meet state and regional policy goals and requirements.
The Bay Area Outpaced the Nation in Recent Job Growth
Bay Area jobs increased by 6.4% between February 2021 and February 2022 outpacing the national 4.6% growth rate. The region still lags the nation and state in the percentage of jobs recovered since April 2020 as a result of the large job losses in 2020.
By February 2022 the region had recovered 75.8% of the jobs lost between February and April 2020. This is a lower recovery rate than the state and nation, though the region has closed the gap in recent months.
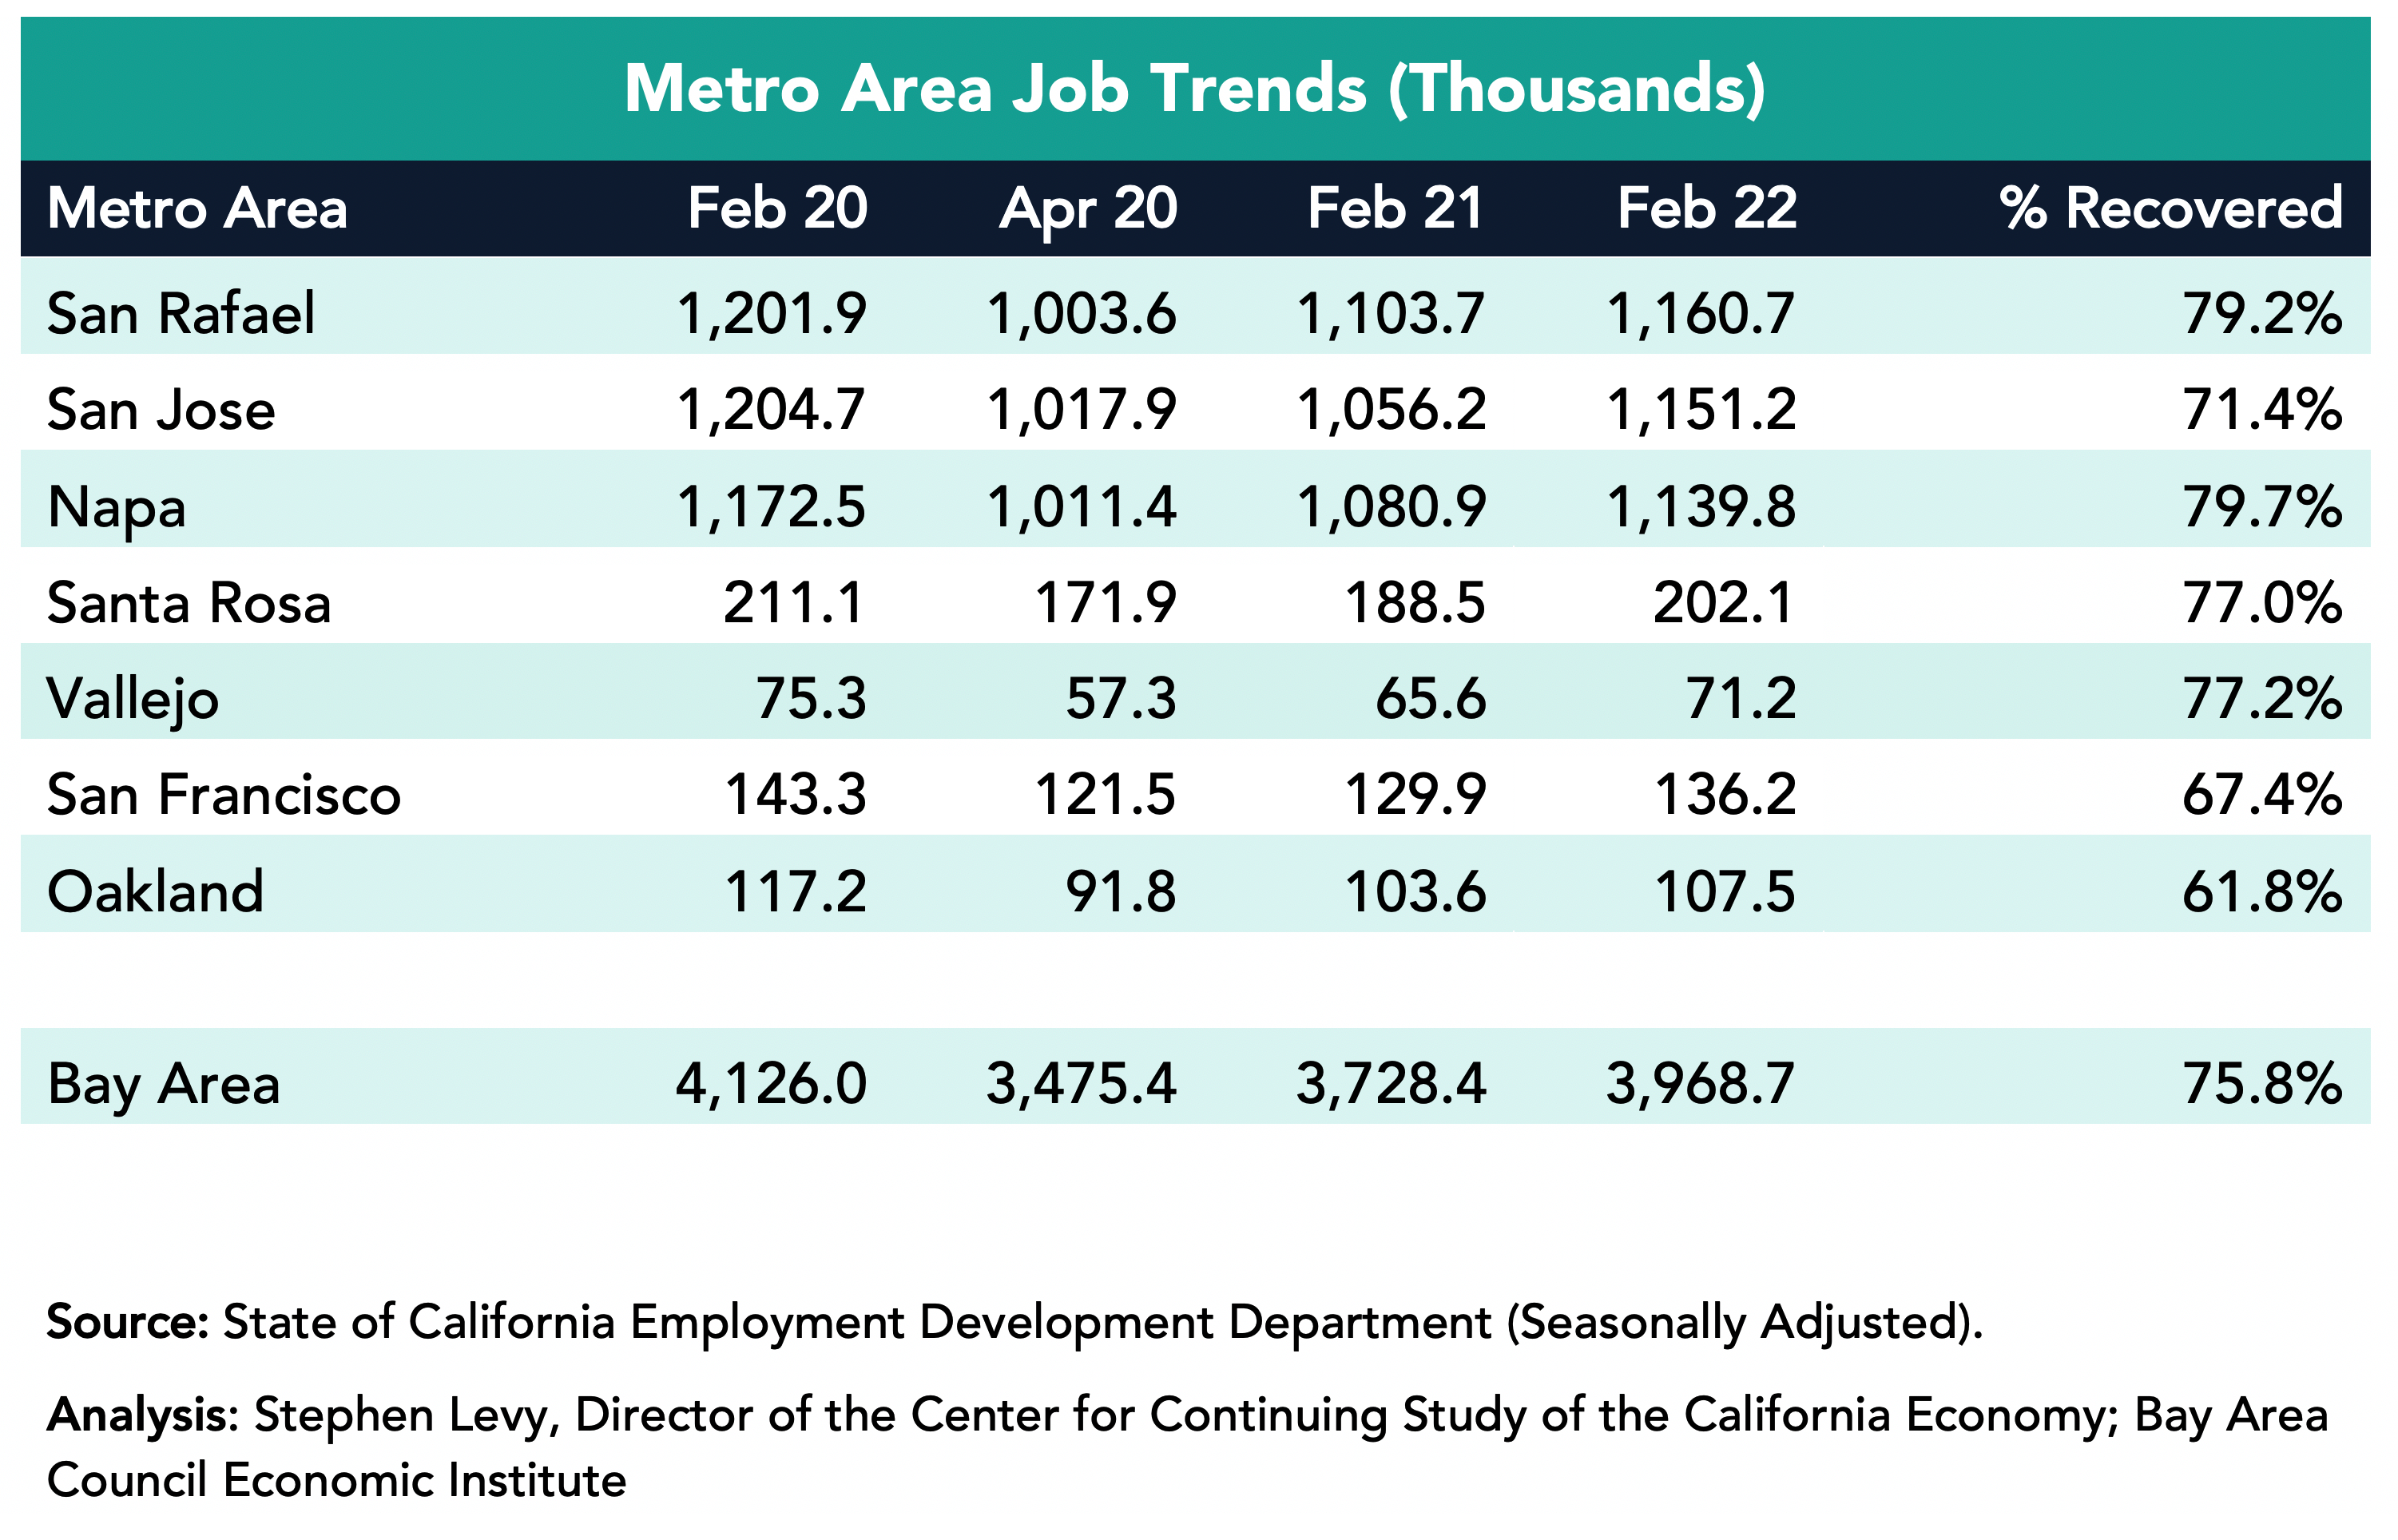
The Bay Area added 240,300 jobs in the past year led by a gain of 95,000 in the San Francisco metro area though SF has recovered just 71.4% of the jobs lost between February and April 2020. The San Jose metro area added 58,900 jobs and by February 2022 had recovered 79.7% of the jobs lost between February and April 2020. The Oakland metro area added 57,000 jobs.
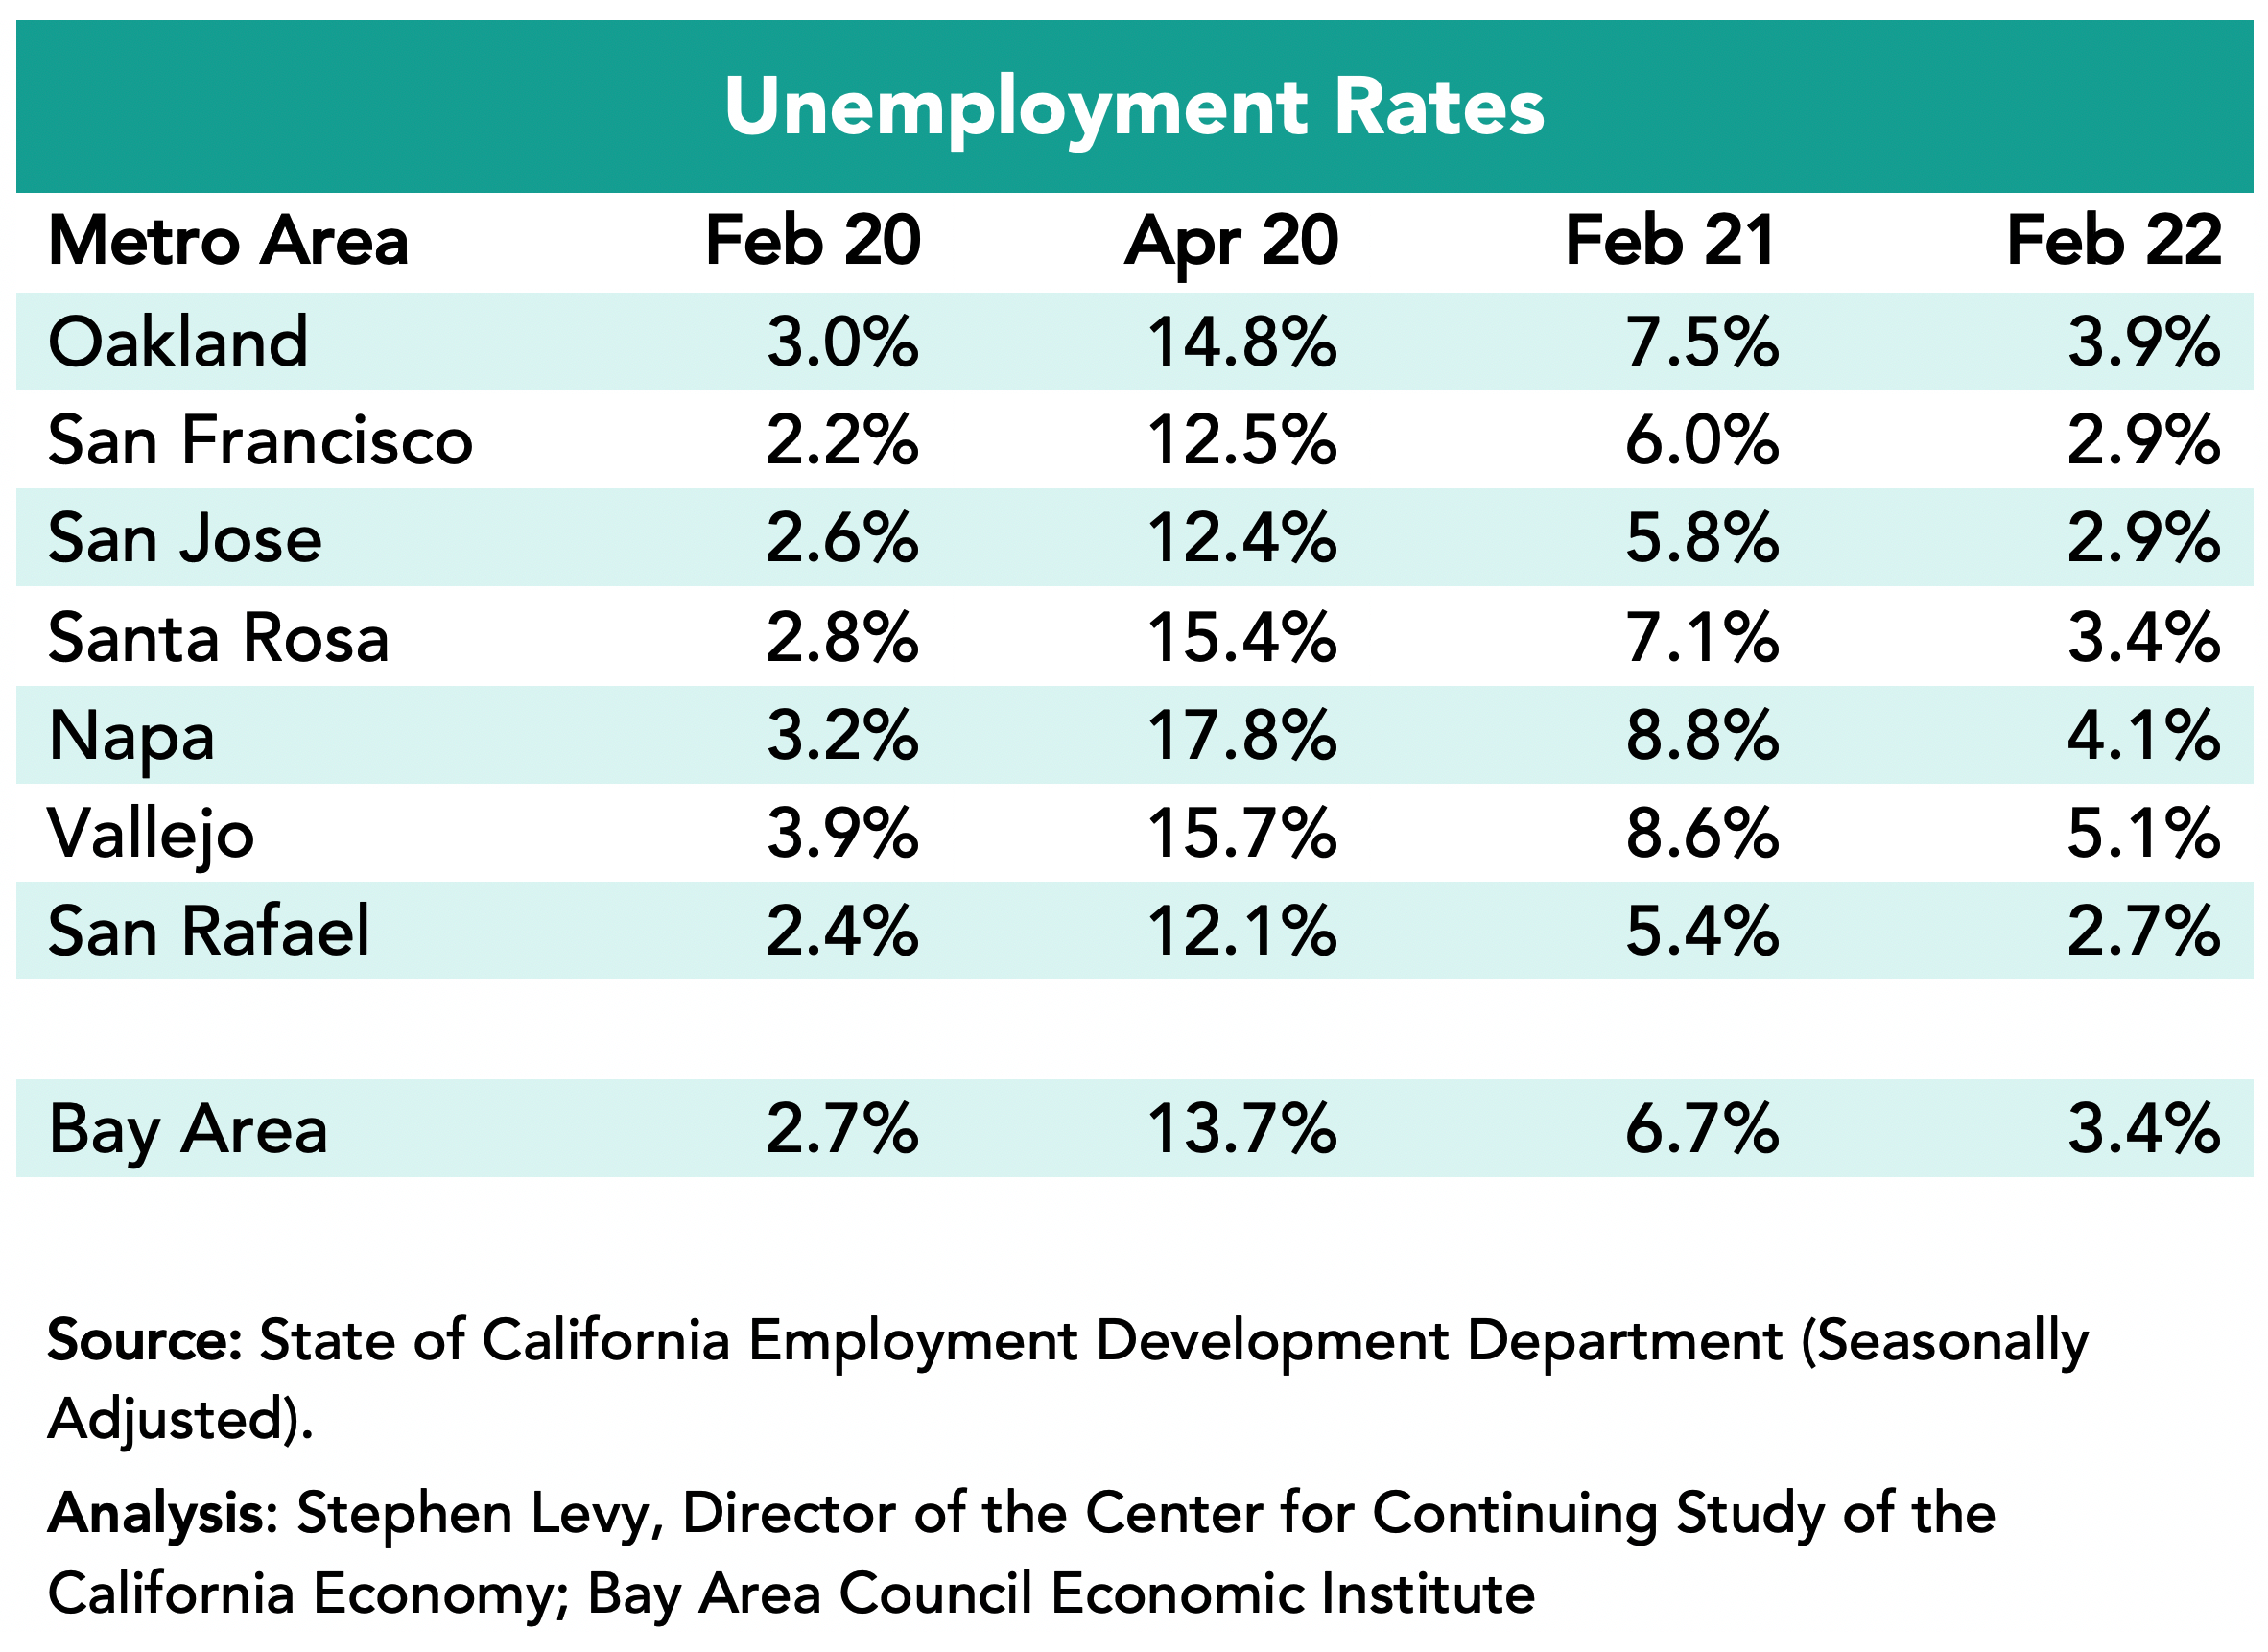
Unemployment Rates Fell to 3.4% in the Region in February 2022 from 6.7% in February 2021.
The lowest rates were in the San Rafael metro area (2.7%) followed by the San Francisco and San Jose metro areas (2.9%) in February 2022.
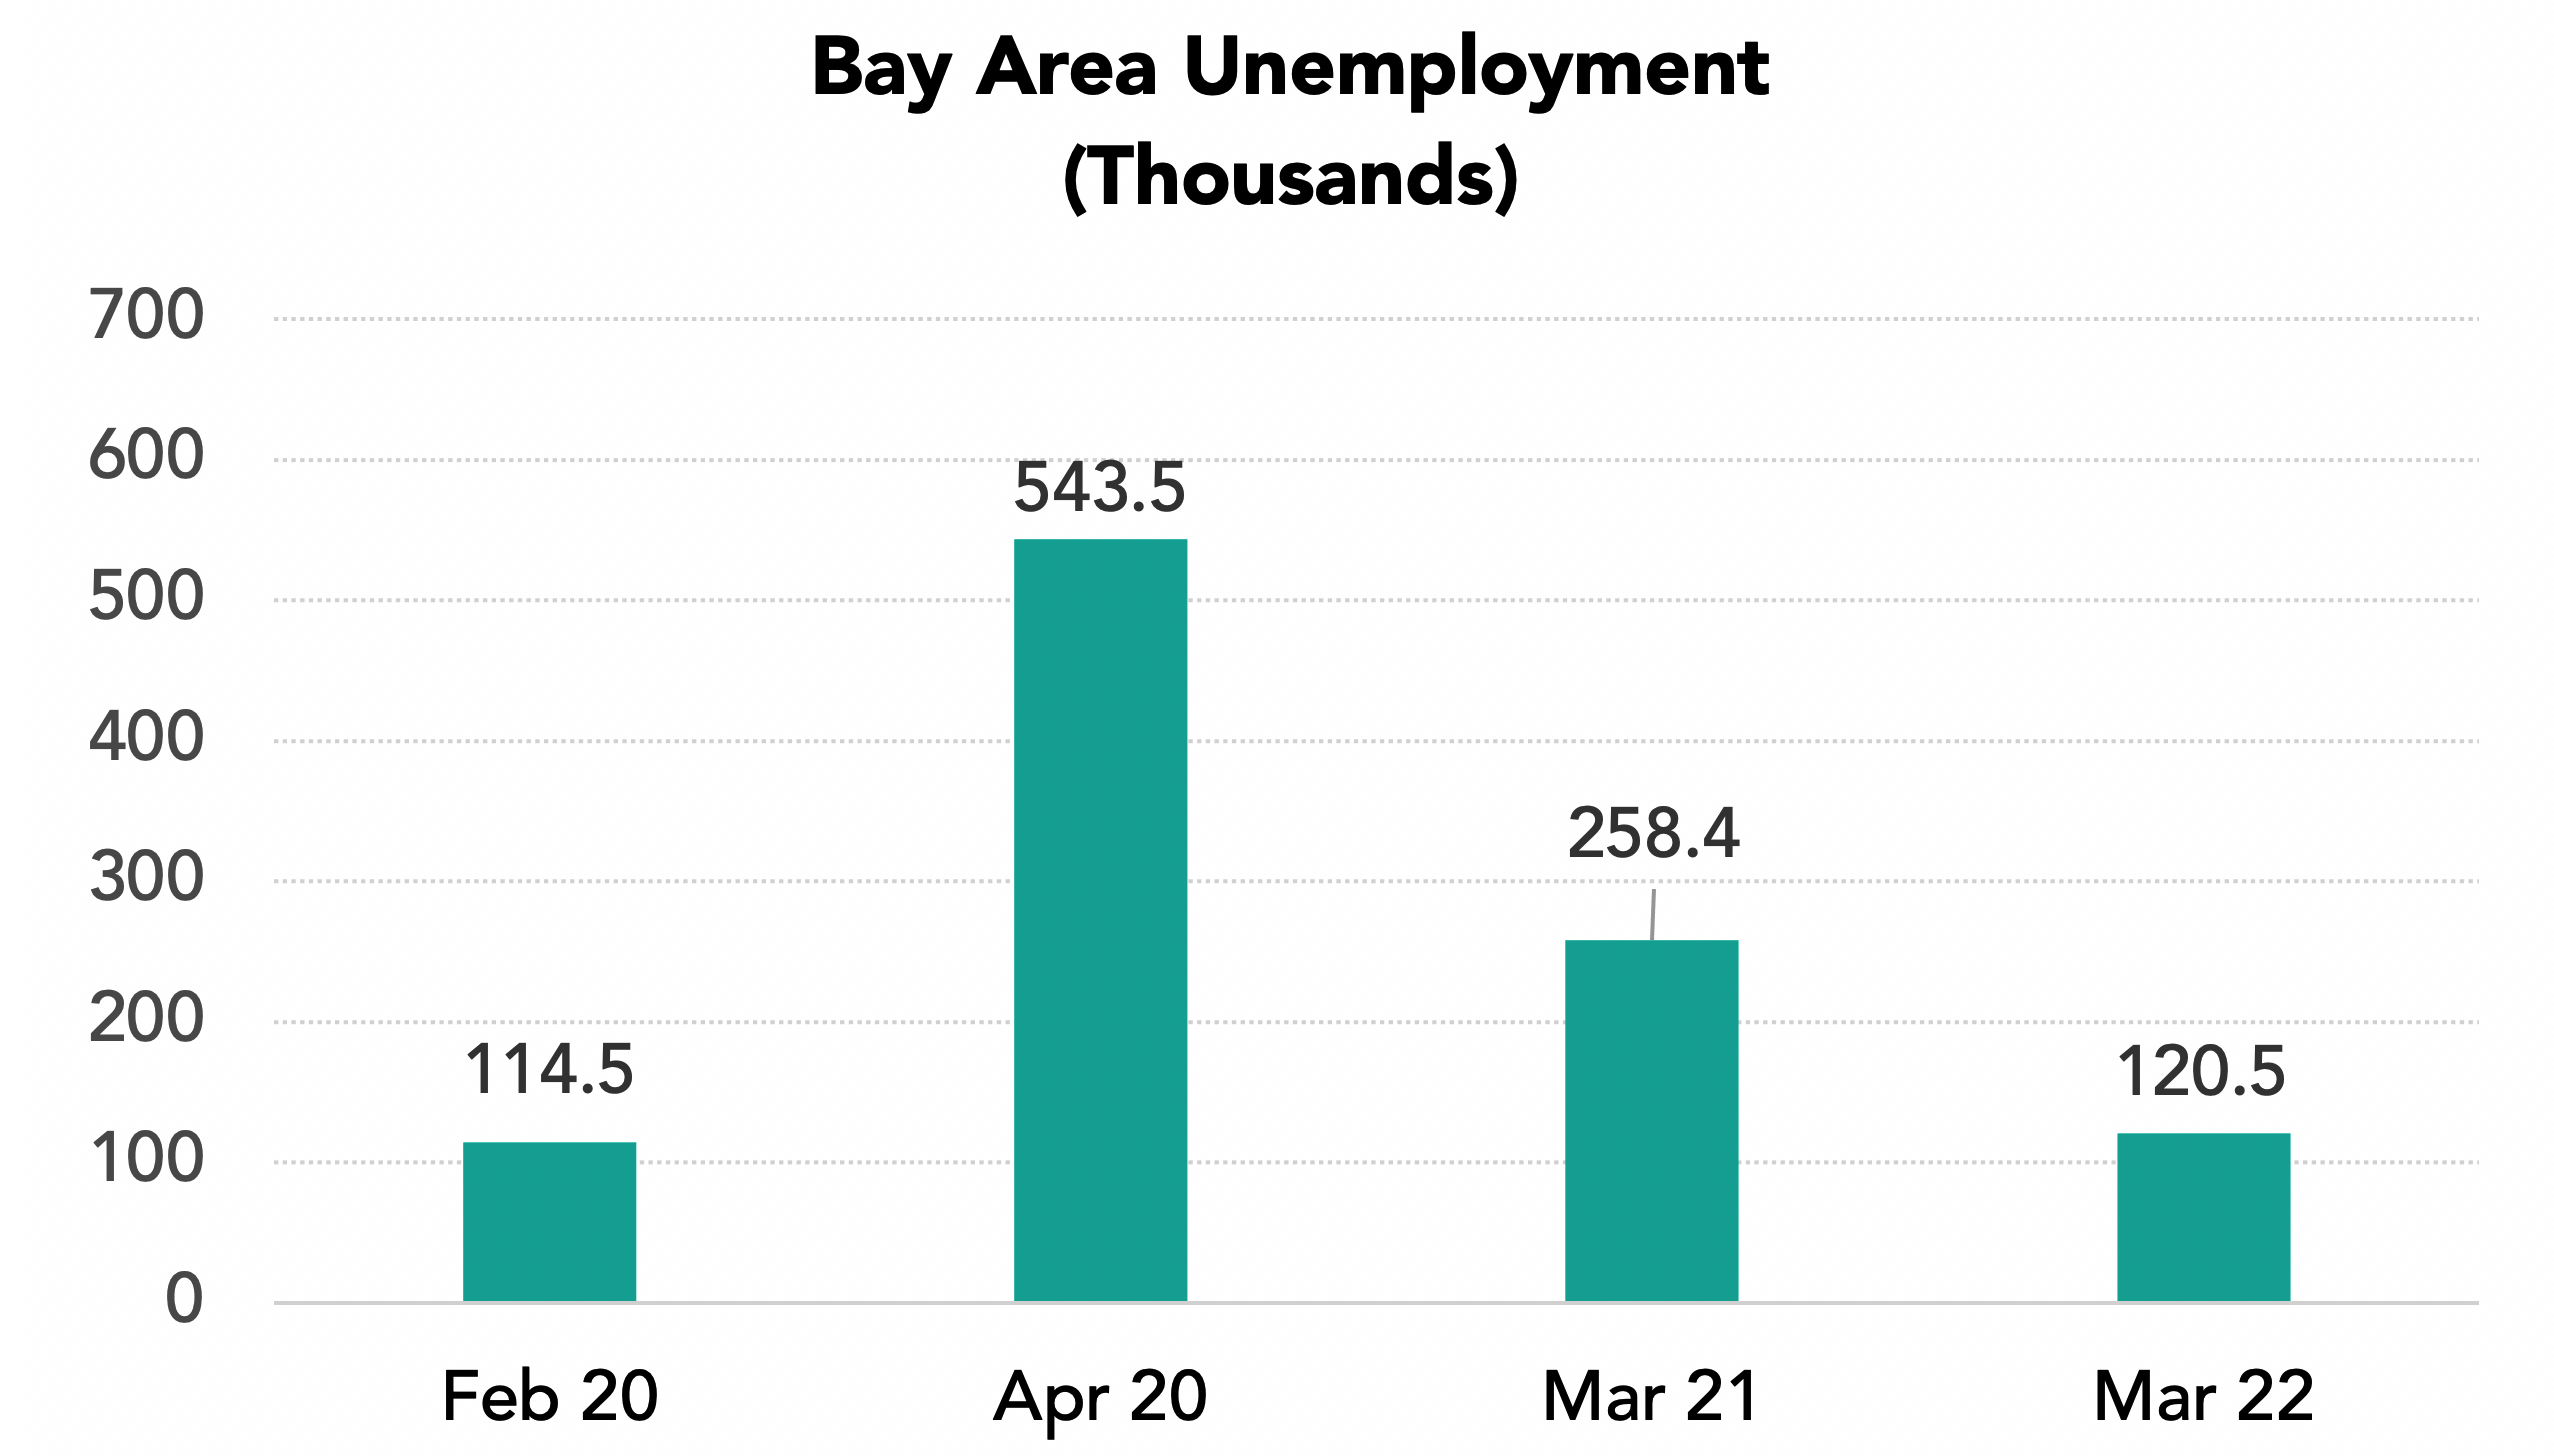
The number of unemployed residents has fallen sharply from the April 2020 high and from February 2021 to 138,800 in February 2022.
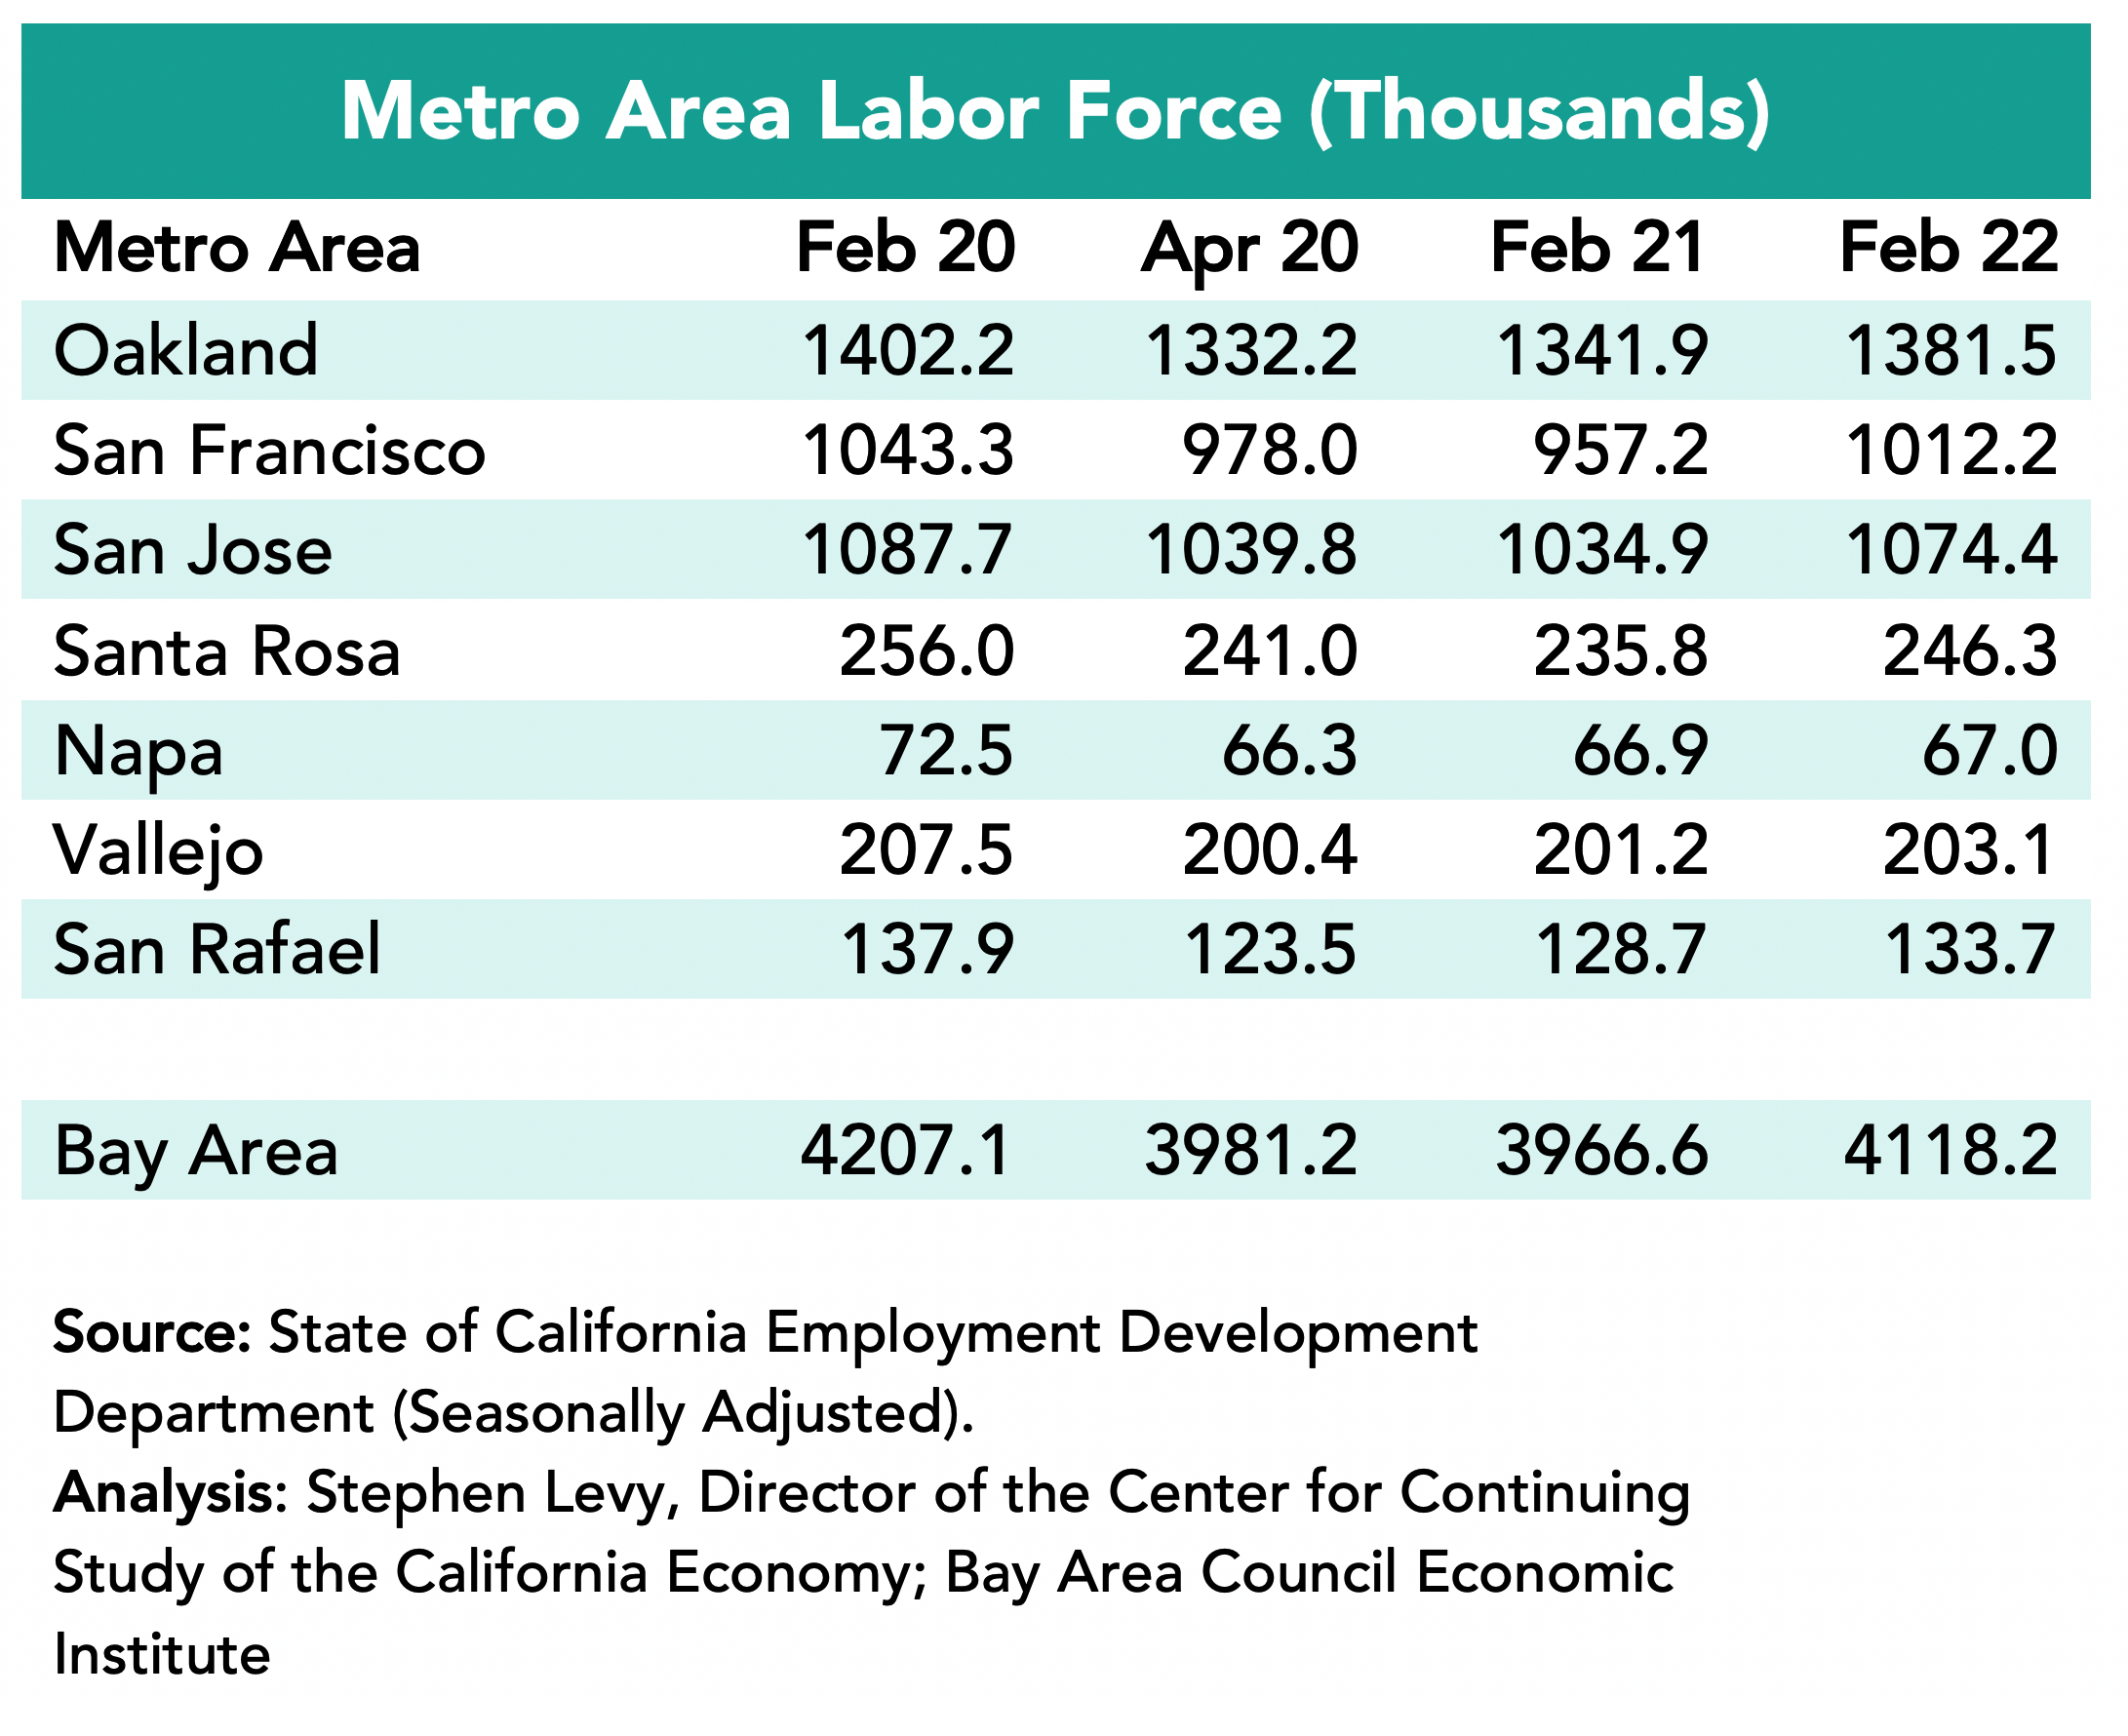
But 90,000 Workers Have Not Rejoined the Workforce Since February 2020
Residents who are not in the labor force are not counted as unemployed. As a result, the number of unemployed residents can decline while some are still prevented by choice or lack of child care or work in industries that have not fully recovered.
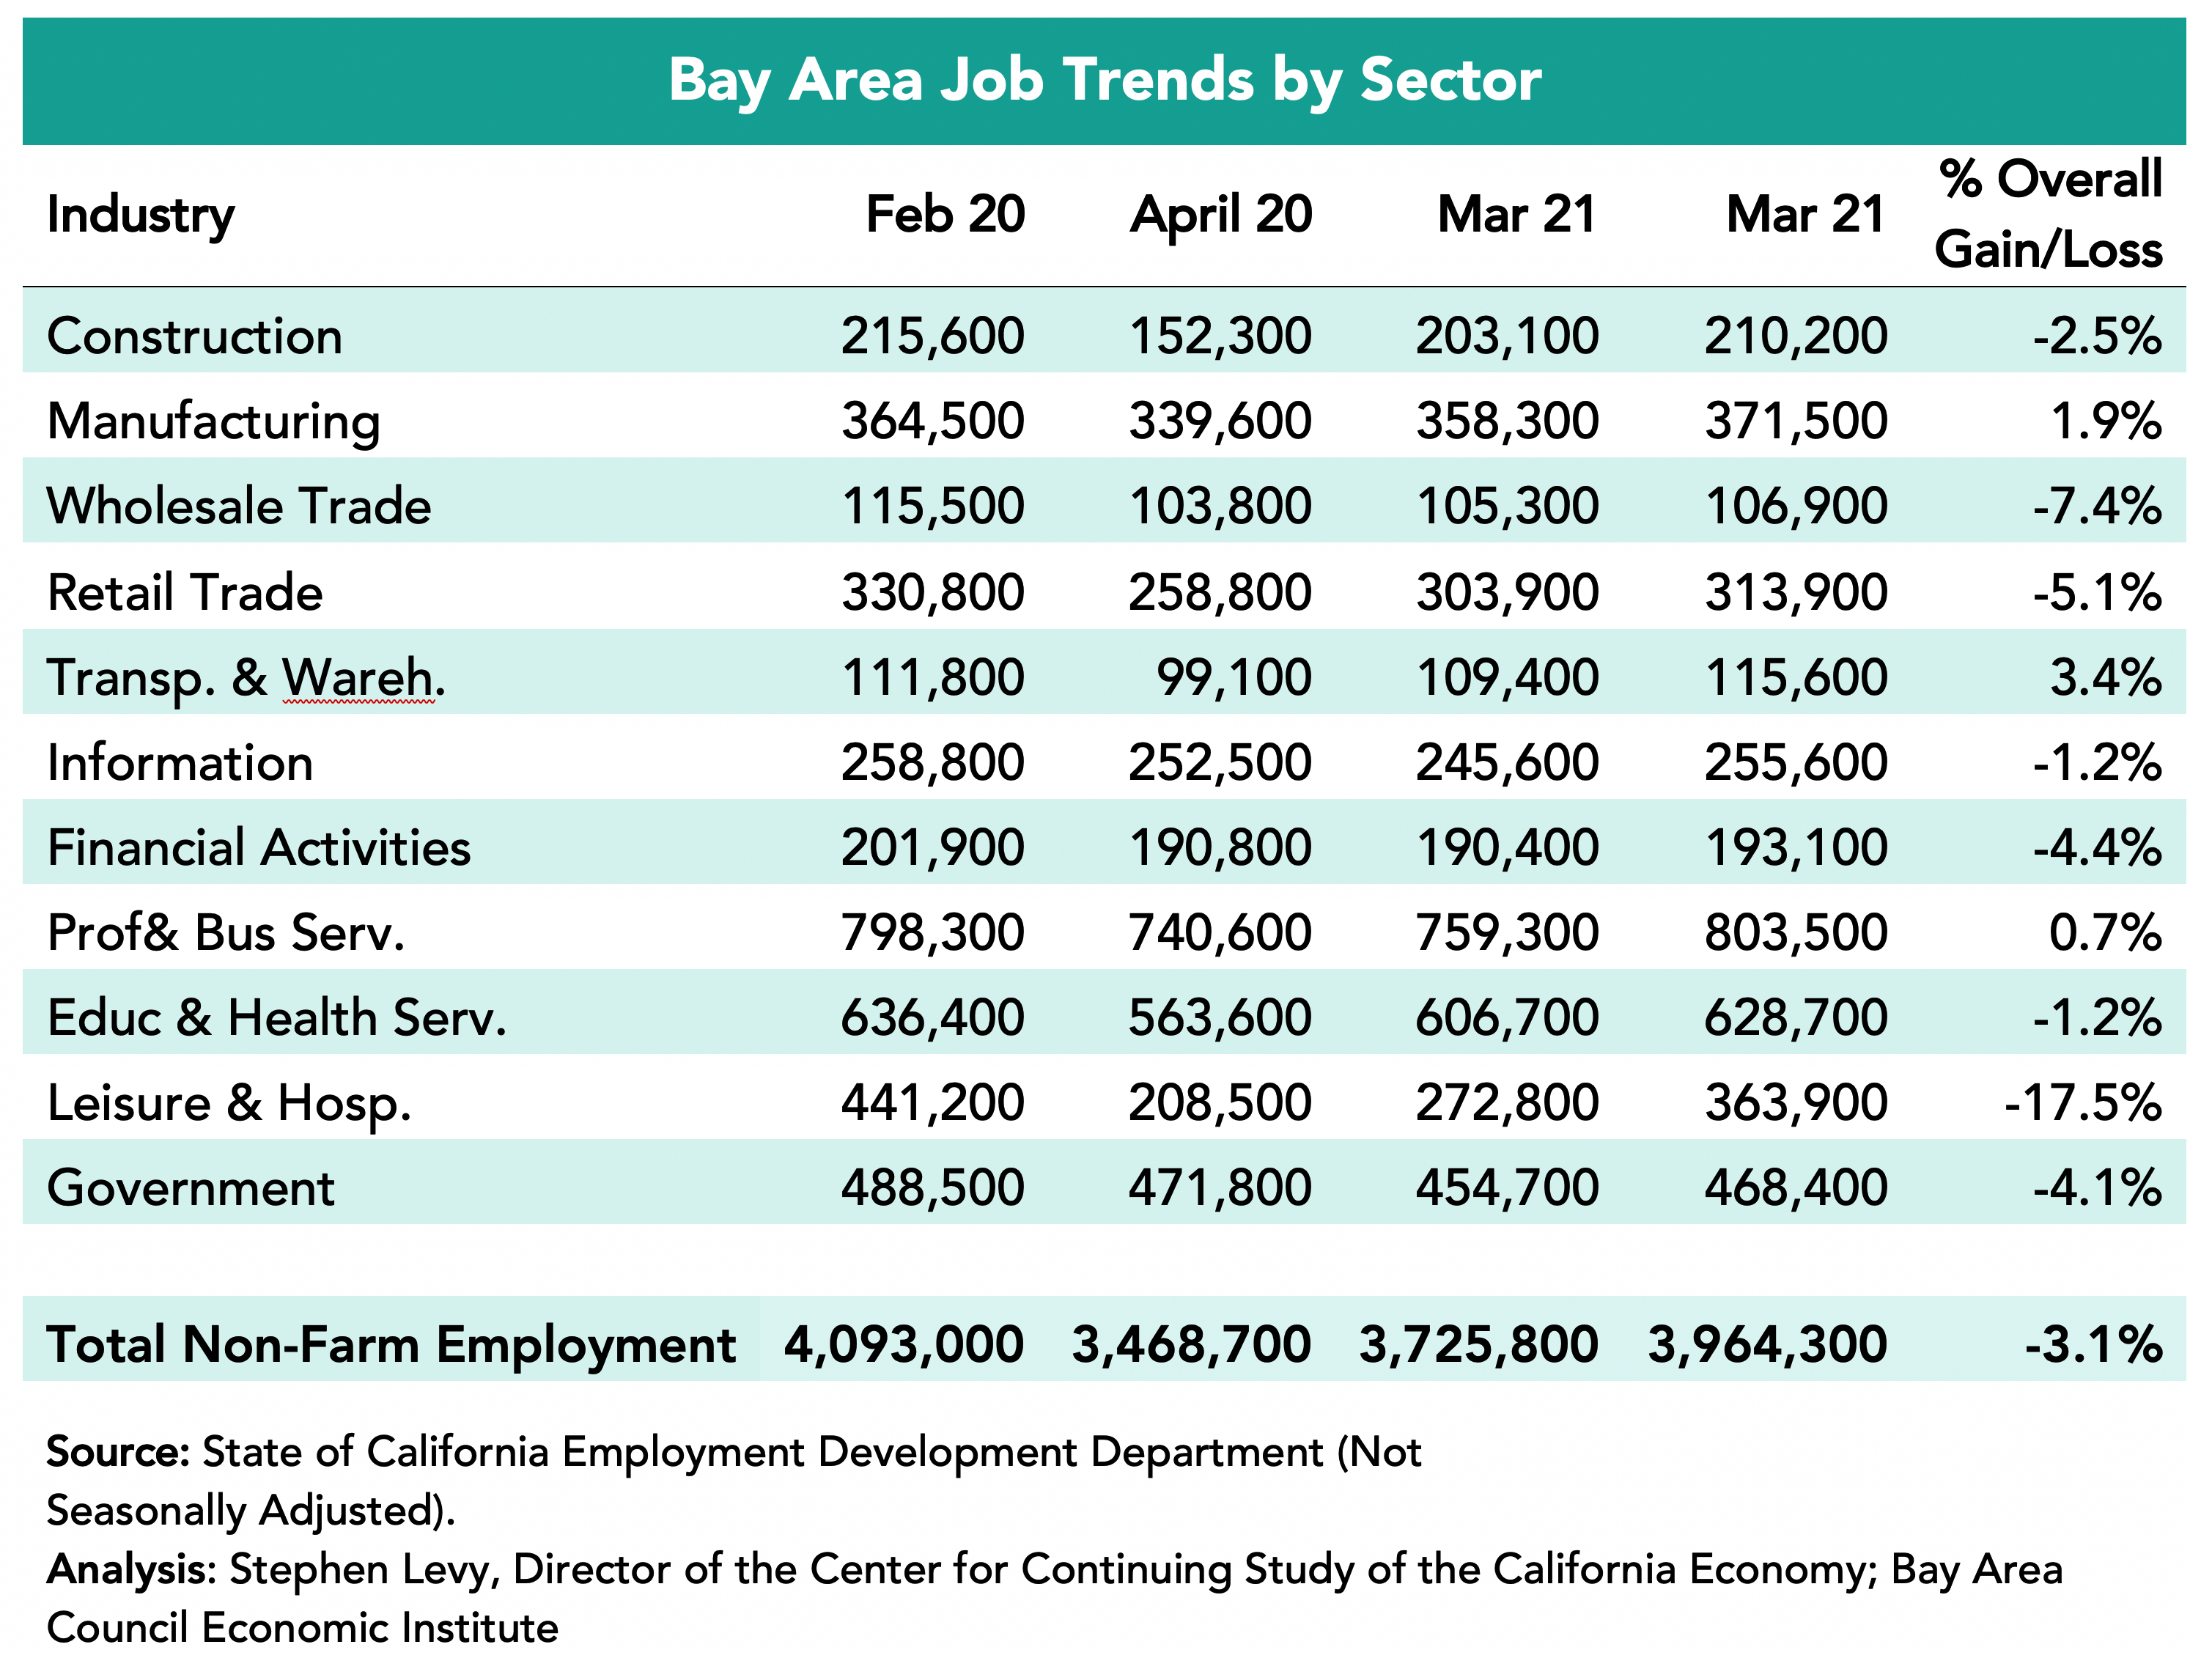
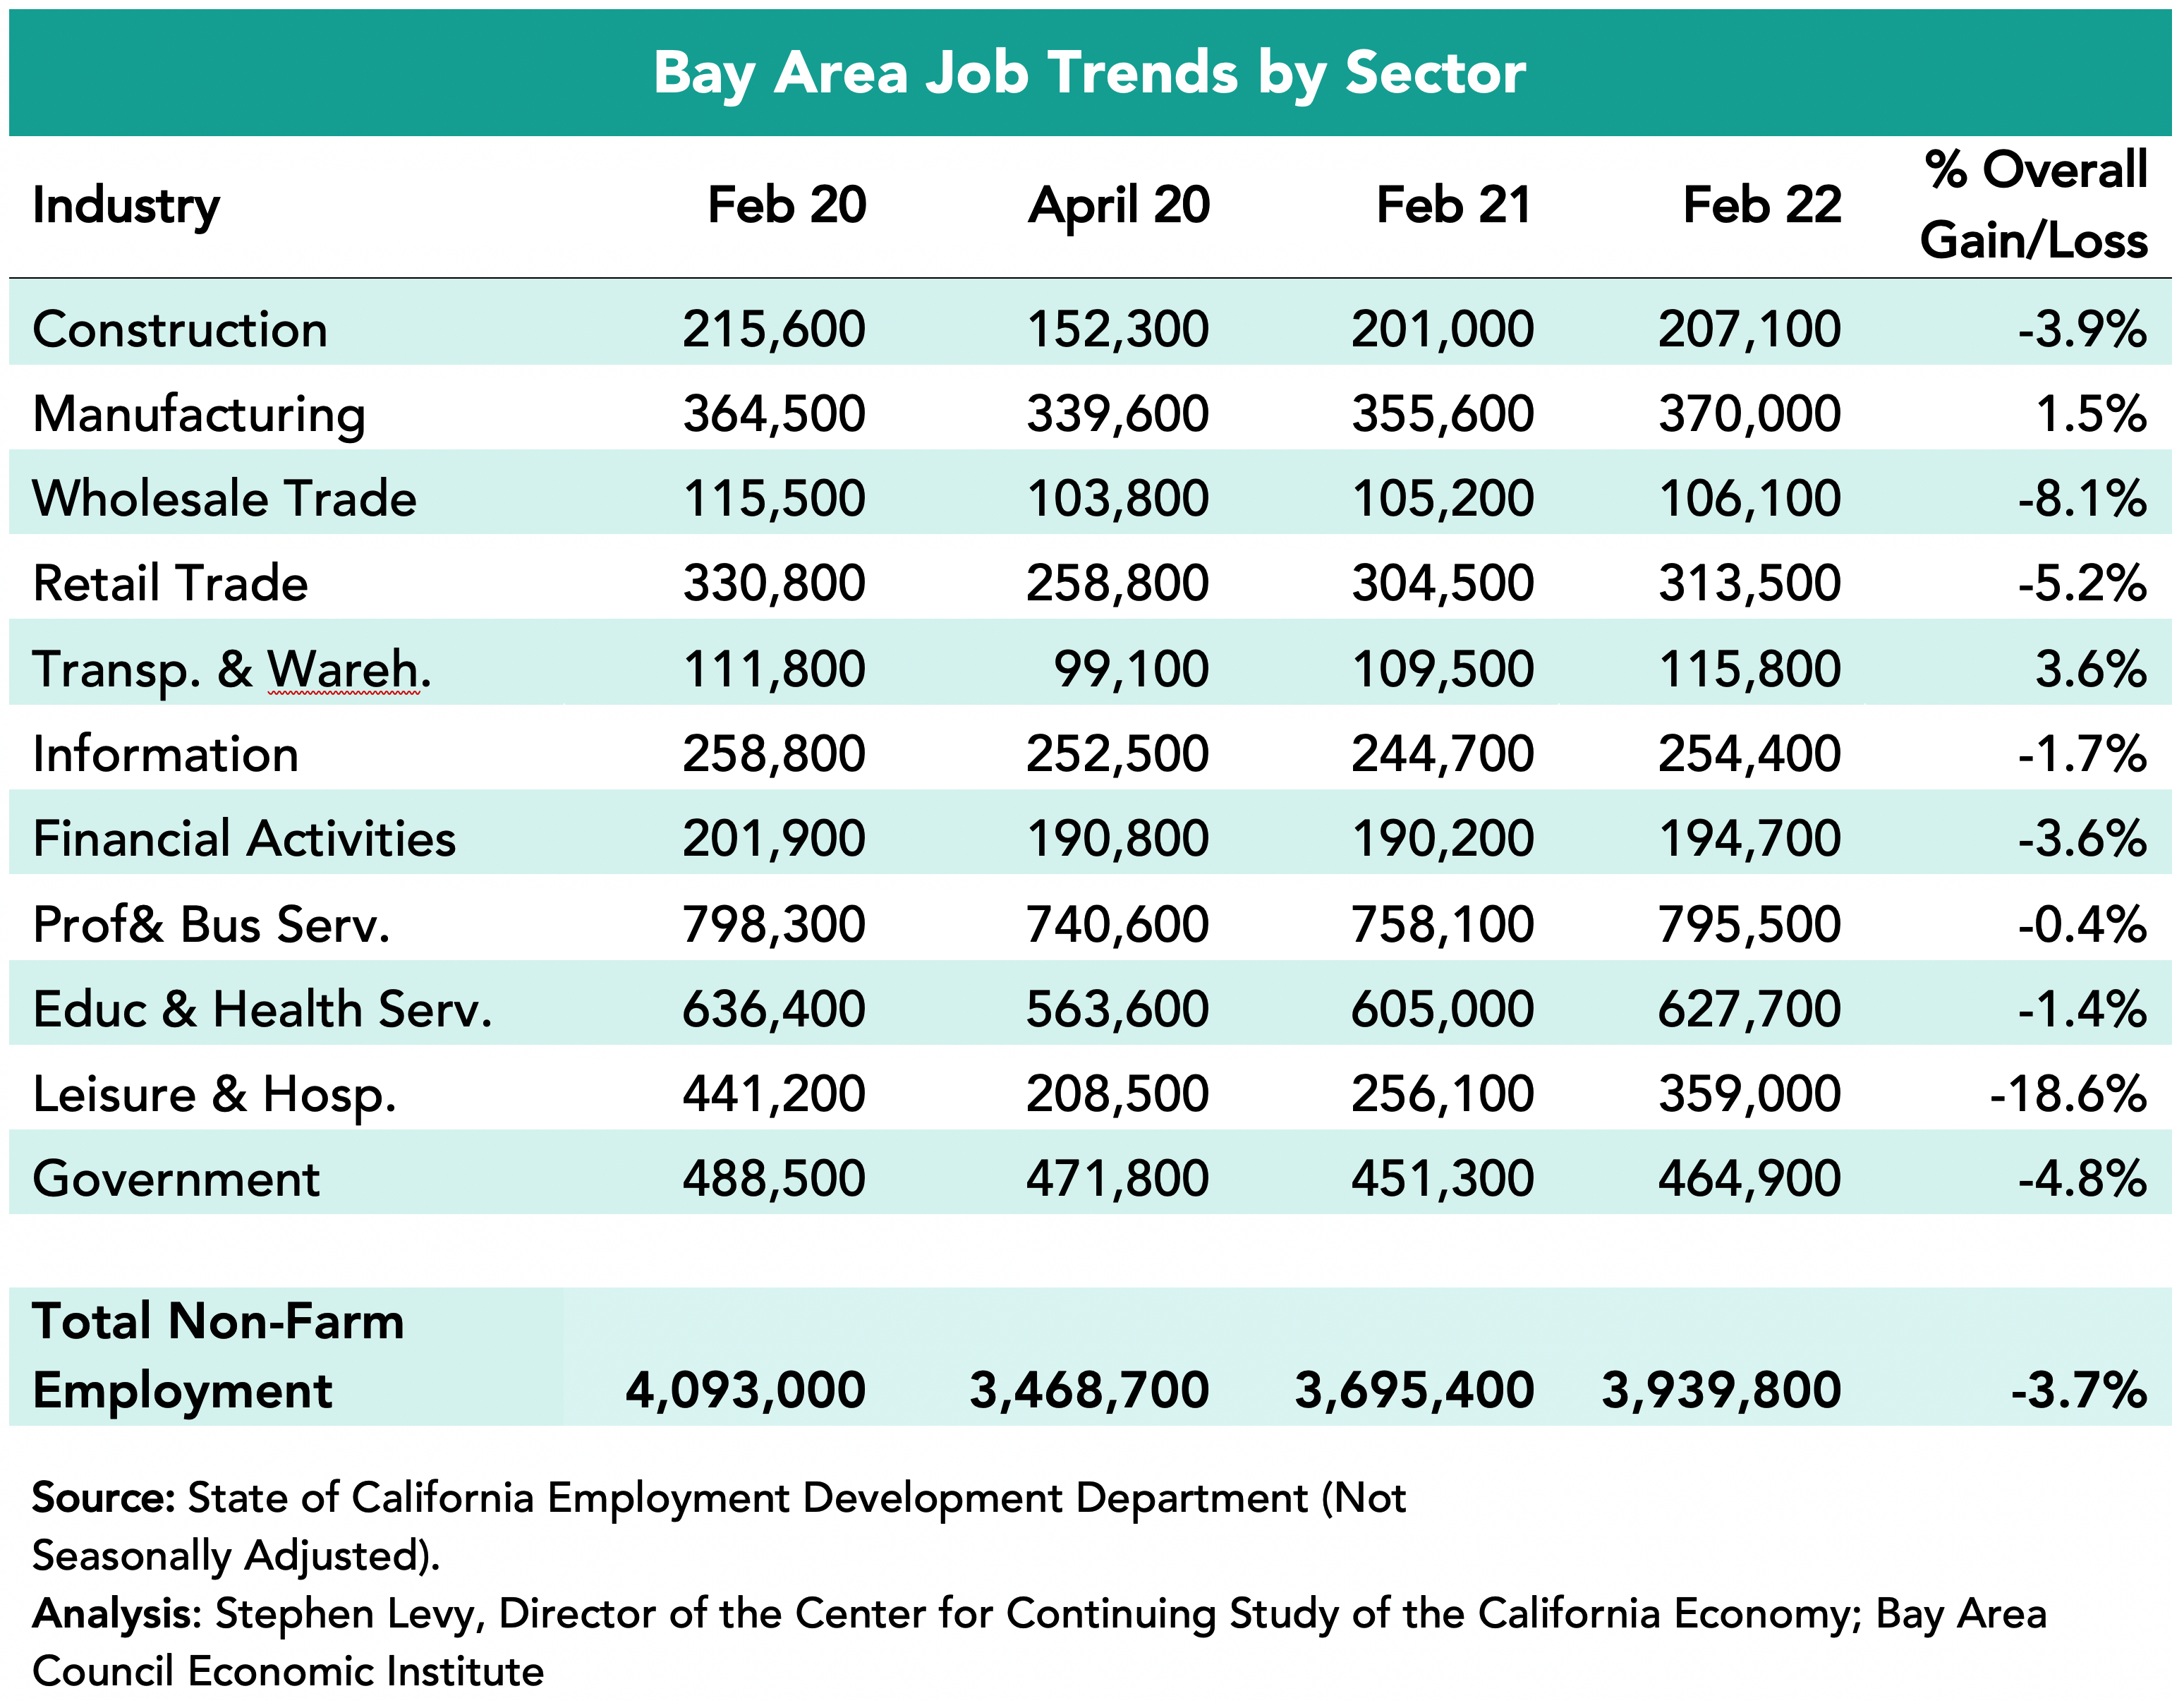
Industries Were Affected Differently
Three sectors—Manufacturing, Transportation and Warehousing, and Information—exceeded pre-pandemic job levels in February 2022 and Professional and Business Services was close to full recovery. On the other hand, the Leisure and Hospitality sector recovered only 64.7% of lost jobs by February 2022 though travel and tourism are now picking up again. The Government sector still has fewer jobs now than in April 2020. The Construction and Education and Health Services sectors have also recovered most of the jobs between February and April 2020.
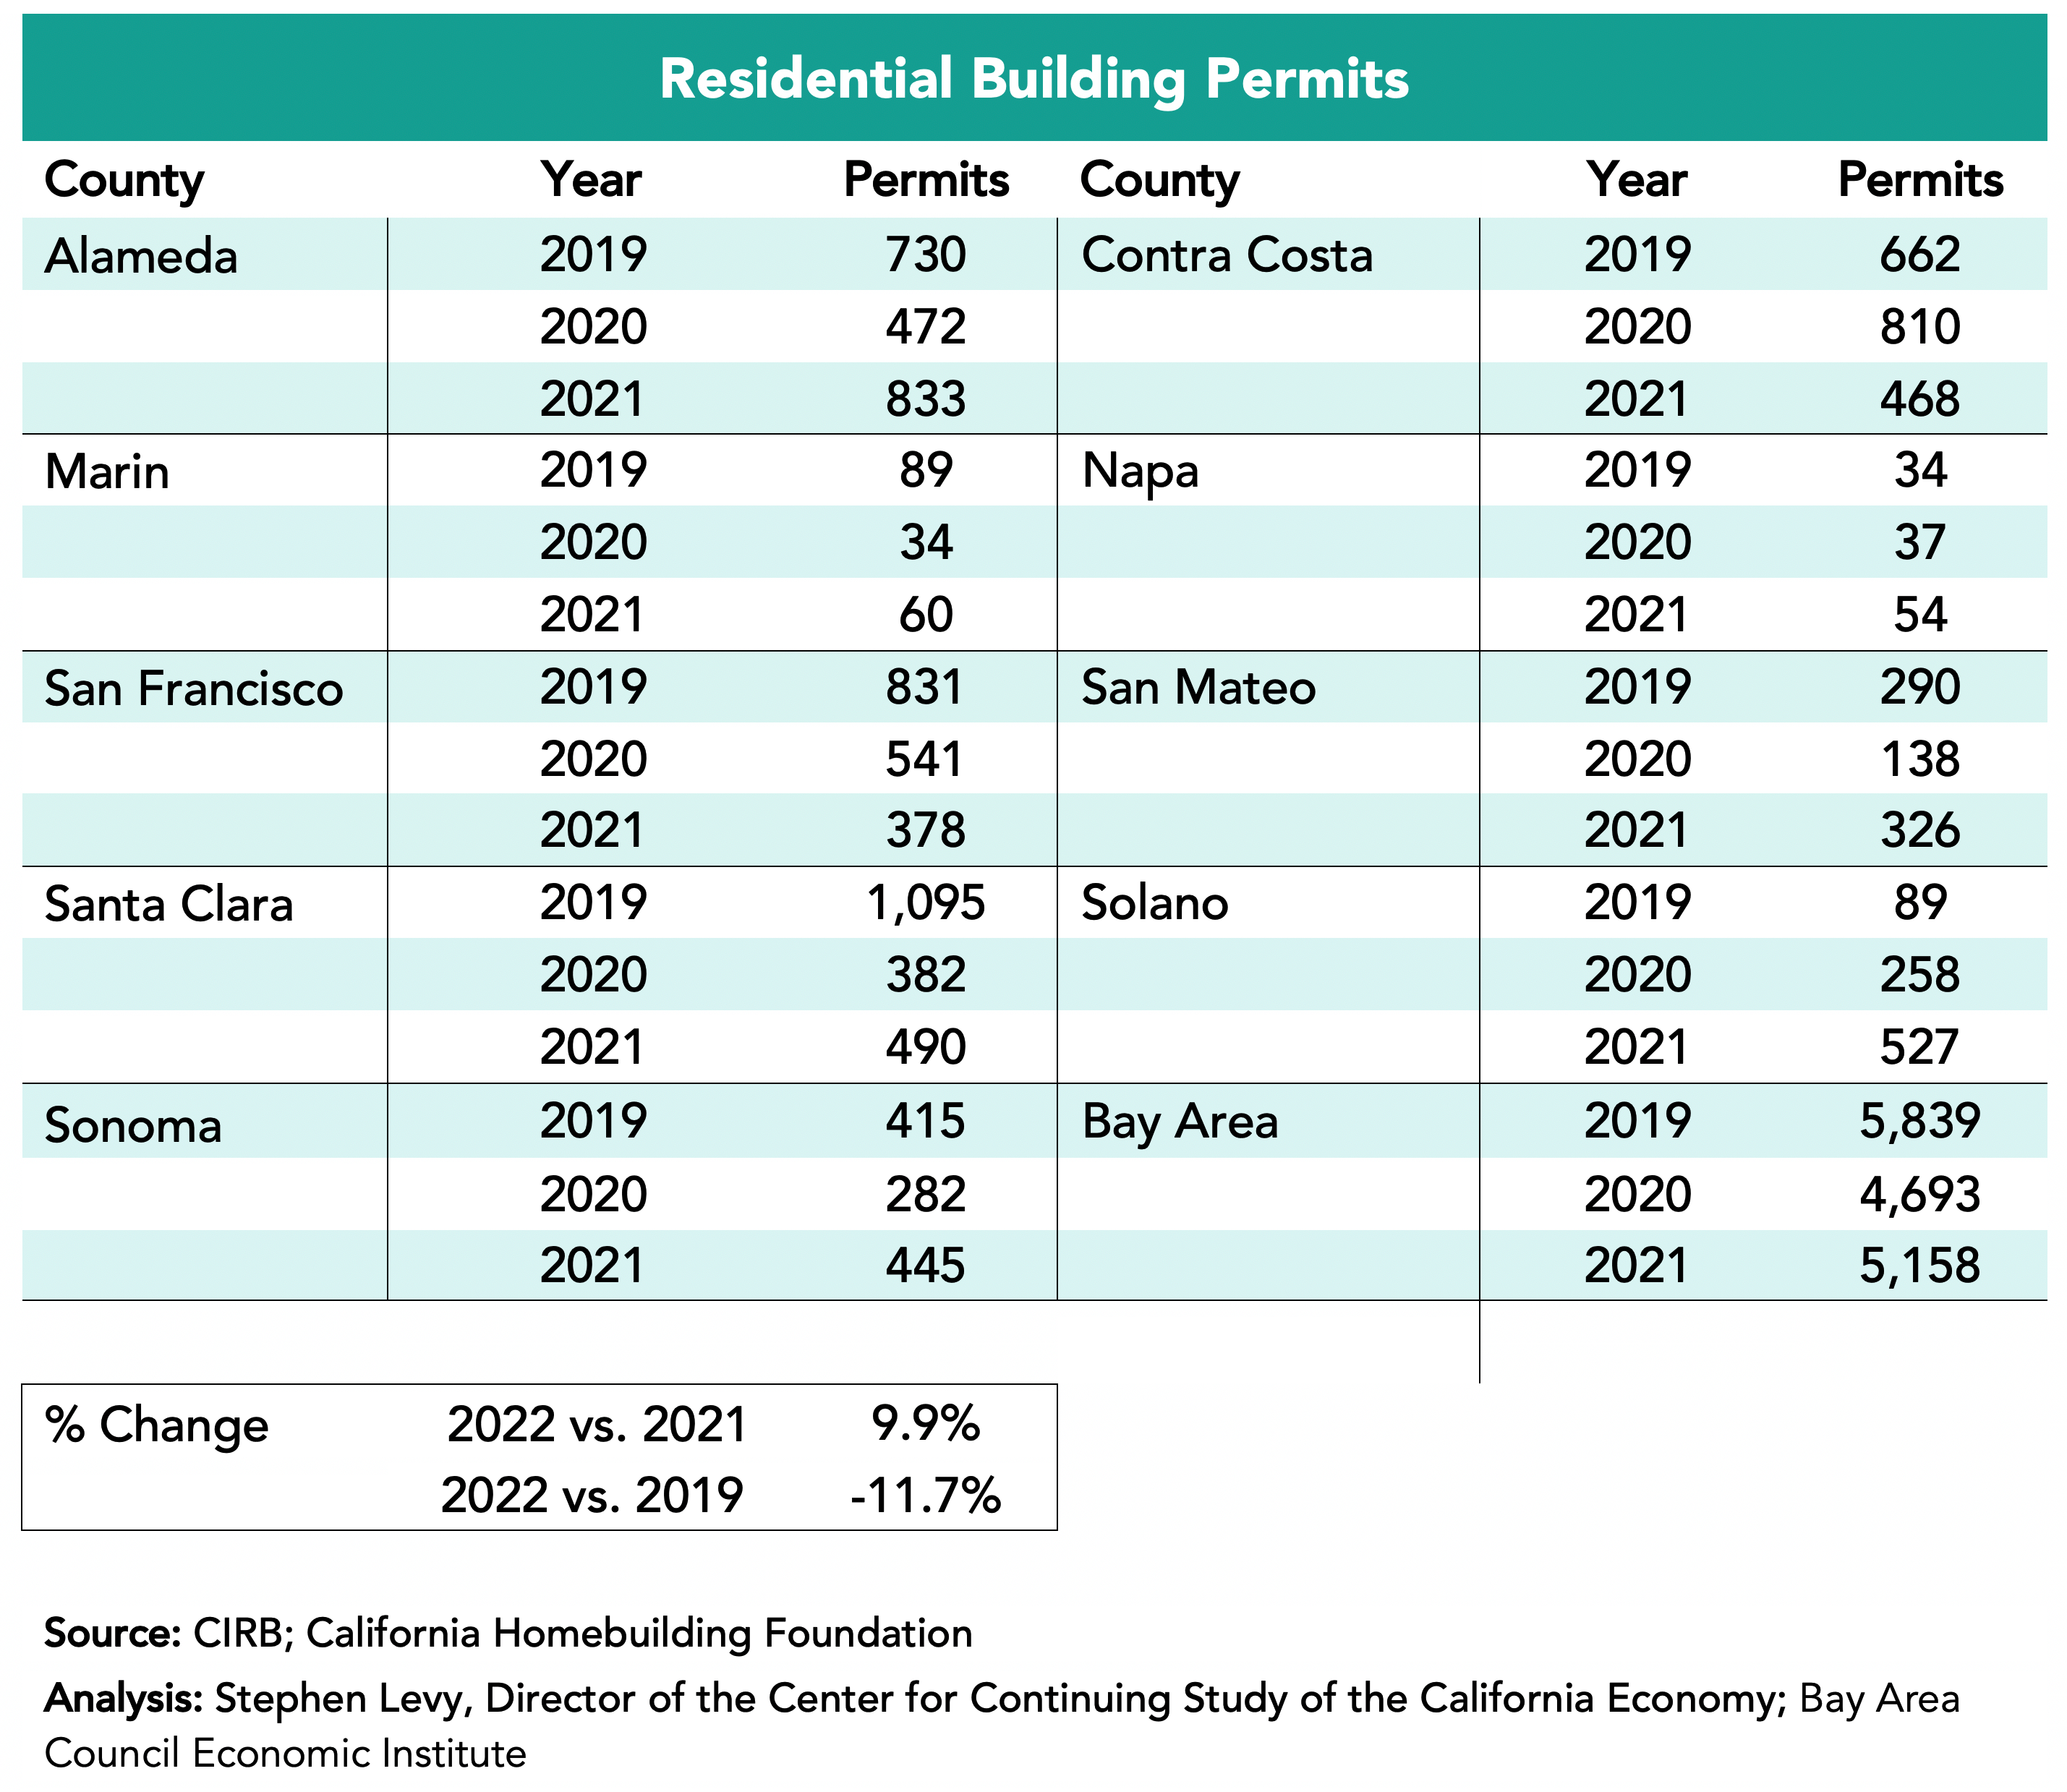
Housing Permits Rebound to 2019 Levels in 2021
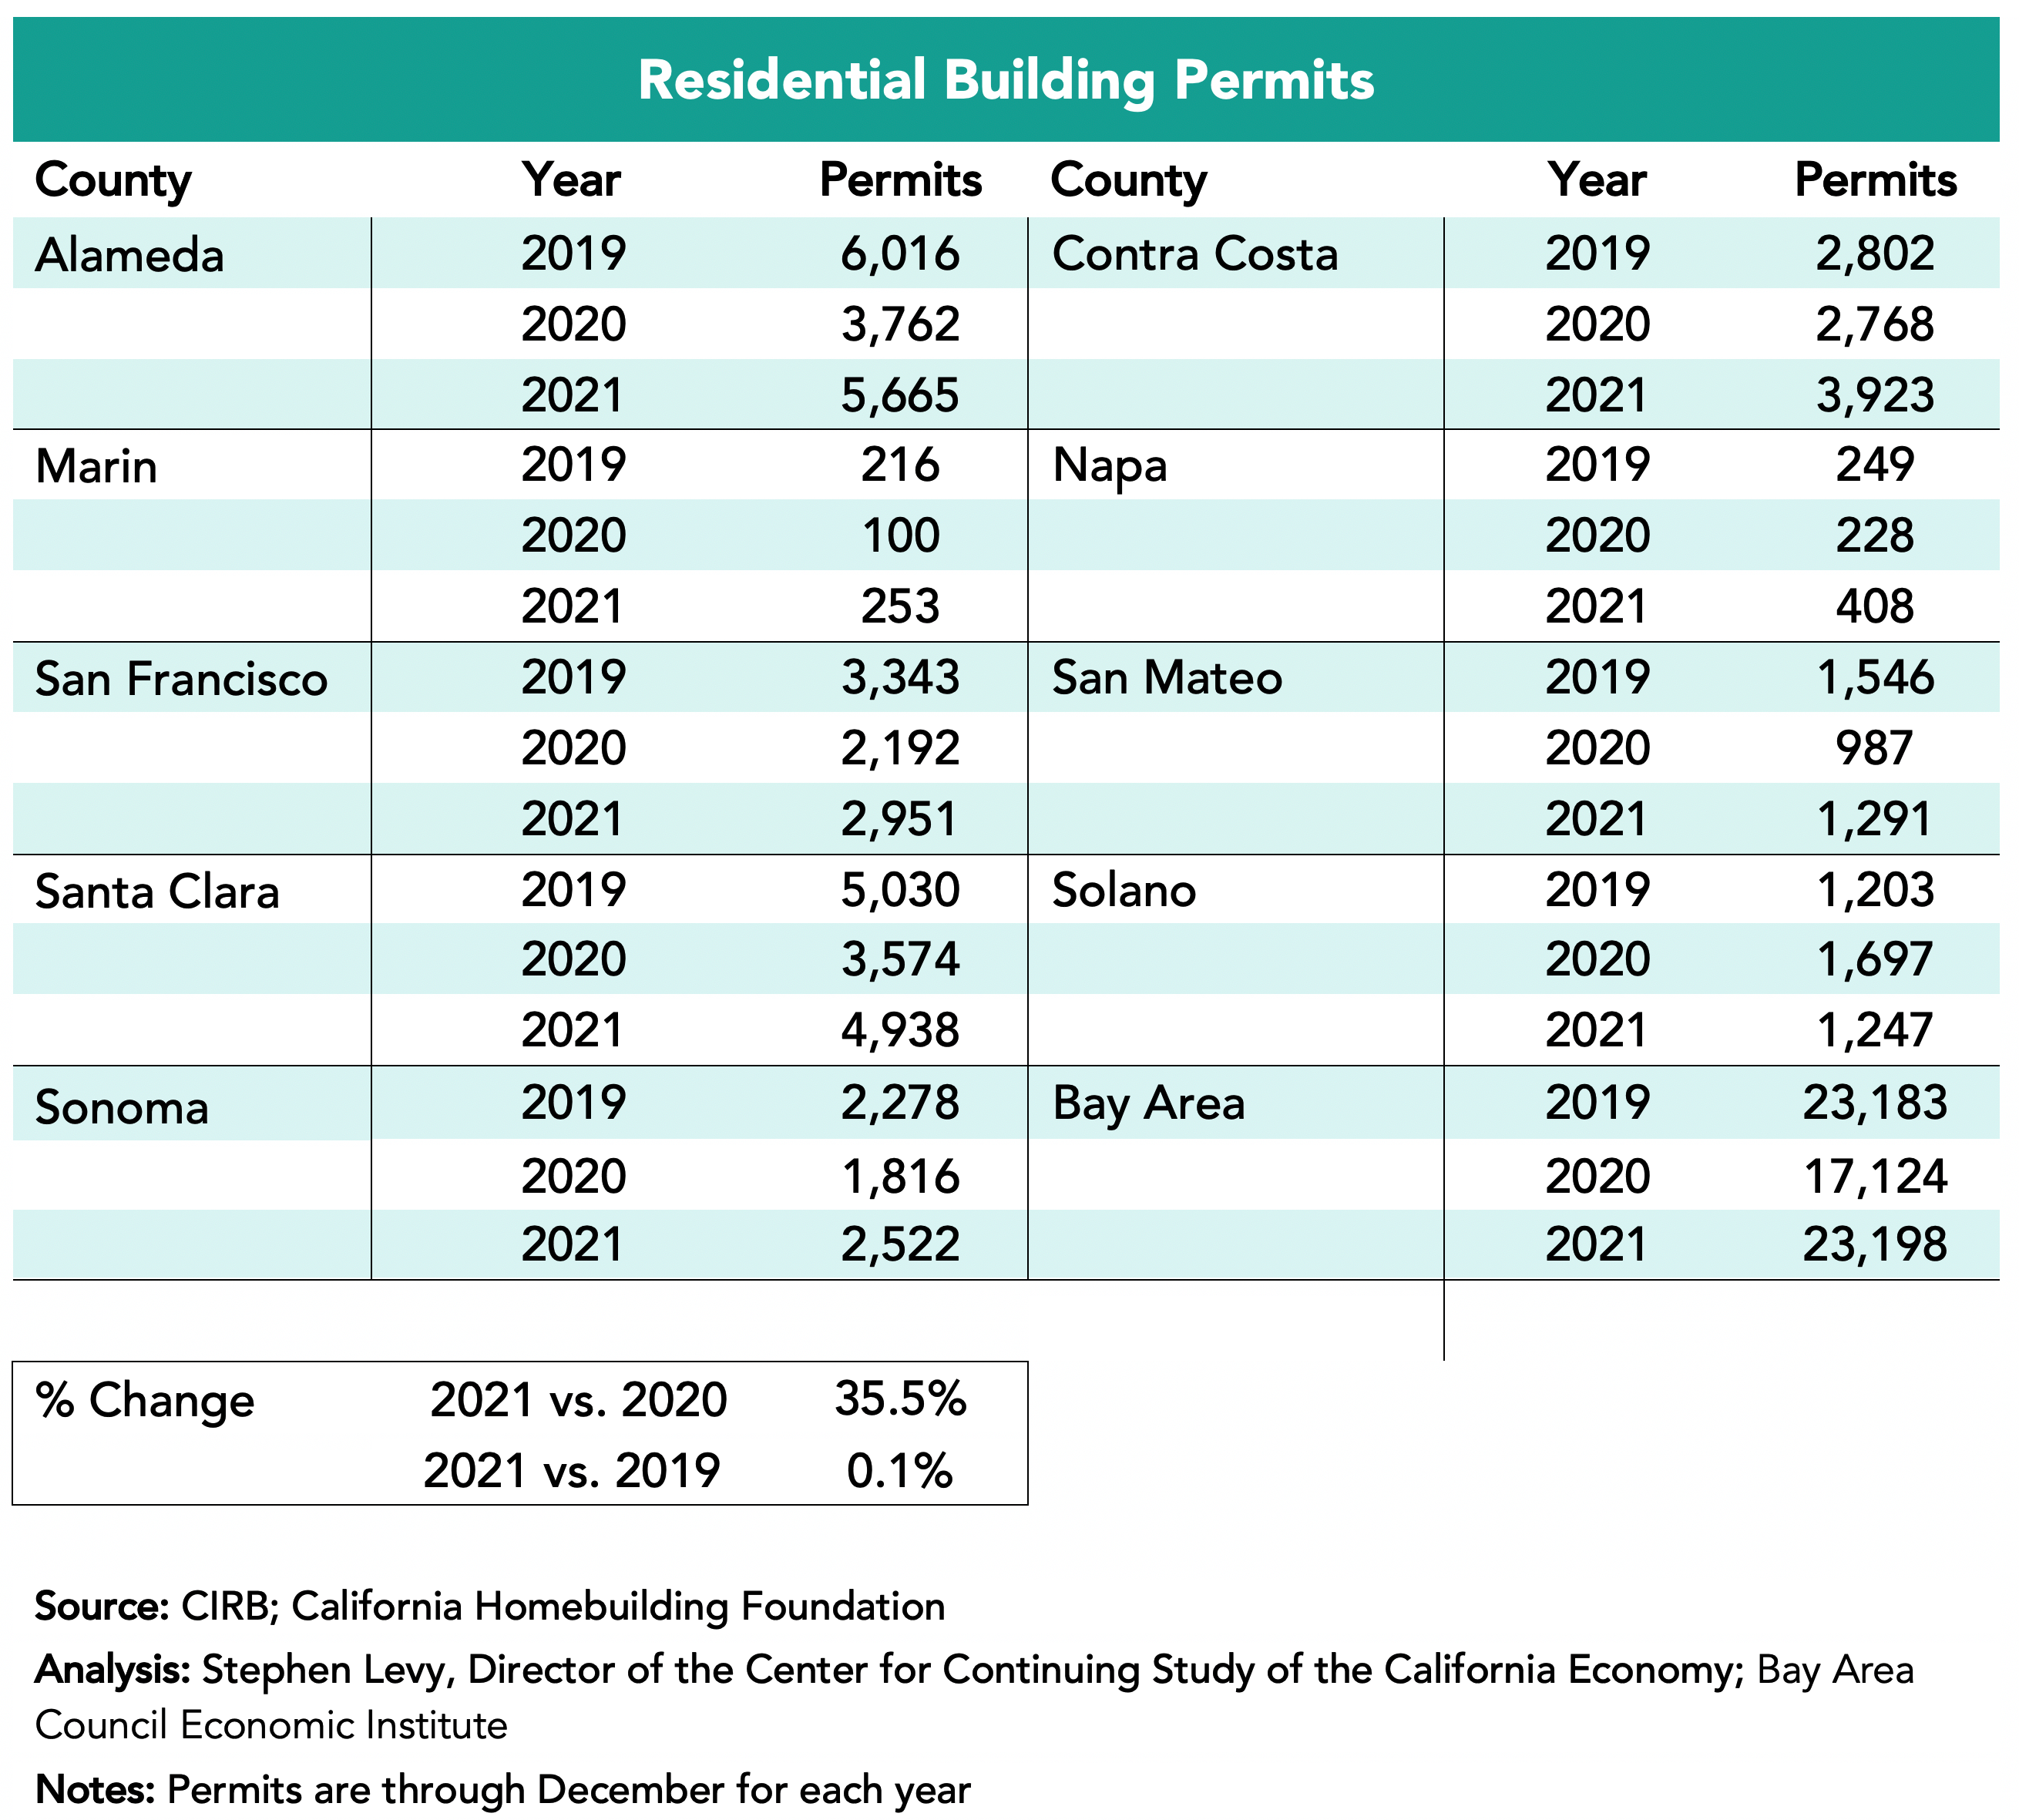
Housing permit levels are up 35.5% in 2021 over 2020 levels and equaled permit levels in 2019. This year all Bay Area cities are required to update their Housing Elements to meet greatly increased regional and local jurisdiction housing goals. Below is a link to a report released on March 18th that I prepared at the request of the Silicon Valley Community Foundation to help residents understand and engage in their city’s Housing Element update process. Although the report focuses on five Midpeninsula cities—Cupertino, Menlo Park, Mountain View, Palo Alto and Sunnyvale—it has broad applicability for other communities. The report is part of an engagement effort led by SV@Home with local partners.
These economic updates are authored by Stephen Levy, Director of the Center for Continuing Study of the California Economy, and a member of the Bay Area Council Economic Institute board.
Bay Area Economic Growth Estimates for 2021 Revised Upwards
March 21, 2022
Bay Area job growth in 2021 was revised upward in annual revisions released in March 2022 by EDD. At the same time, unemployment rates for December 2022 were slightly reduced. The Bay Area posted record VC funding in 2021. Housing permits rebounded to 2019 levels but remain far below region’s housing goals for the next 8 years. All Bay Area jurisdictions must update their Housing Elements in 2022 to meet state and regional housing goals and requirements.
The highlights:
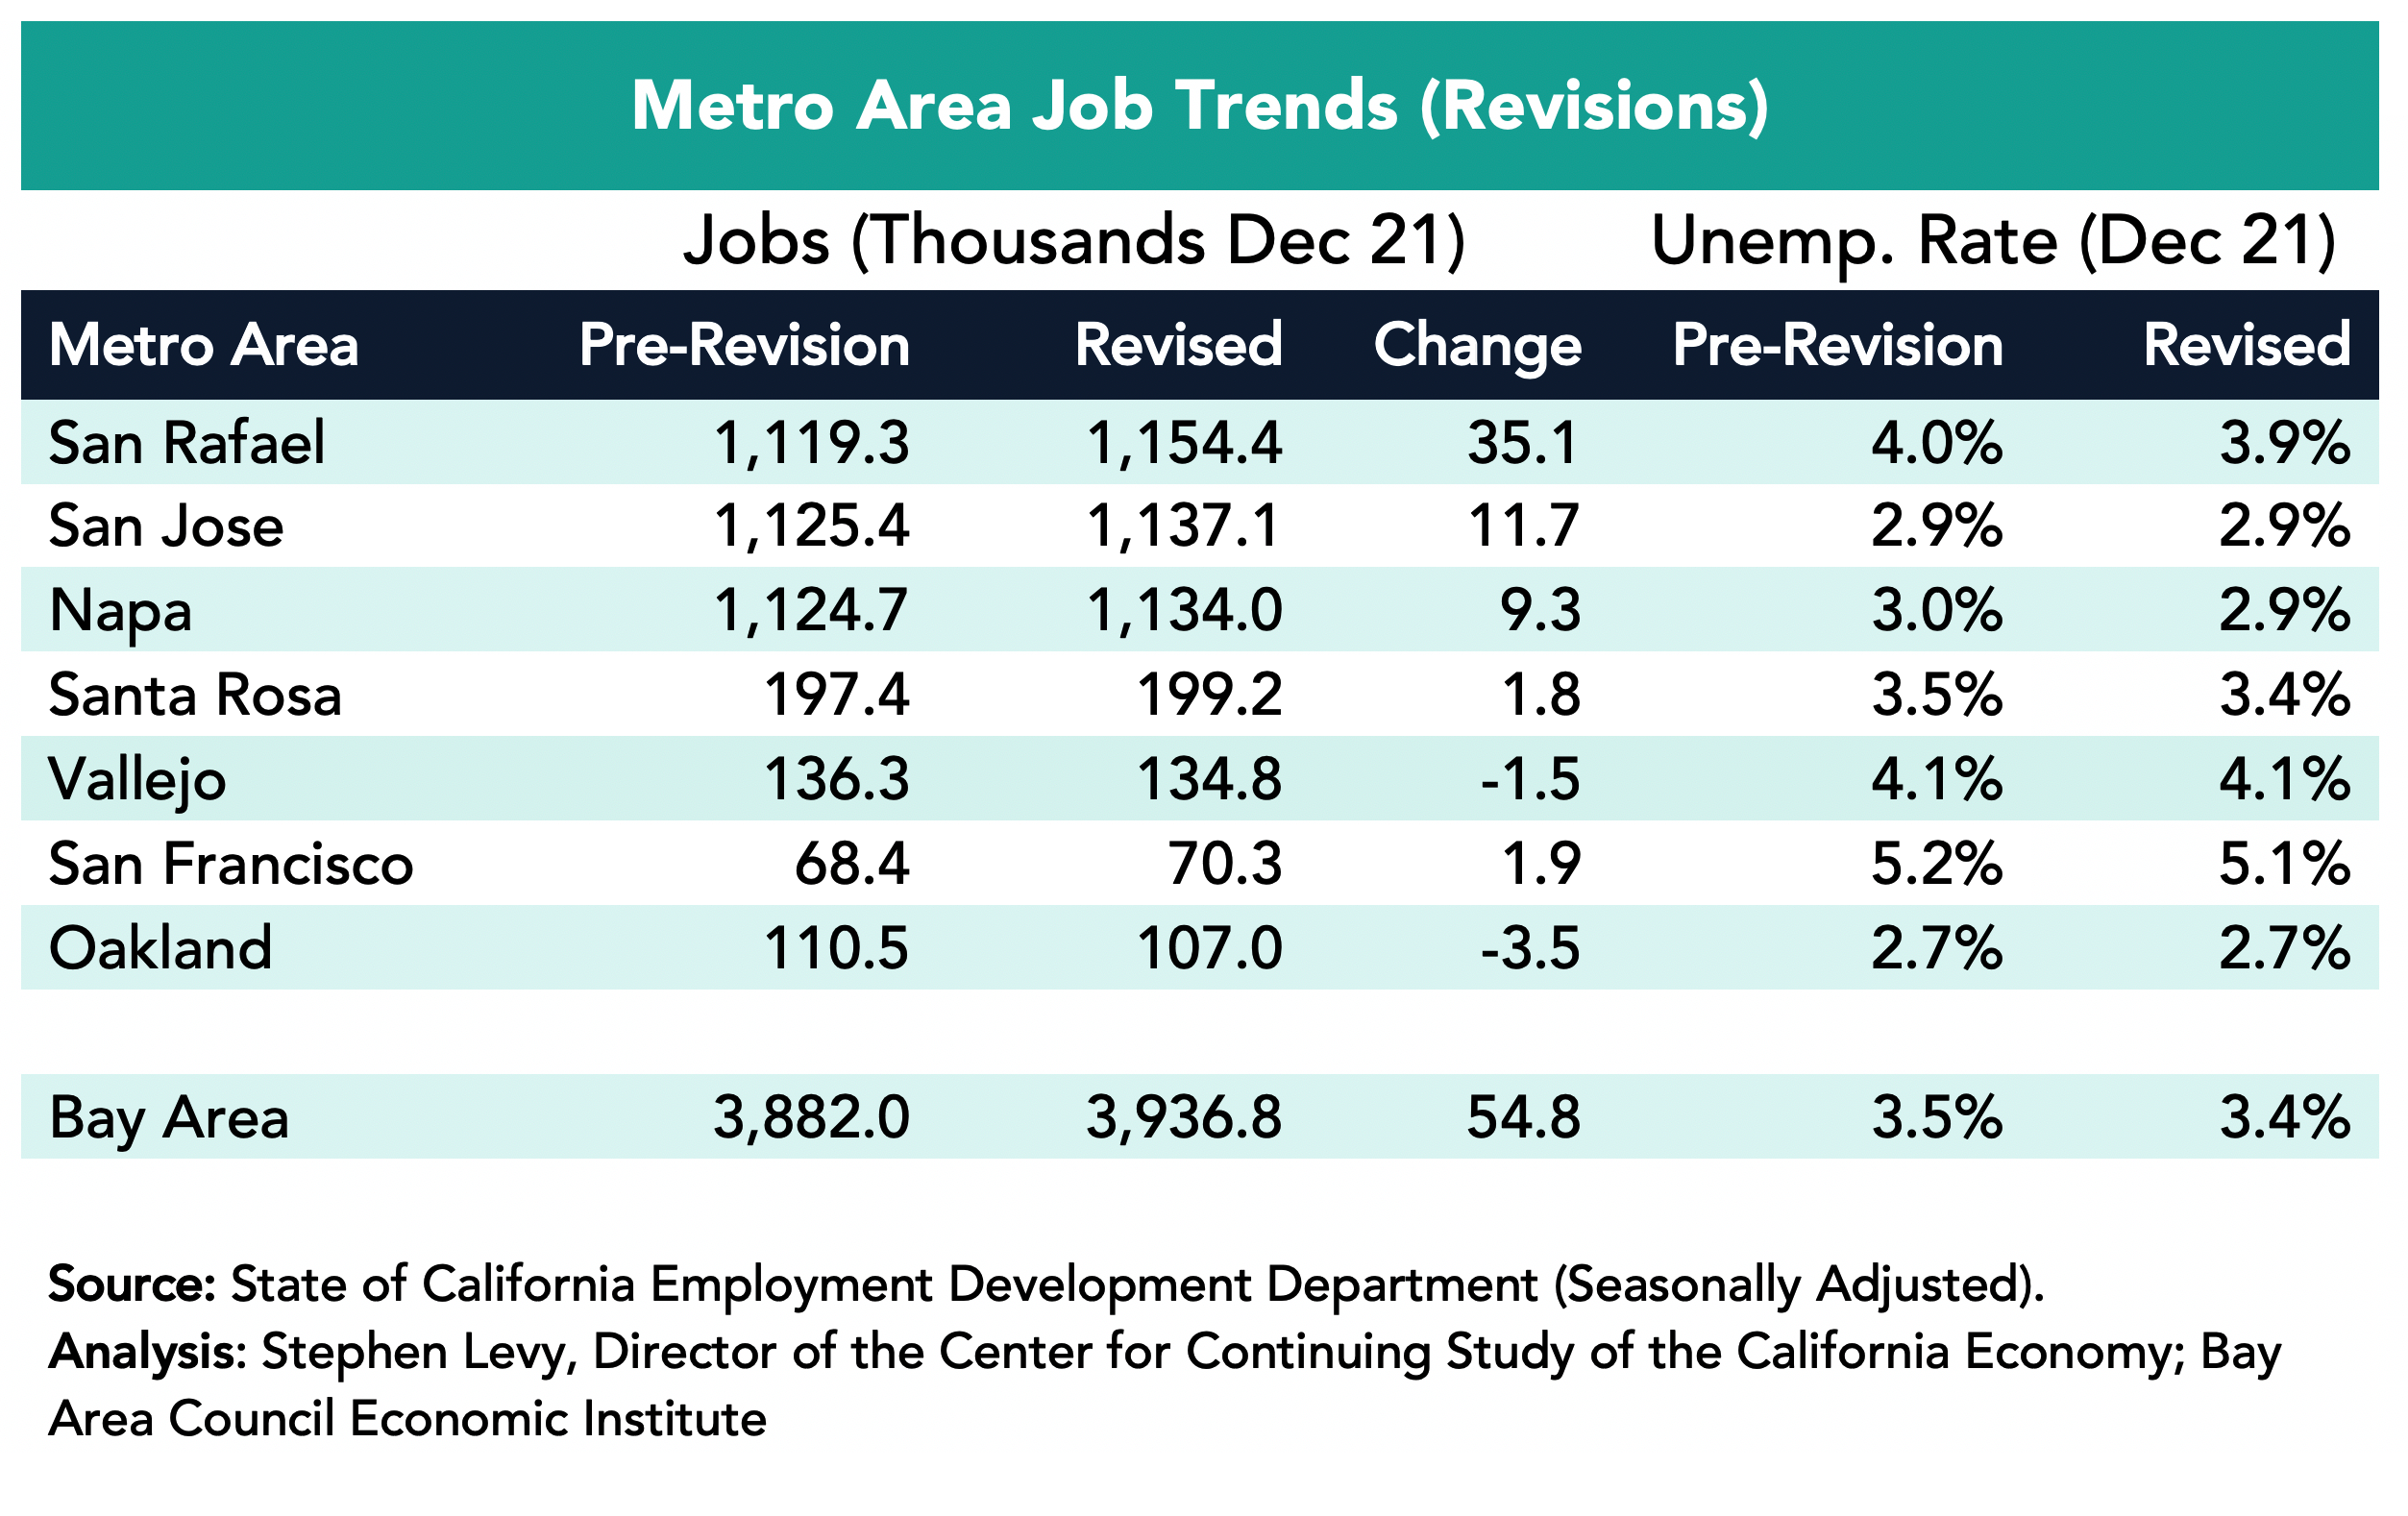
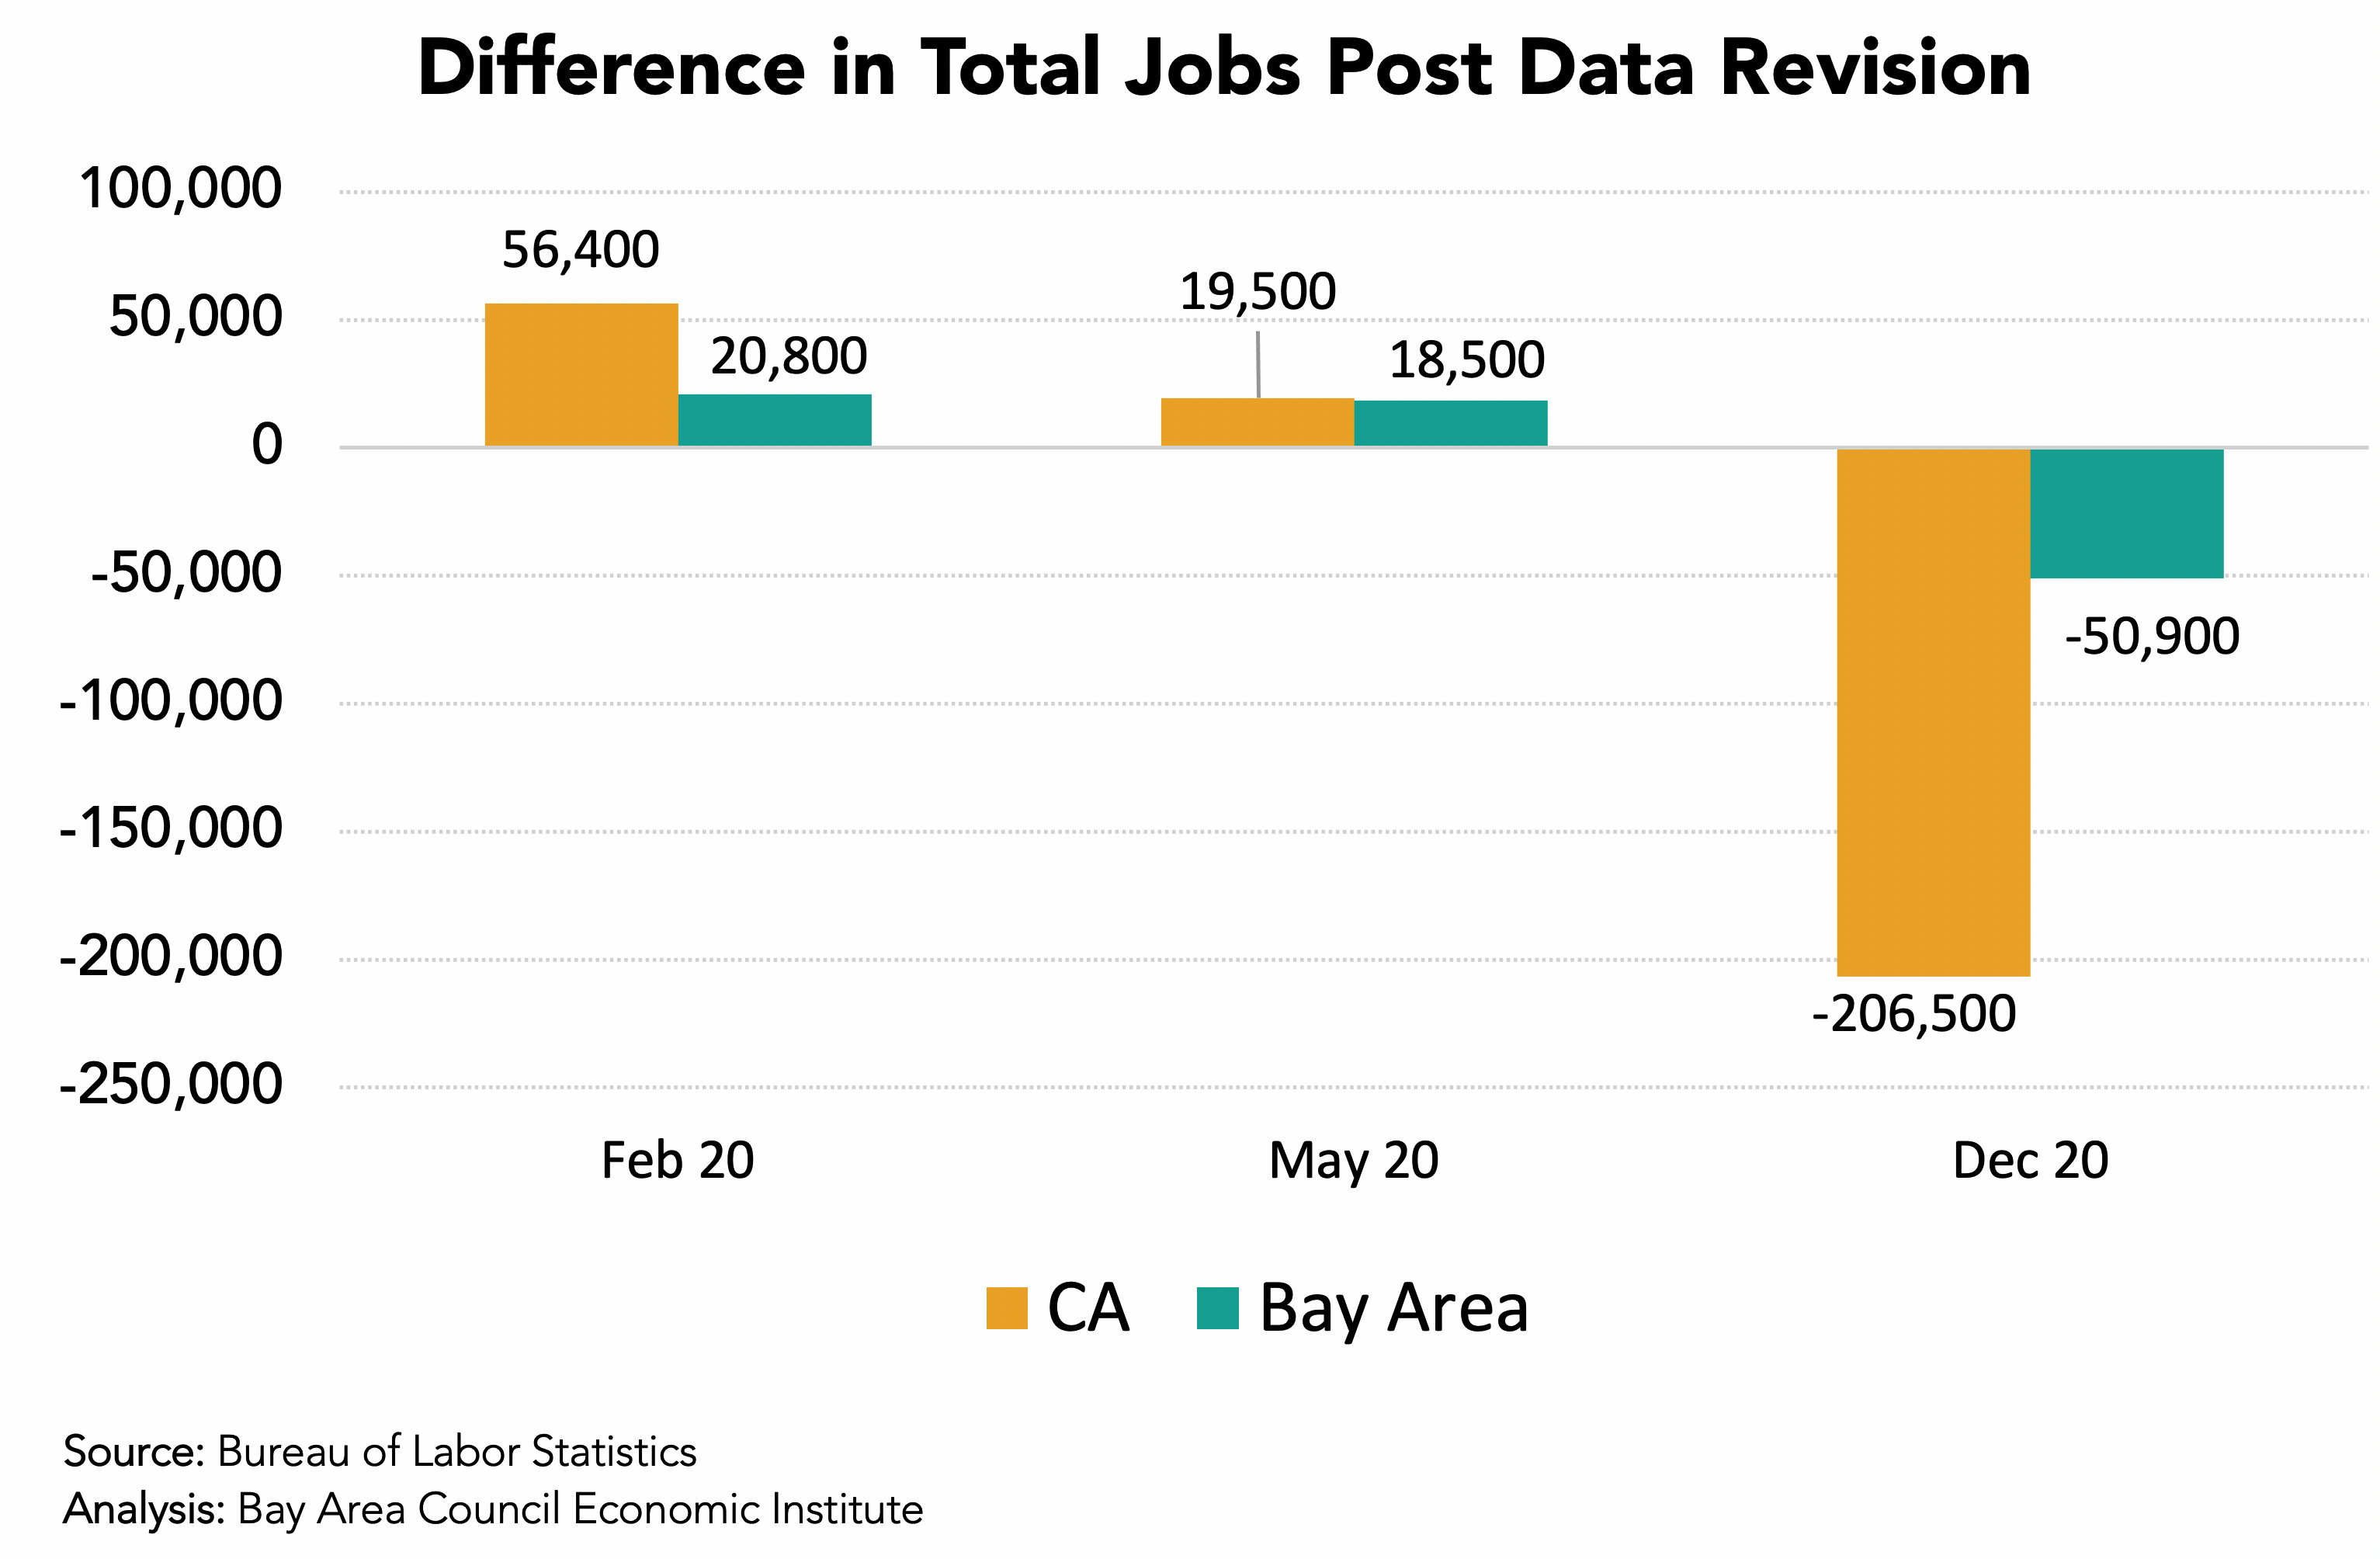
• Bay Area job estimates for December 2021 rose by 54,800 compared to the pre-revision estimates.
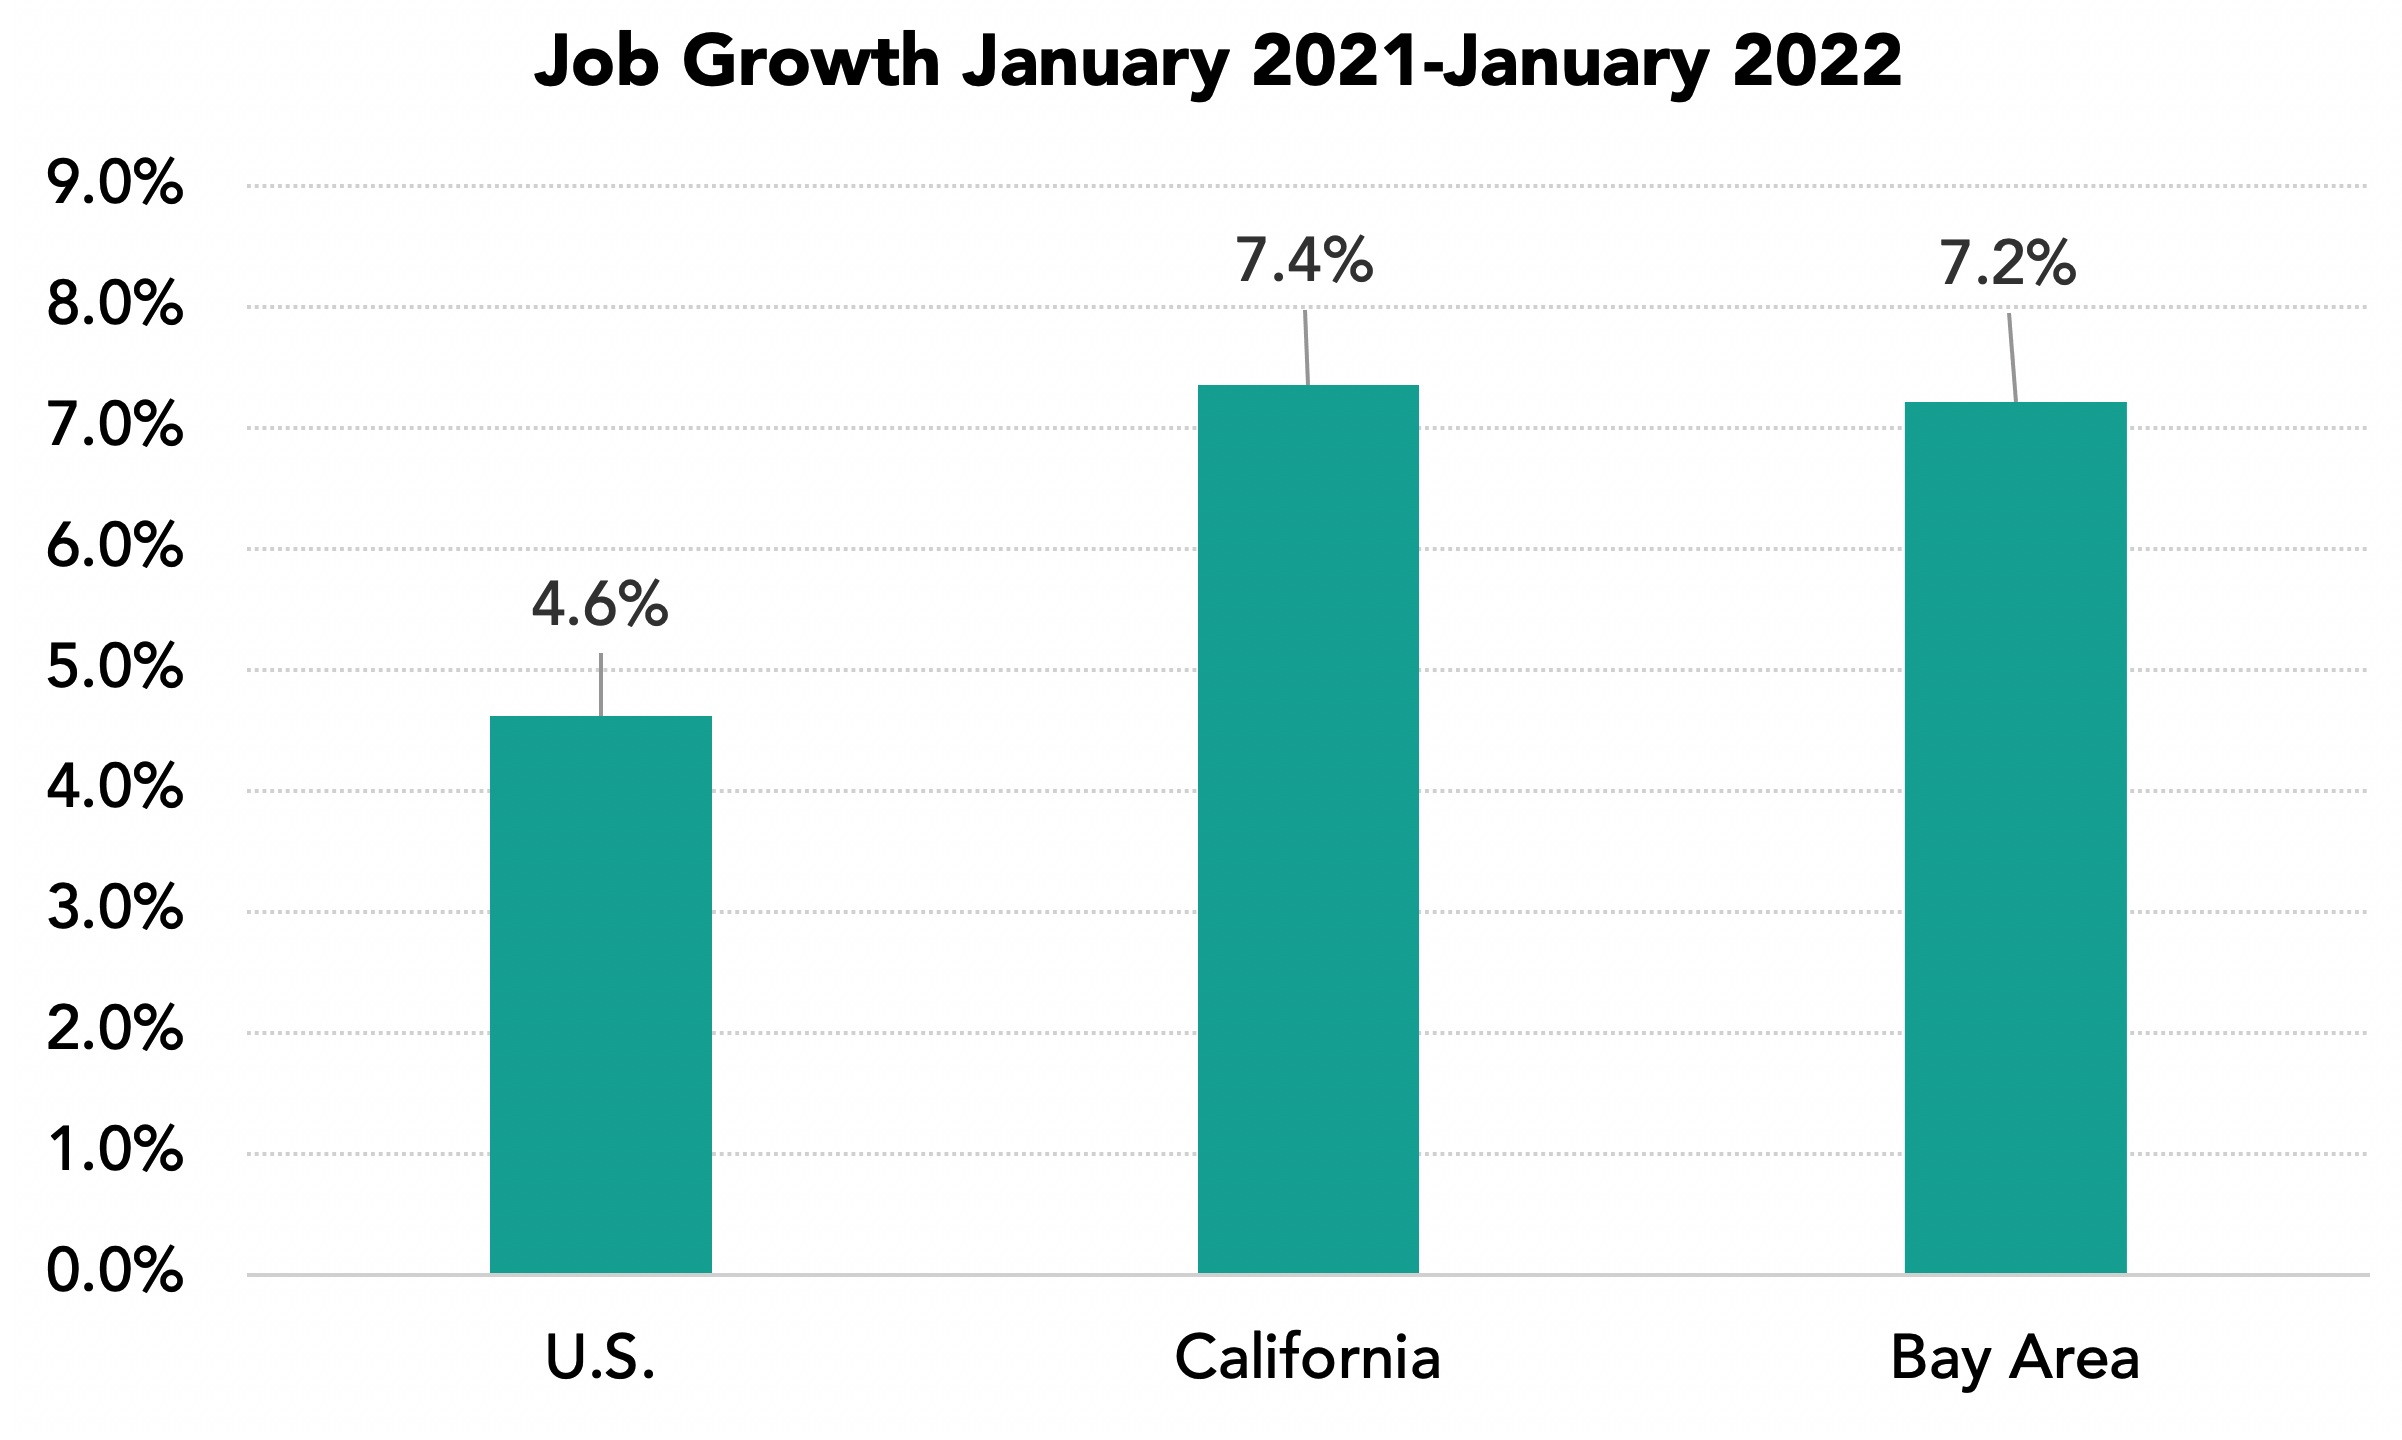
• Bay Area jobs increased by 7.2% between January 2021 and 2022 compared to a 4.6% increase in the nation and 7.4% gain in California.
• The Bay Area unemployment rate in December 2021 was 3.4% compared to 3.5% in the pre-revision estimate.
• March 2022 brings major crosscurrents to the global, national and regional economy with the Russian invasion of Ukraine, rising interest rates amidst continuing high inflation, the easing of COVID cases and related activity restrictions and the ongoing Bay Area challenges of housing, transportation and competitiveness.
• Bay Area jurisdictions have been given large increases in their housing goals for the next eight years as a result of state legislation and policy to reduce overcrowding and increase affordability. Each jurisdiction is in the process of updating their Housing Elements in 2022 to meet state and regional policy goals and requirements.
The Oakland Metro Area Had the Largest Upward Job Revision
December job levels in the Oakland metro area were revised up by 35,100 or nearly 2/3 of the regional revision. Other gains were posted in the San Francisco and San Jose metro areas. Unemployment rate estimates were revised slightly downward in most metro areas. The regional unemployment rate for December 2021 was revised down to 3.4% from the pre-revision estimate of 3.5%.
The Bay Area Outpaced the Nation in 2021 Job Growth
Bay Area jobs increased by 7.2% between January 2021 and January 2022 outpacing the national 4.6% growth rate. The region still lags the nation and state in the percentage of jobs recovered since April 2020 as a result of the large job losses in 2020.
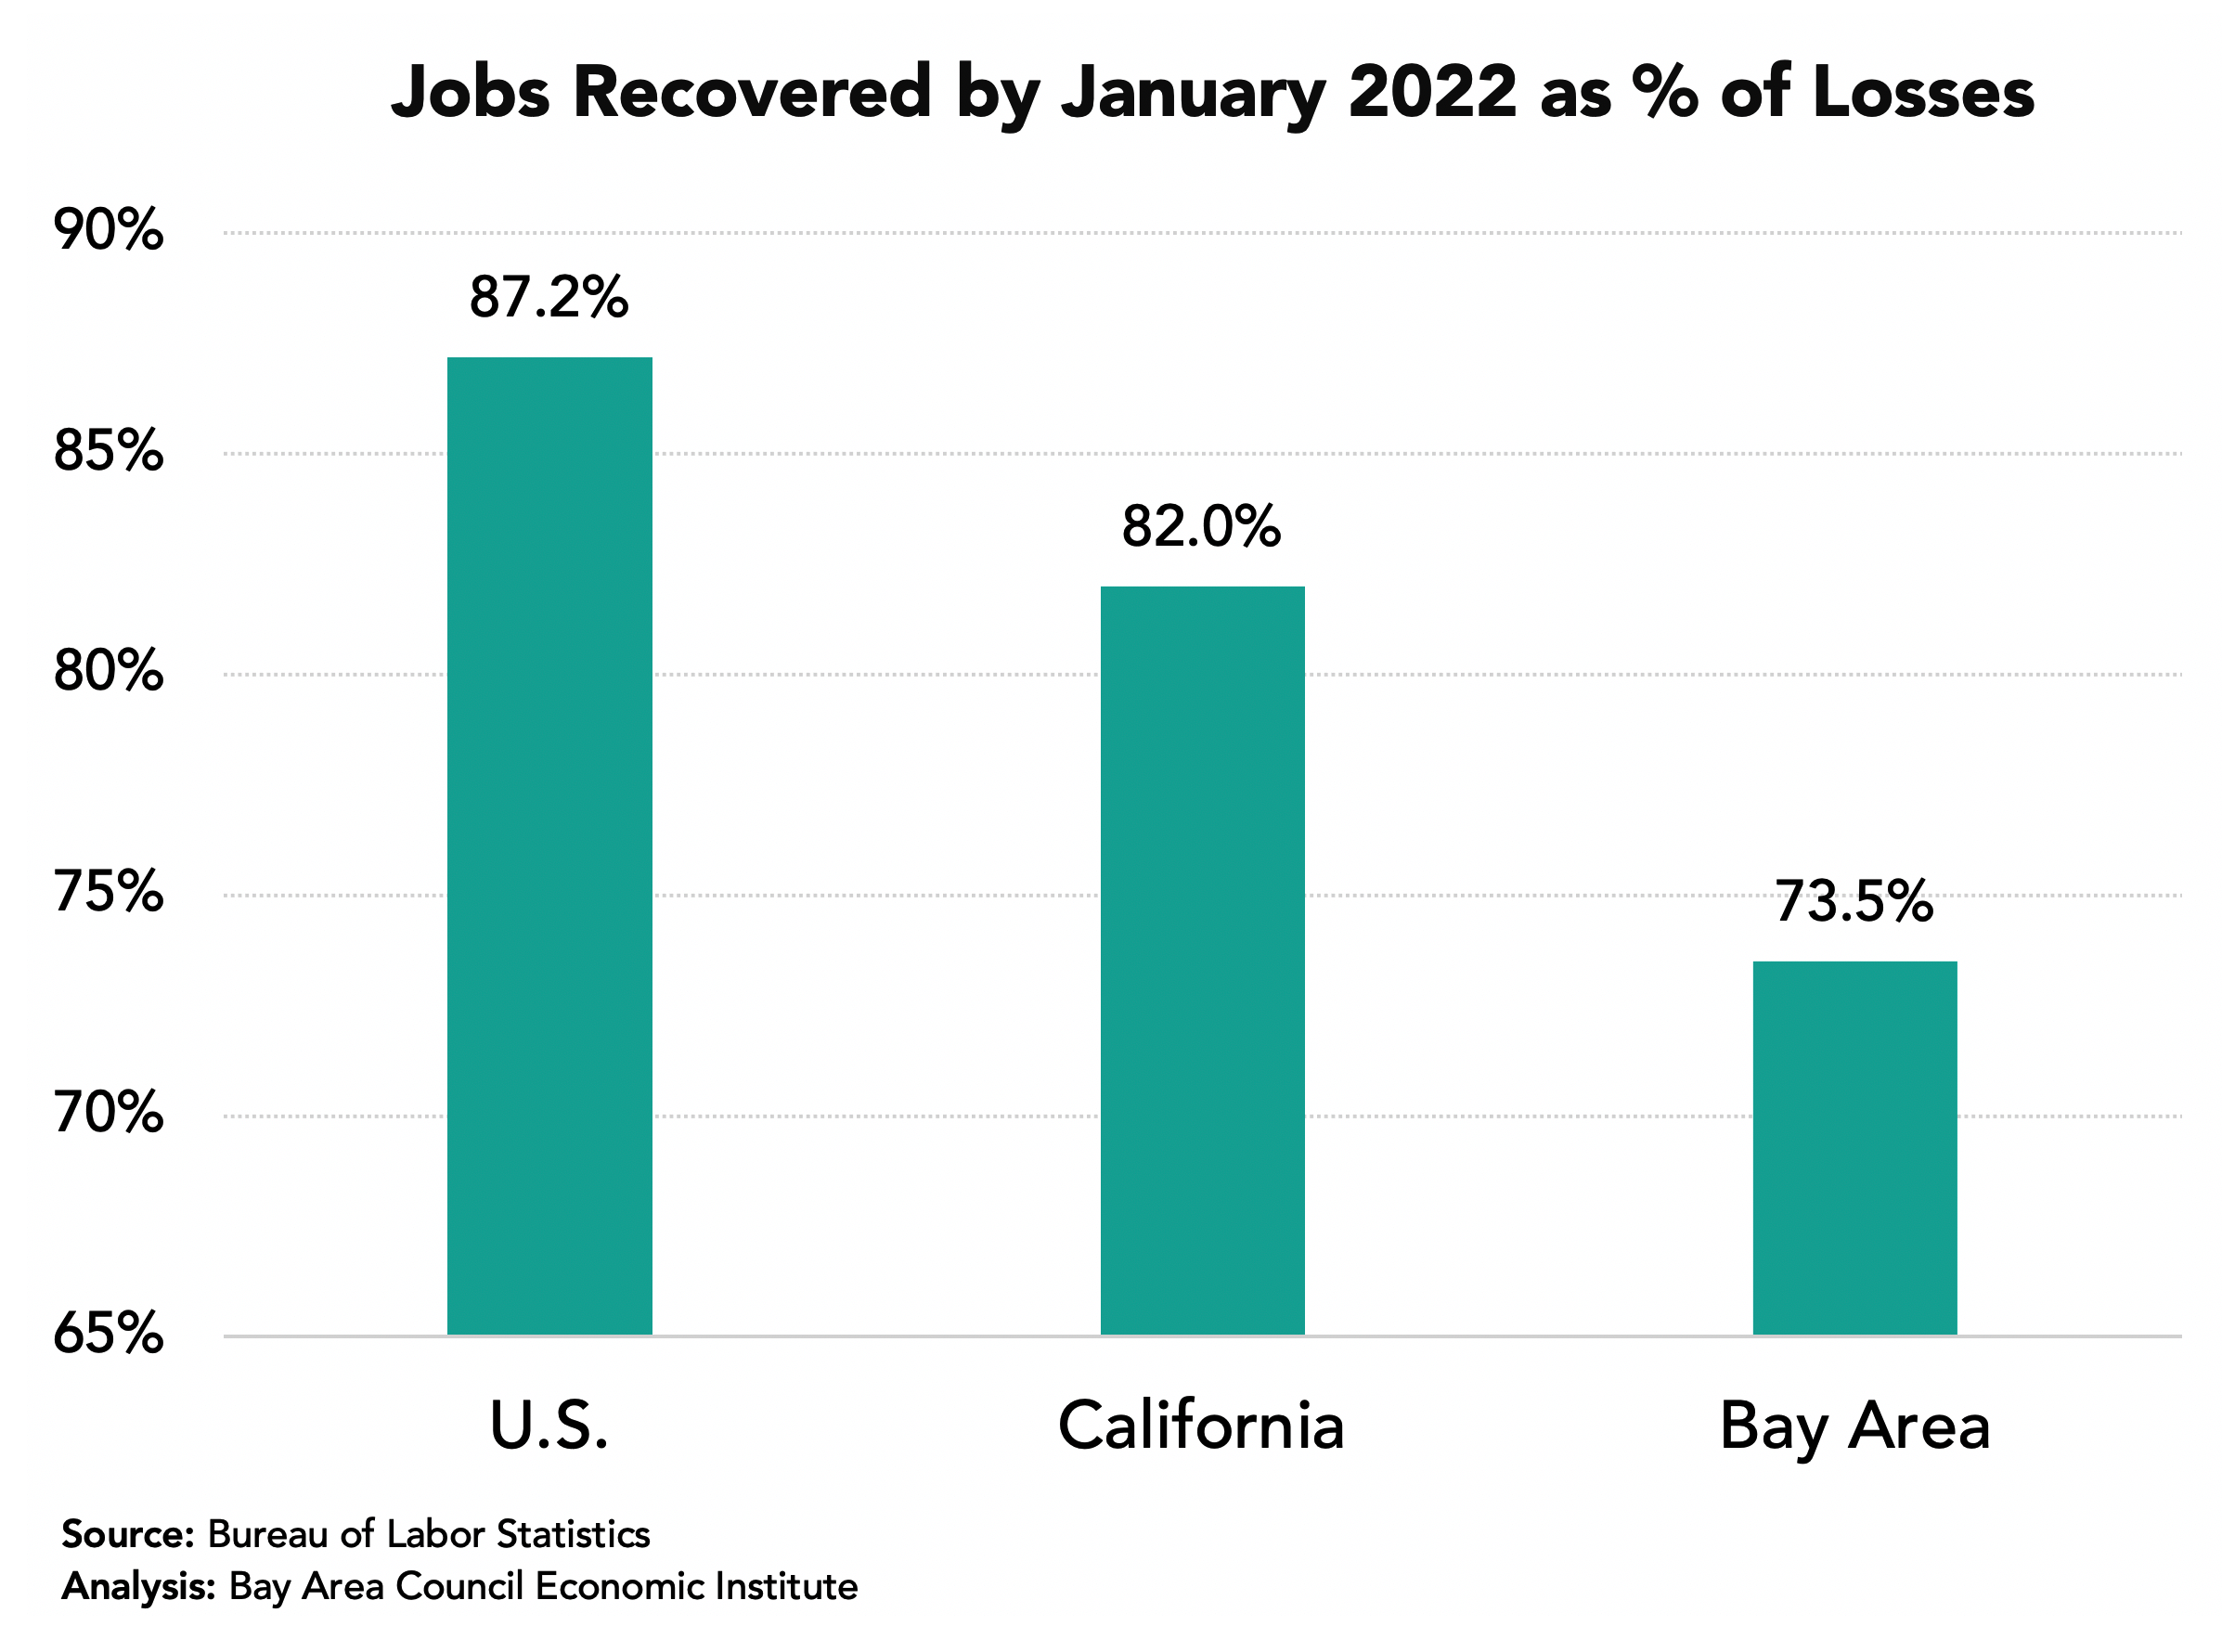
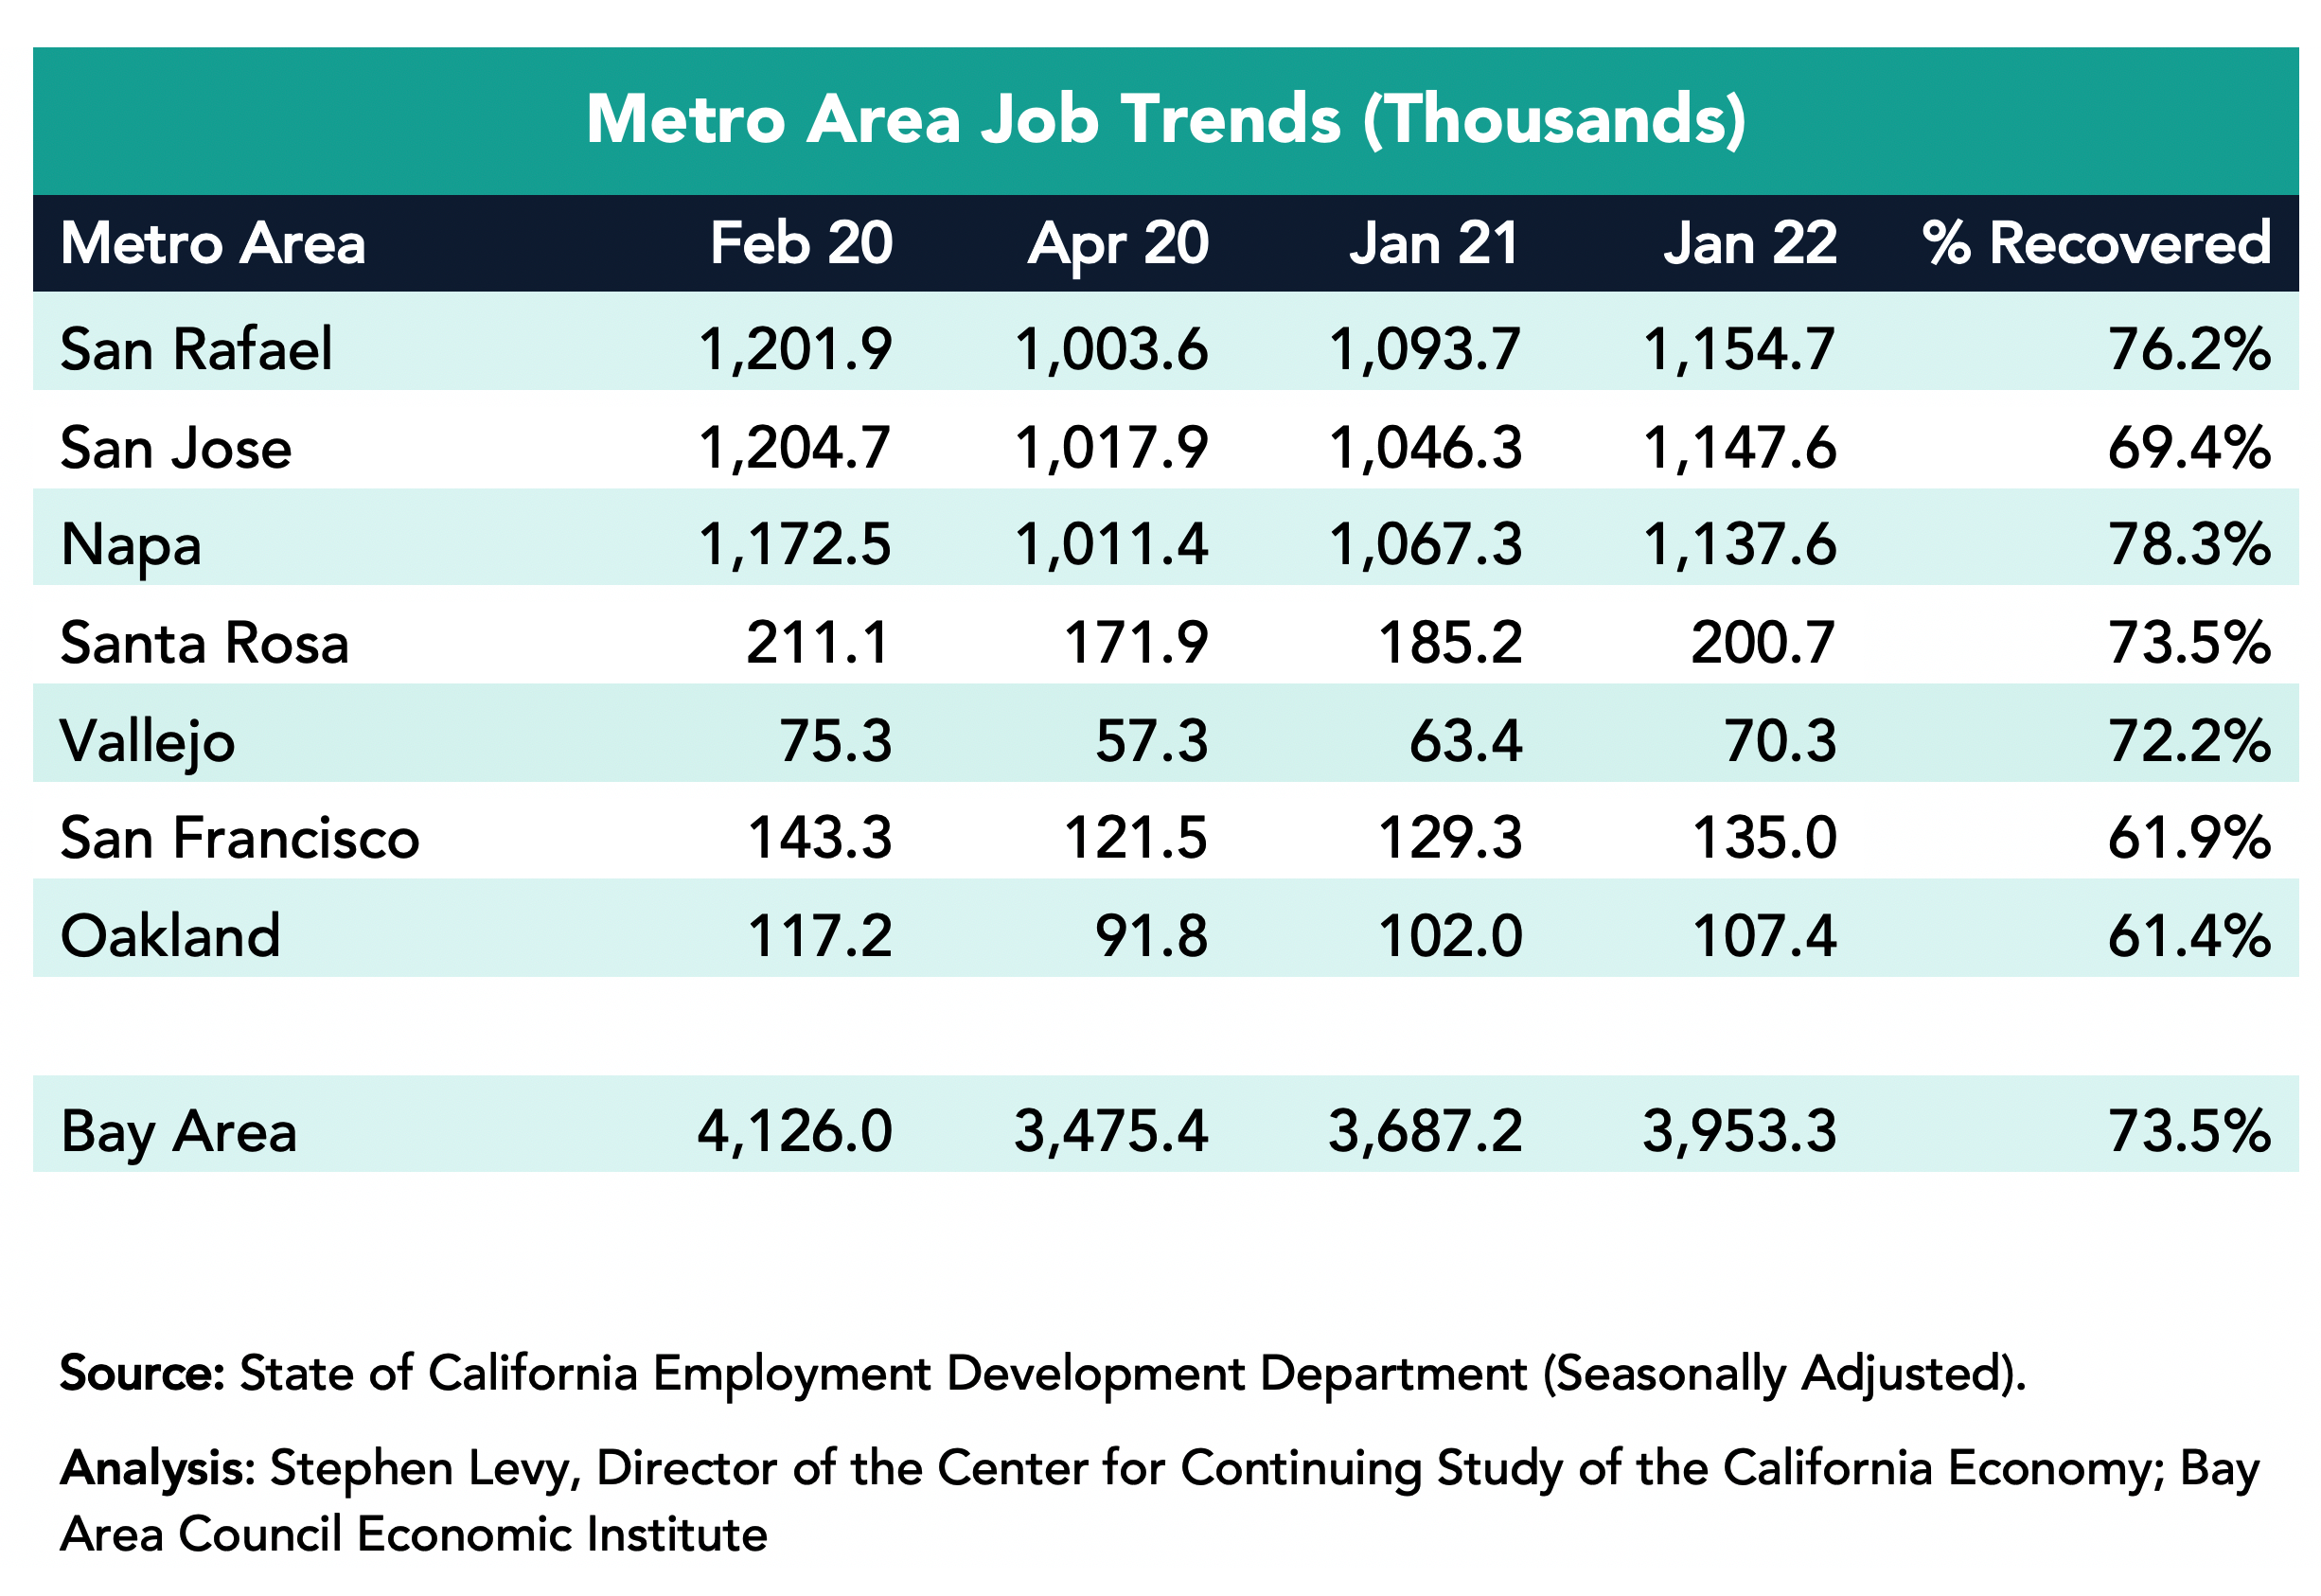
By January 2022 the region had recovered 73.5% of the jobs lost between February and April 2020. This is a lower recovery rate than the state and nation, though the region has closed the gap in recent months.
The Bay Area added 266,100 jobs in the past year led by a gain of 101,300 in the San Francisco metro area though SF has recovered just 69.4% of the jobs lost between February and April 2020. The San Jose metro area added 70,300 jobs and by January 2022 had recovered 78.3% of the jobs lost between February and April 2020. The Oakland metro area added 61,000 jobs.
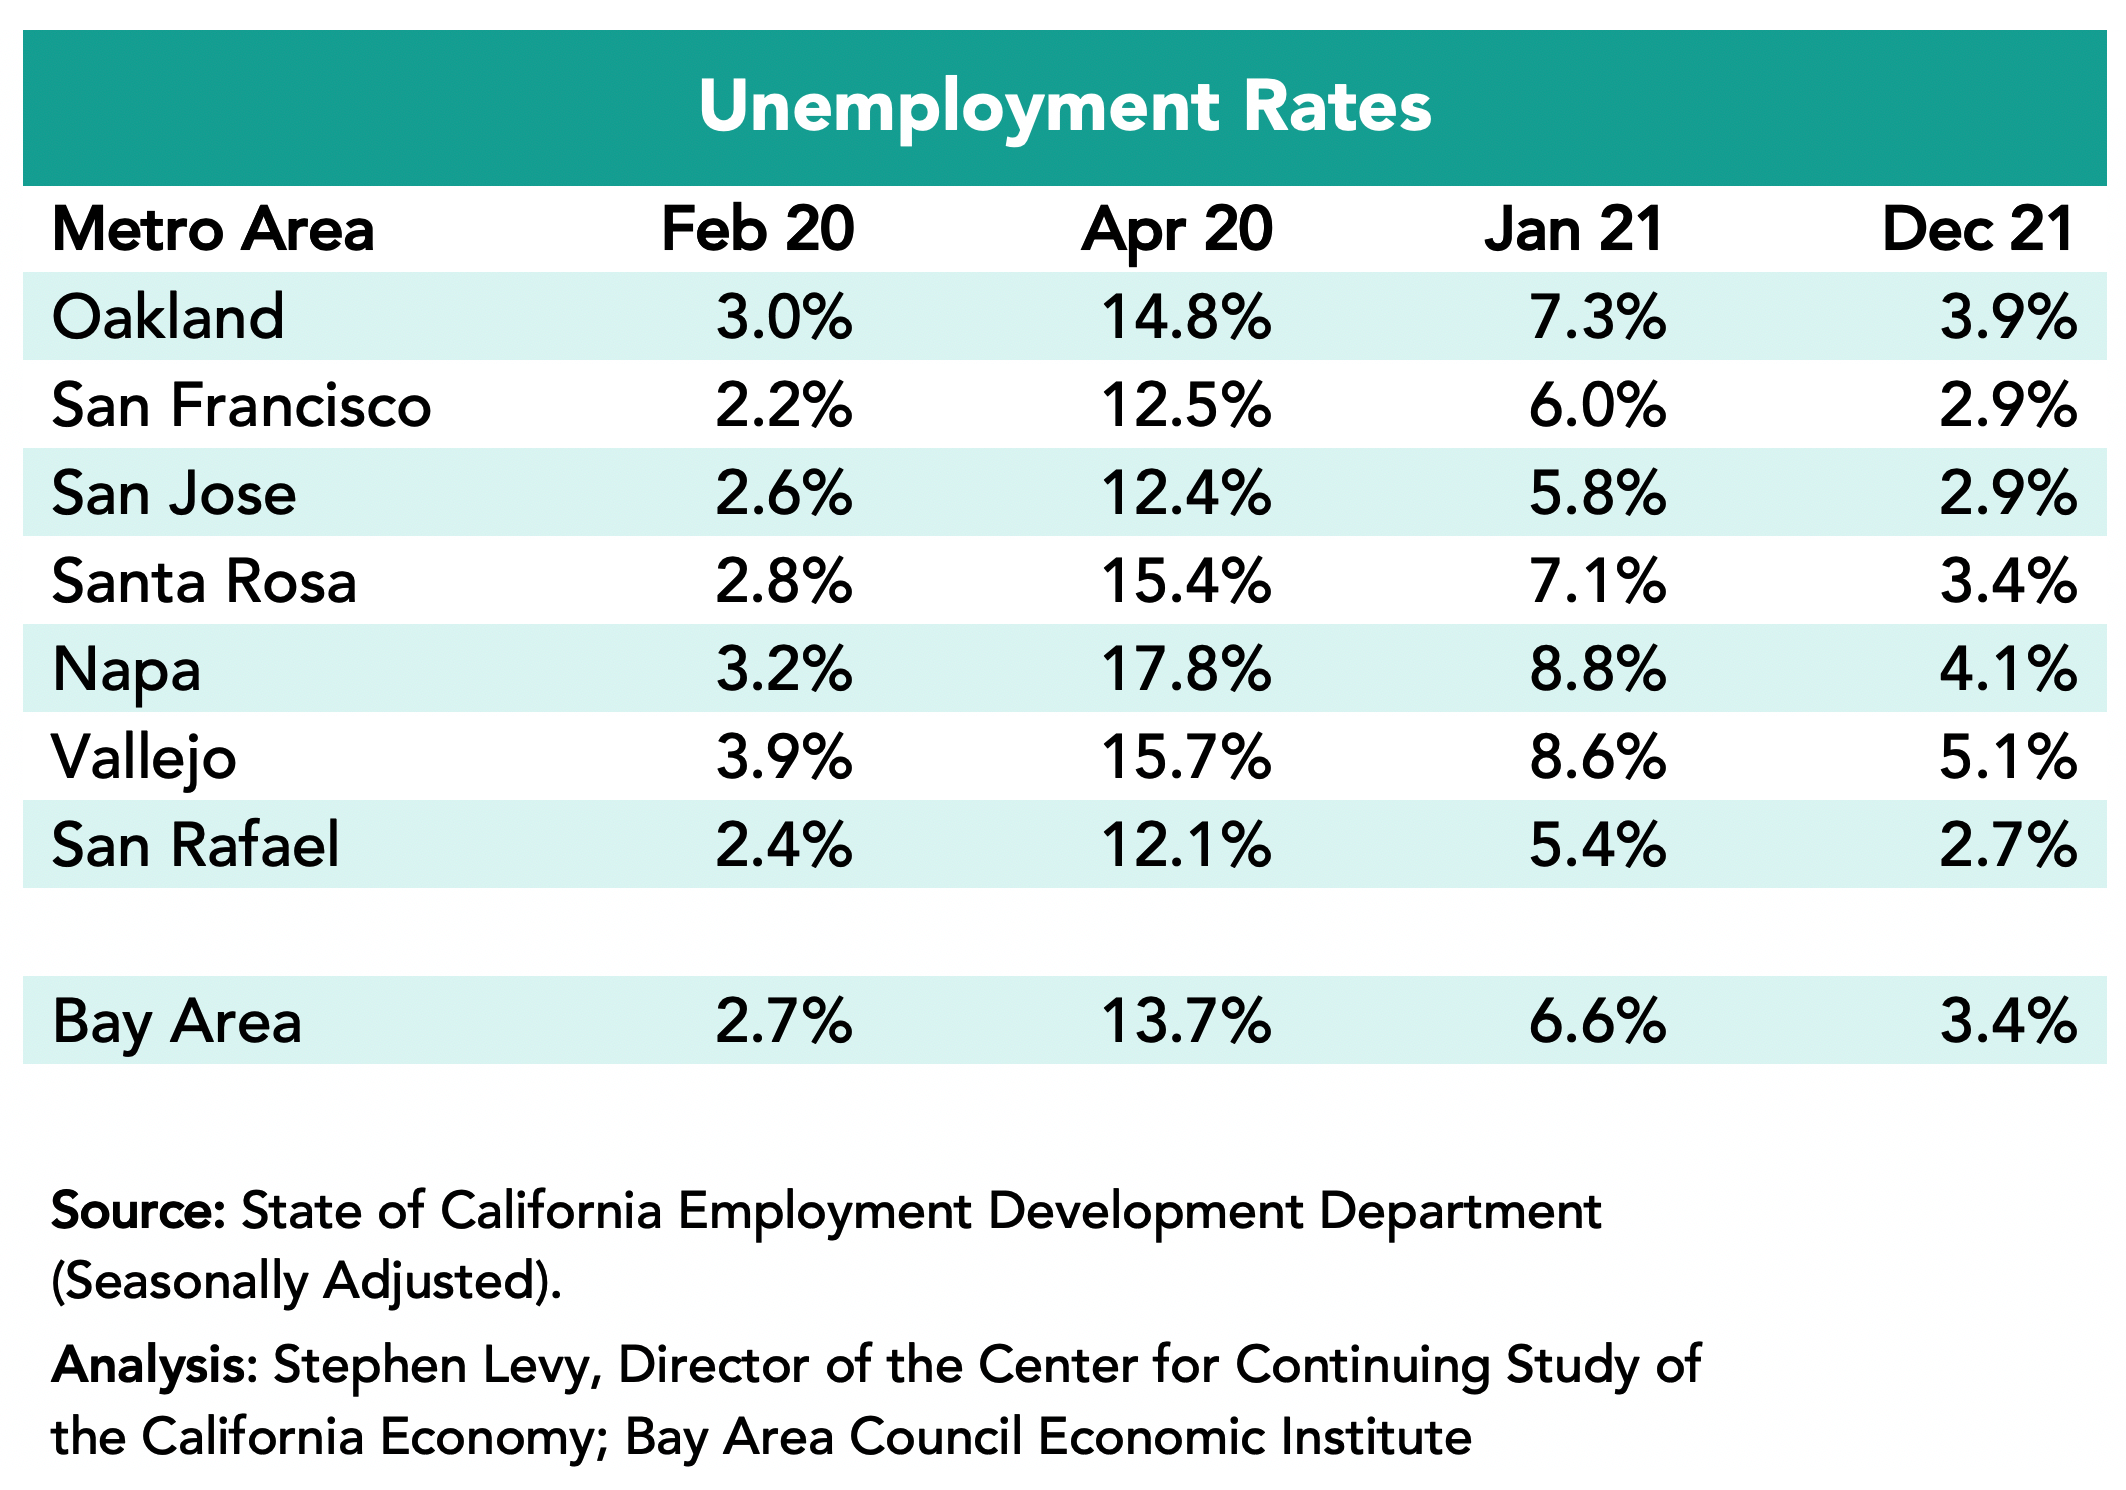
Unemployment Rates Fell to 3.4% in the Region in December 2021 from 6.6% in January 2021.
The lowest rates were in the San Rafael metro area (2.7%) followed by the San Francisco and San Jose metro areas (2.9%) in December 2021.
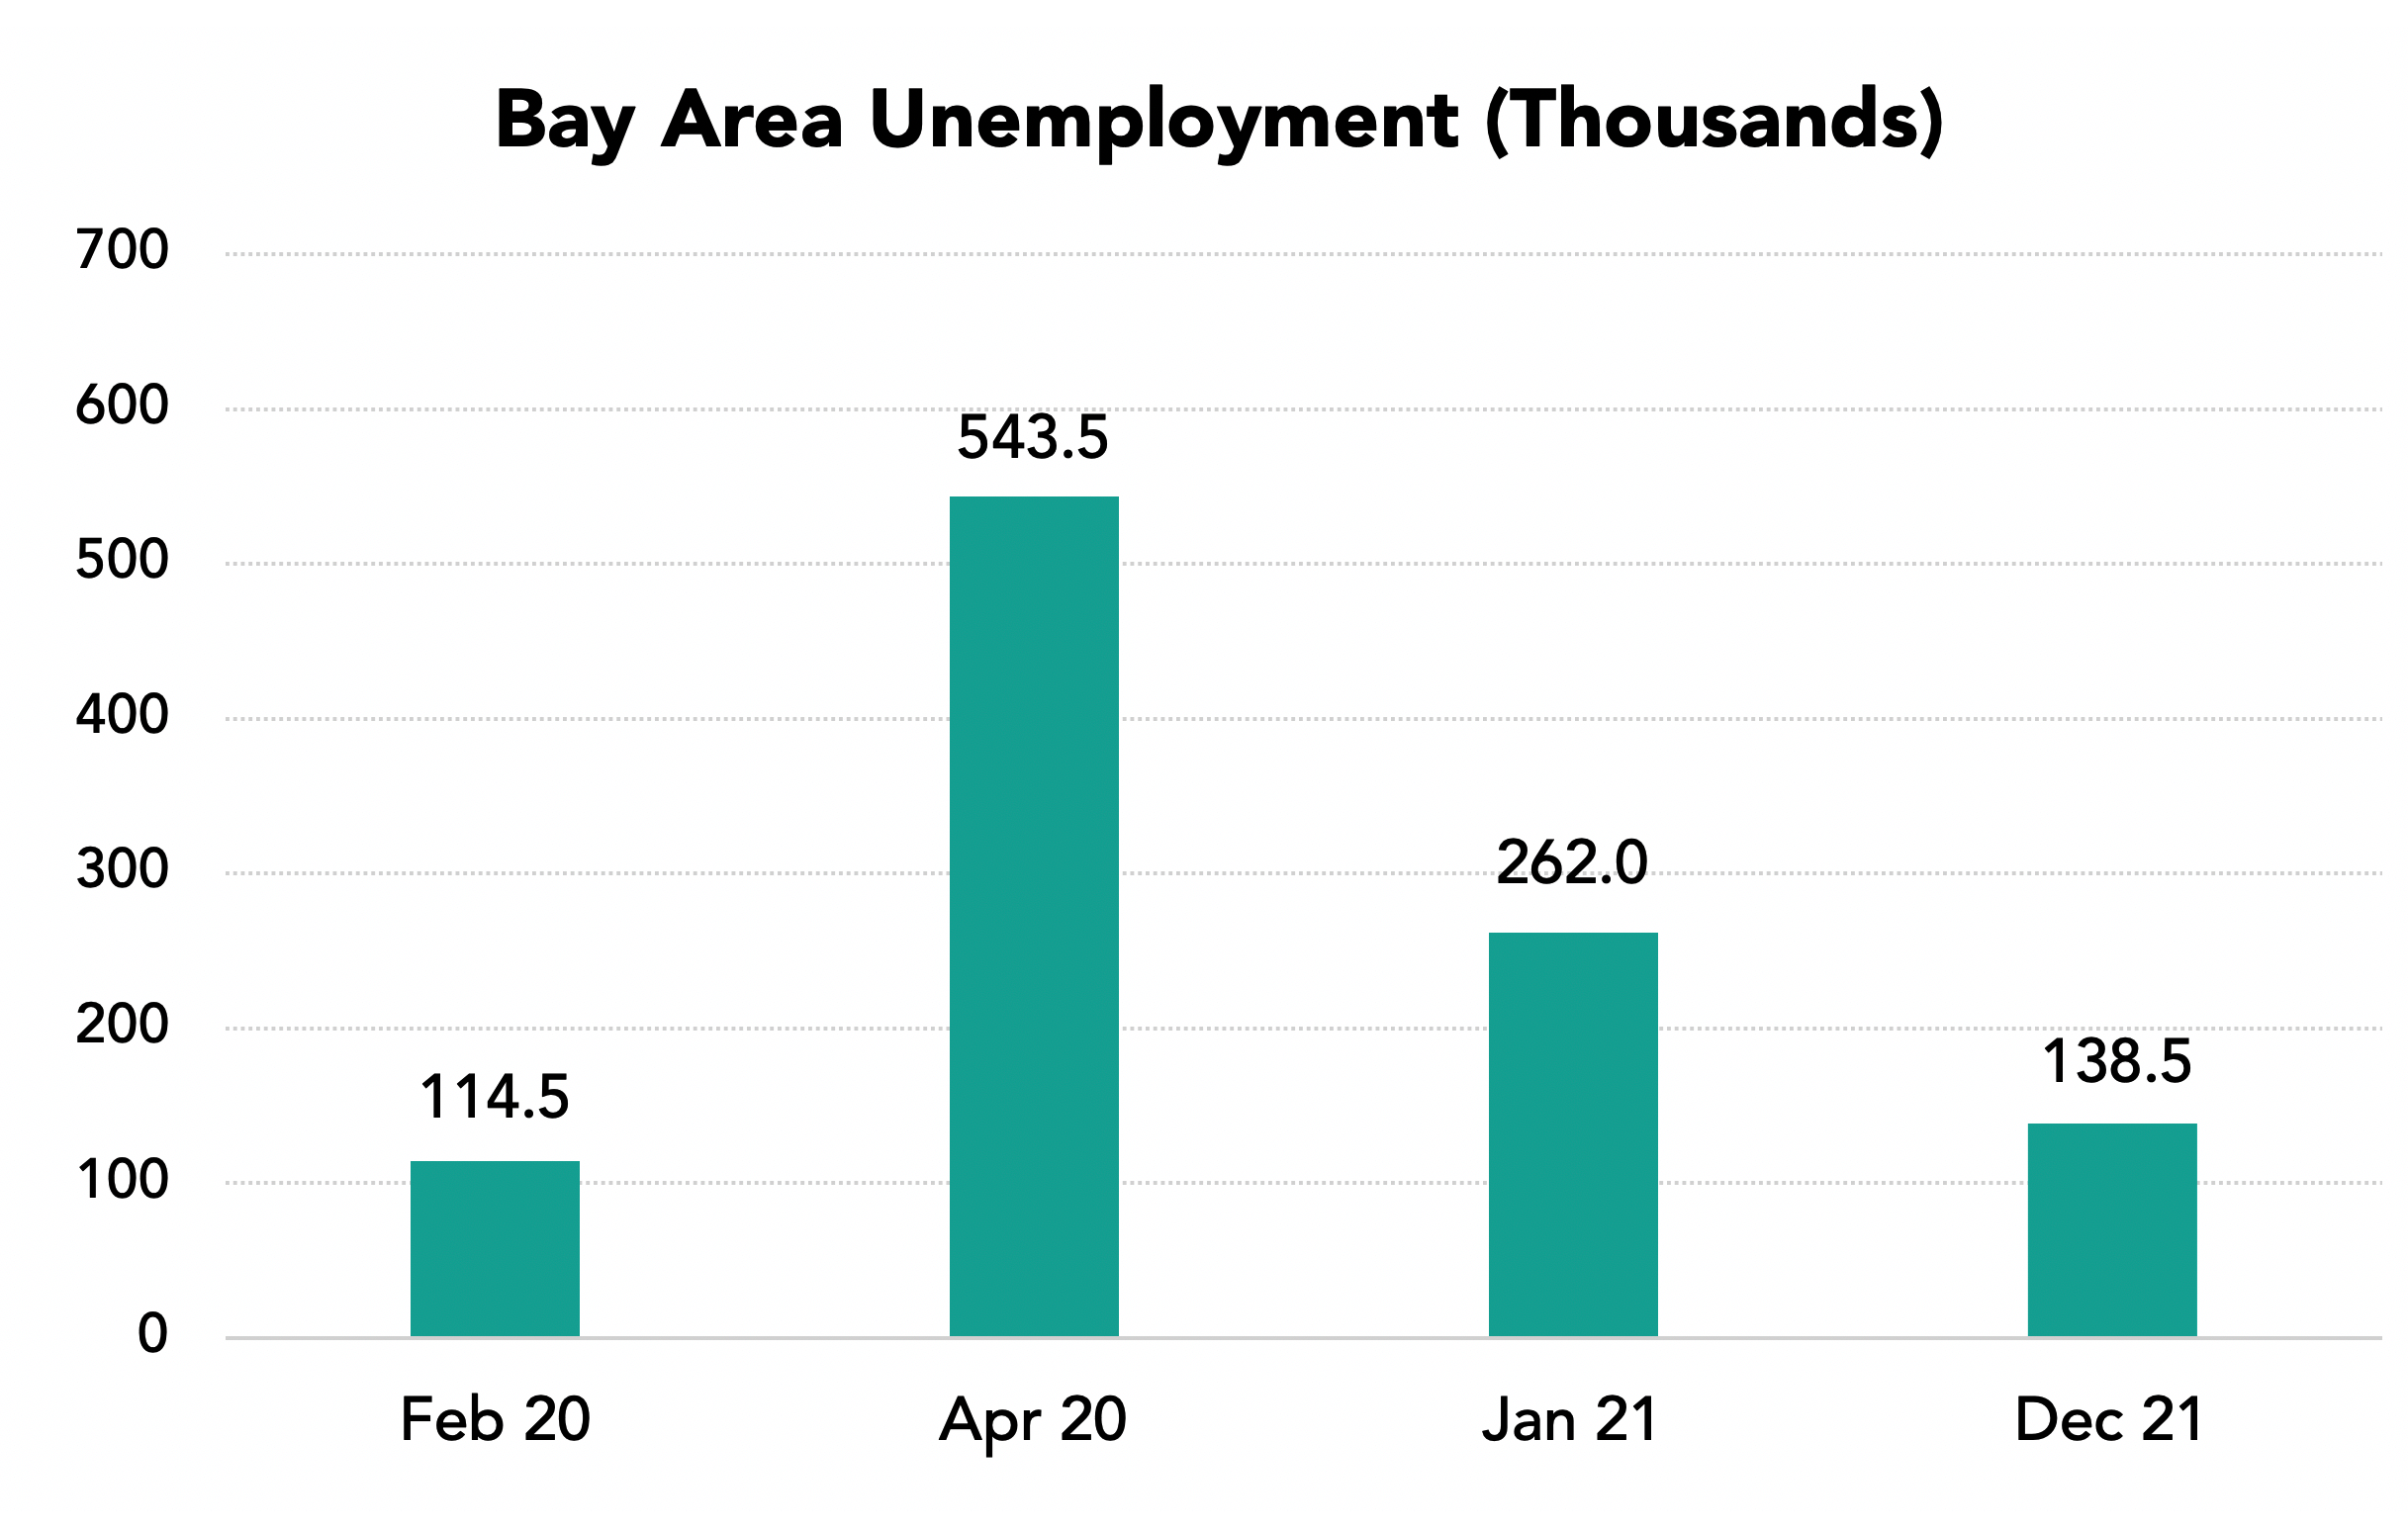
The number of unemployed residents has fallen sharply from the April 2020 high and from January 2021 to 138,500 in December 2021.
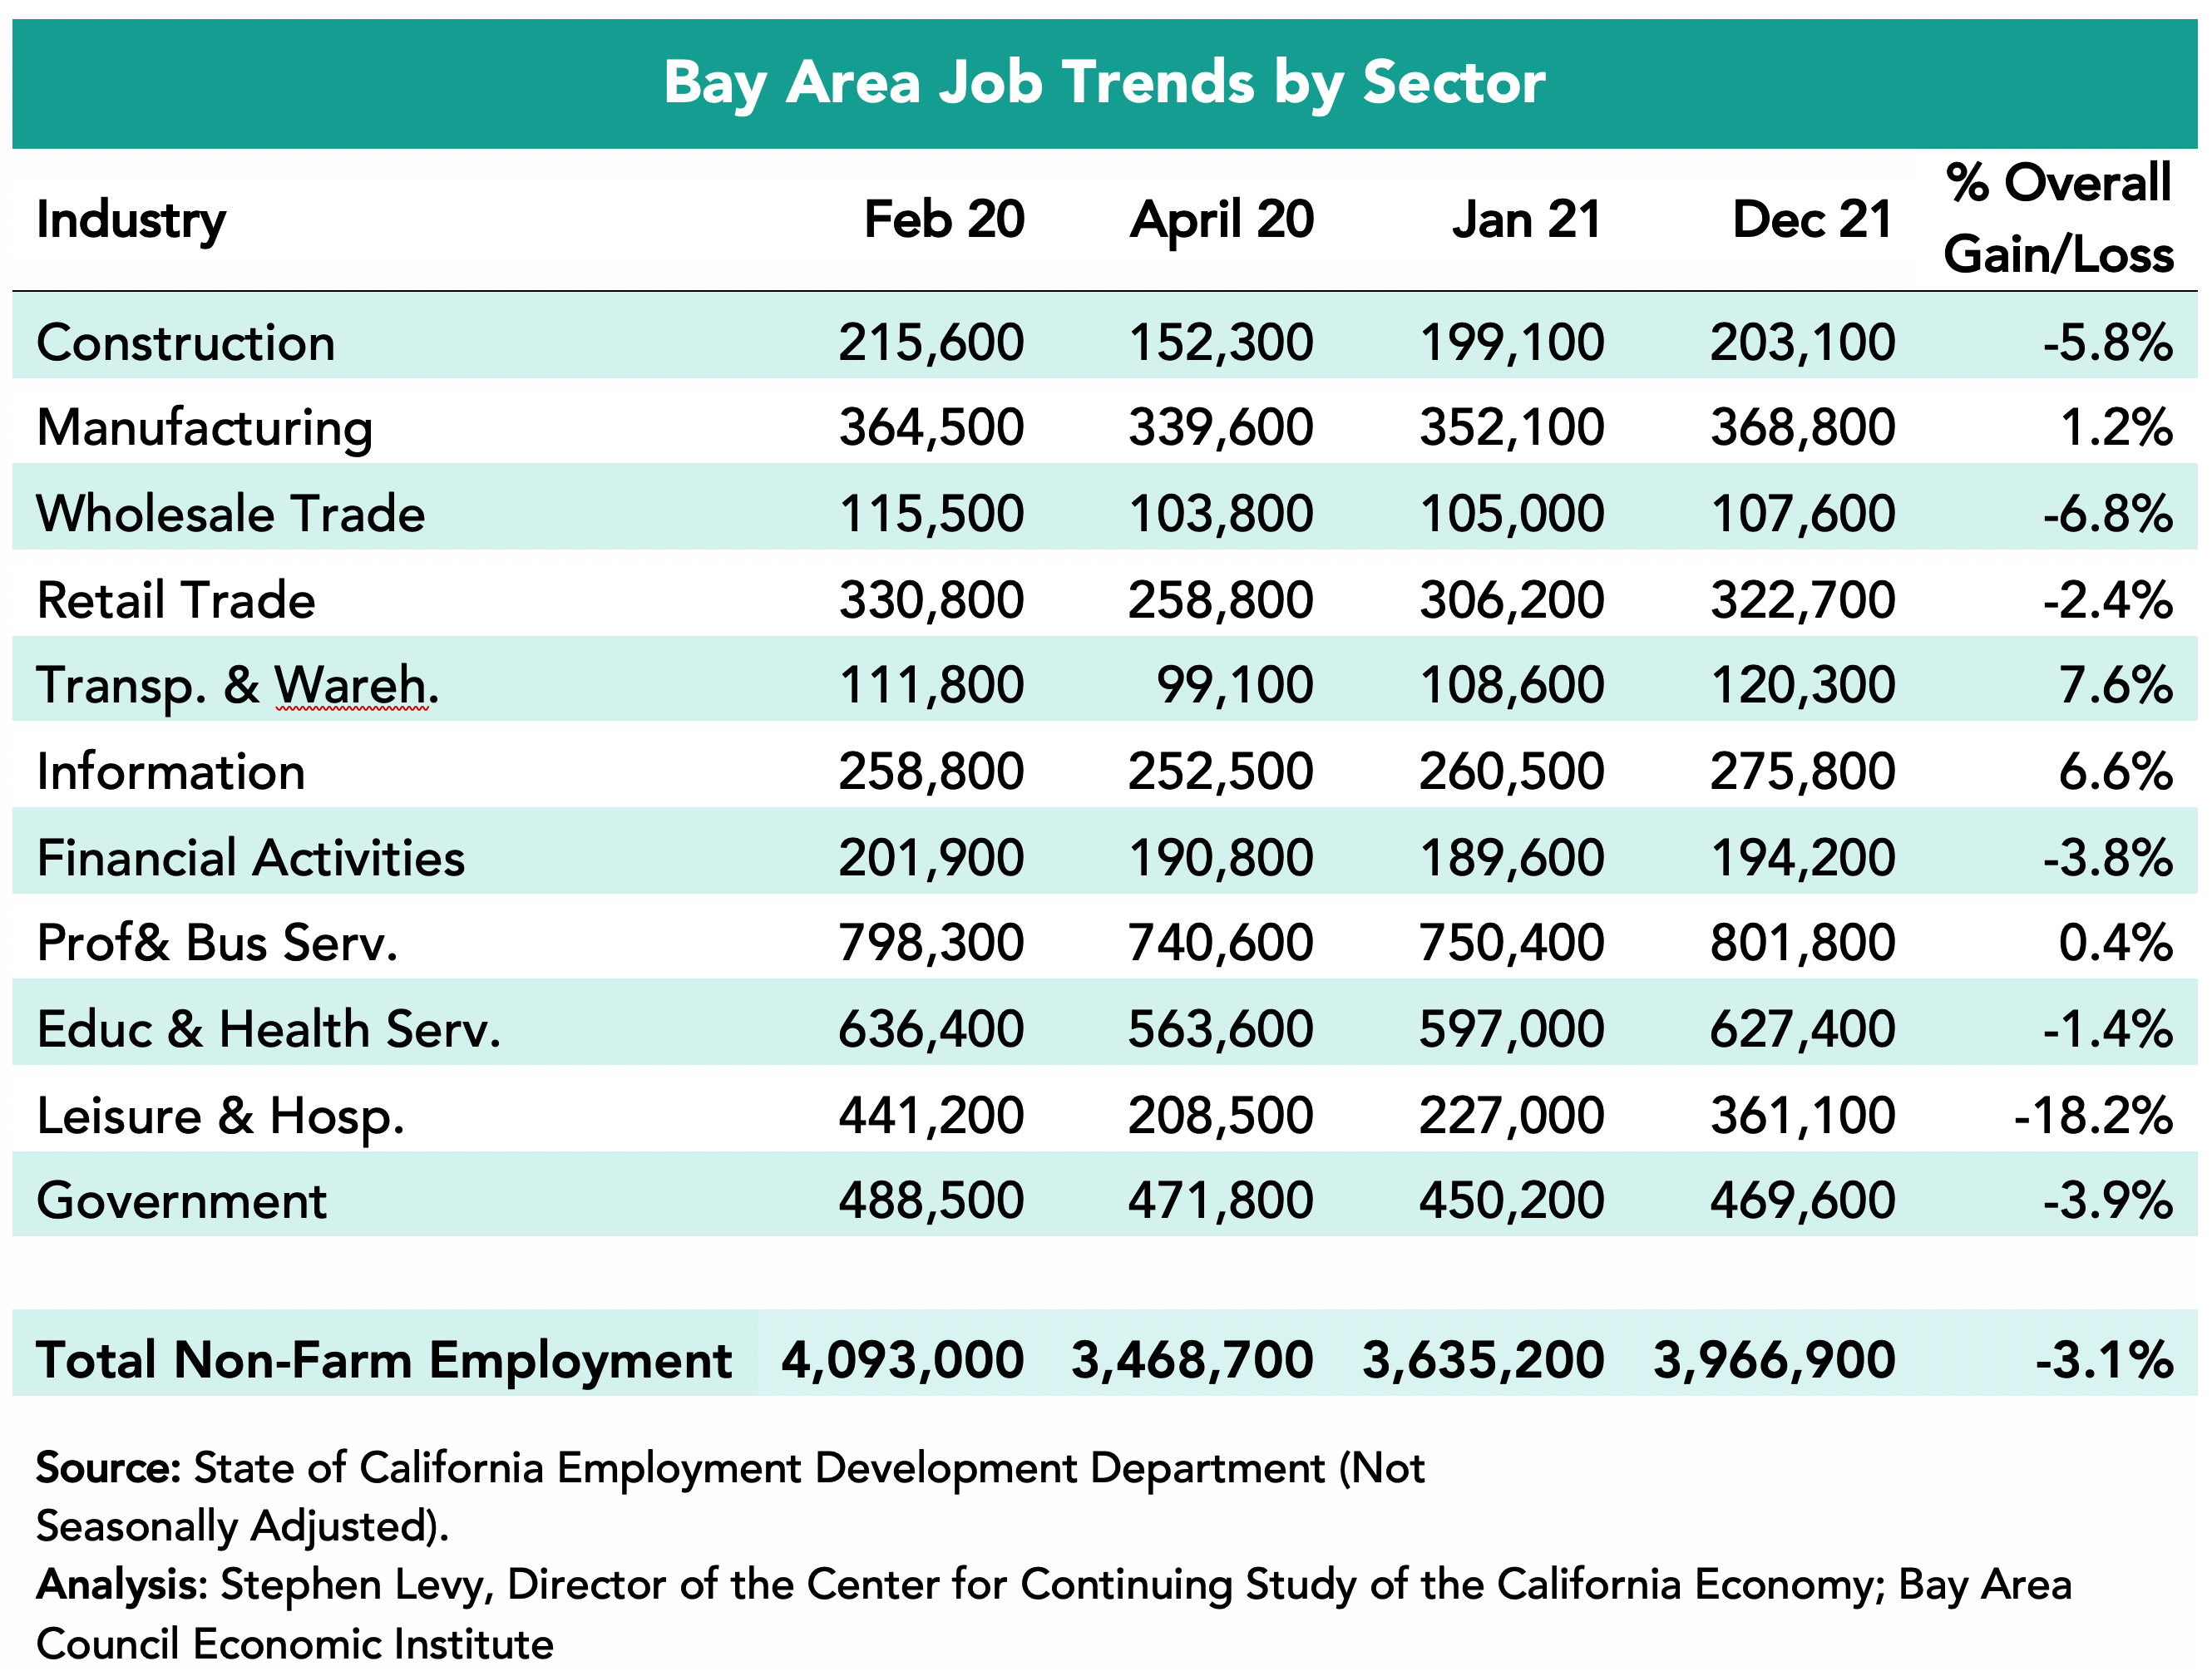
Industries Were Affected Differently
Four sectors—Manufacturing, Transportation and Warehousing, Information and Professional and Business Services—exceeded pre-pandemic job levels in December 2021. On the other hand, the Leisure and Hospitality sector recovered only 65.6% of lost jobs by December 2021 though travel and tourism are now picking up again. The Government sector still has fewer jobs now than in April 2020. The Construction and Education and Health Services sectors have recovered most of the jobs between February and April 2020.
Housing Permits Rebound to 2019 Levels in 2021
Housing permit levels are up 35.5% in 2021 over 2020 levels and equaled permit levels in 2019. This year all Bay Area cities are required to update their Housing Elements to meet greatly increased regional and local jurisdiction housing goals. Below is a link to a report released on March 18th that I prepared at the request of the Silicon Valley Community Foundation to help residents understand and engage in their city’s Housing Element update process. Although the report focuses on five Midpeninsula cities—Cupertino, Menlo Park, Mountain View, Palo Alto and Sunnyvale—it has broad applicability for other communities. The report is part of an engagement effort led by SV@Home with local partners.
These economic updates are authored by Stephen Levy, Director of the Center for Continuing Study of the California Economy, and a member of the Bay Area Council Economic Institute board.
March 21, 2022
In 2020, China began to crackdown on technology companies through regulations and politics. Now in 2022, China’s massive tech sector collectively and publicly fell in line with China’s government and the Communist Party’s leadership. In this article on Medium.com, by Sean Randolph, Senior Director of the Institute, details China’s regulatory focus and politics, along with the implications for overseas businesses and governments.
China is rapidly connecting Hong Kong, Macao and nine cities in Guangdong Province into a regional finance, technology, manufacturing and tourism hub of 86 million people. Over the next decade, this Greater Bay Area (GBA) will mature into a global showcase for China’s economic model, “One Country-Two Systems” integration, and Belt and Road development strategy.
GBA hopes to partner with comparable regions worldwide, including the San Francisco Bay Area, in areas such as clean energy, health care, mobility and fintech. On December 9. 2021, Bay Area Council Economic Institute Senior Director Sean Randolph participated in a webinar to discuss in-depth findings from a new Institute report in collaboration with the Hong Kong Trade Development Council which assesses the commercial opportunities and political obstacles amid U.S.-China tensions.
Bay Area job losses in 2020 were a larger percent than in the state and nation. But in 2021 Bay Area and state job growth has outpaced the nation accompanied by large declines in unemployment. At the same time VC funding has reached record levels, housing permits have begun to rebound, the Governor signed several housing bills and the region is a leader in vaccinations and lowering COVID cases. Congress passed an infrastructure bill and international travel restrictions have been eased. The Bay Area still faces challenges in housing, transportation and other areas that affect our economic competitiveness and, in doing so, reduce our ability to meet equity and environmental goals.
The highlights:
• The Bay Area added 188,900 jobs between January and November 2021 (+5.2%) outpacing U.S. gains (4.1%) for this period. The regional unemployment rate fell from 6.6% to 3.8%. Job gains were led by the San Francisco and San Jose metro areas
• The U.S. economy is recovering even as inflation and supply chain challenges remain and COVID cases are rising again. At the same time immigration and tourism are on pace to increase and some infrastructure spending could start next year.
• The region is a state and national leader in vaccinations and reducing COVID cases that is allowing a return to more normal living here.
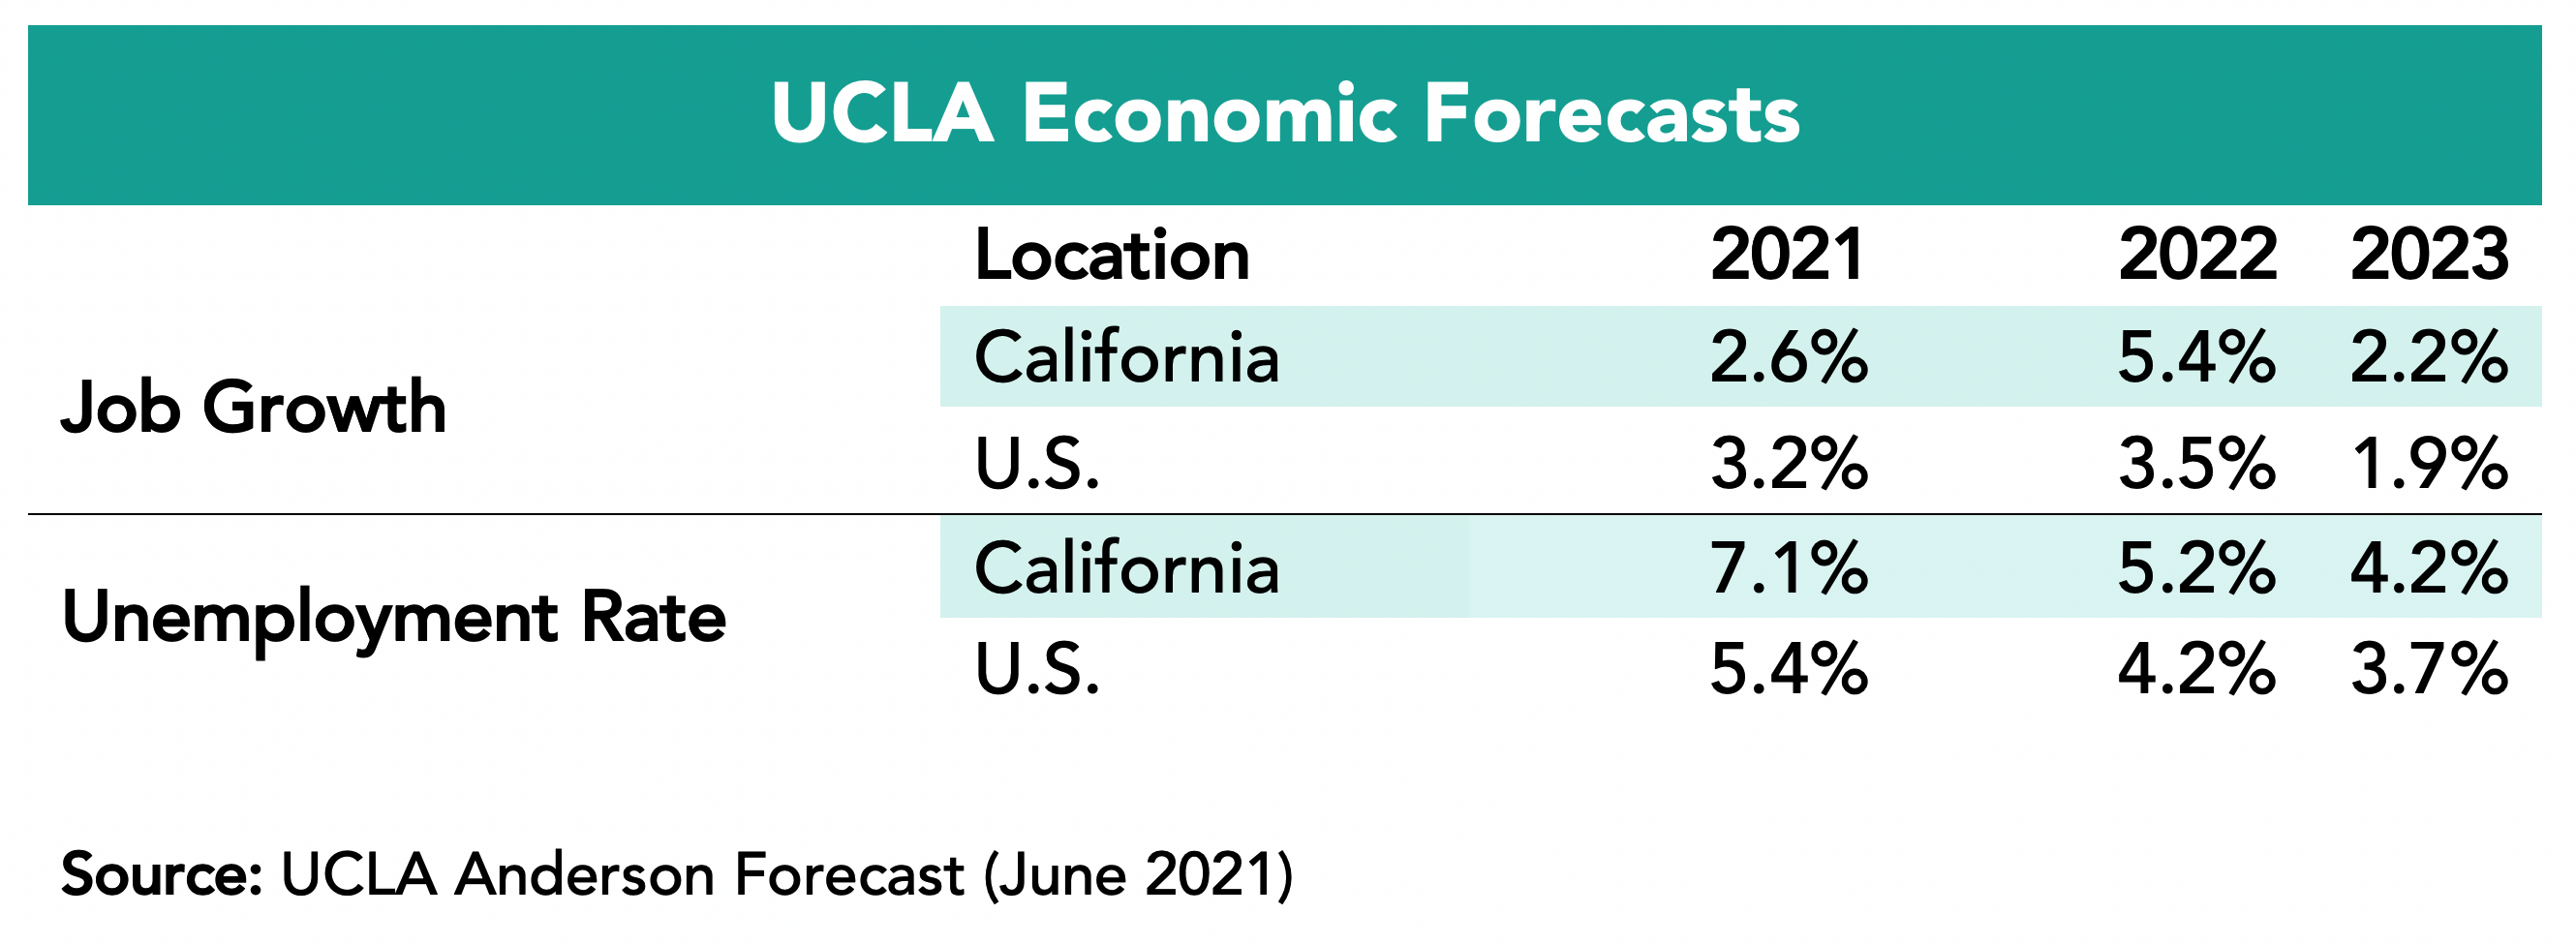
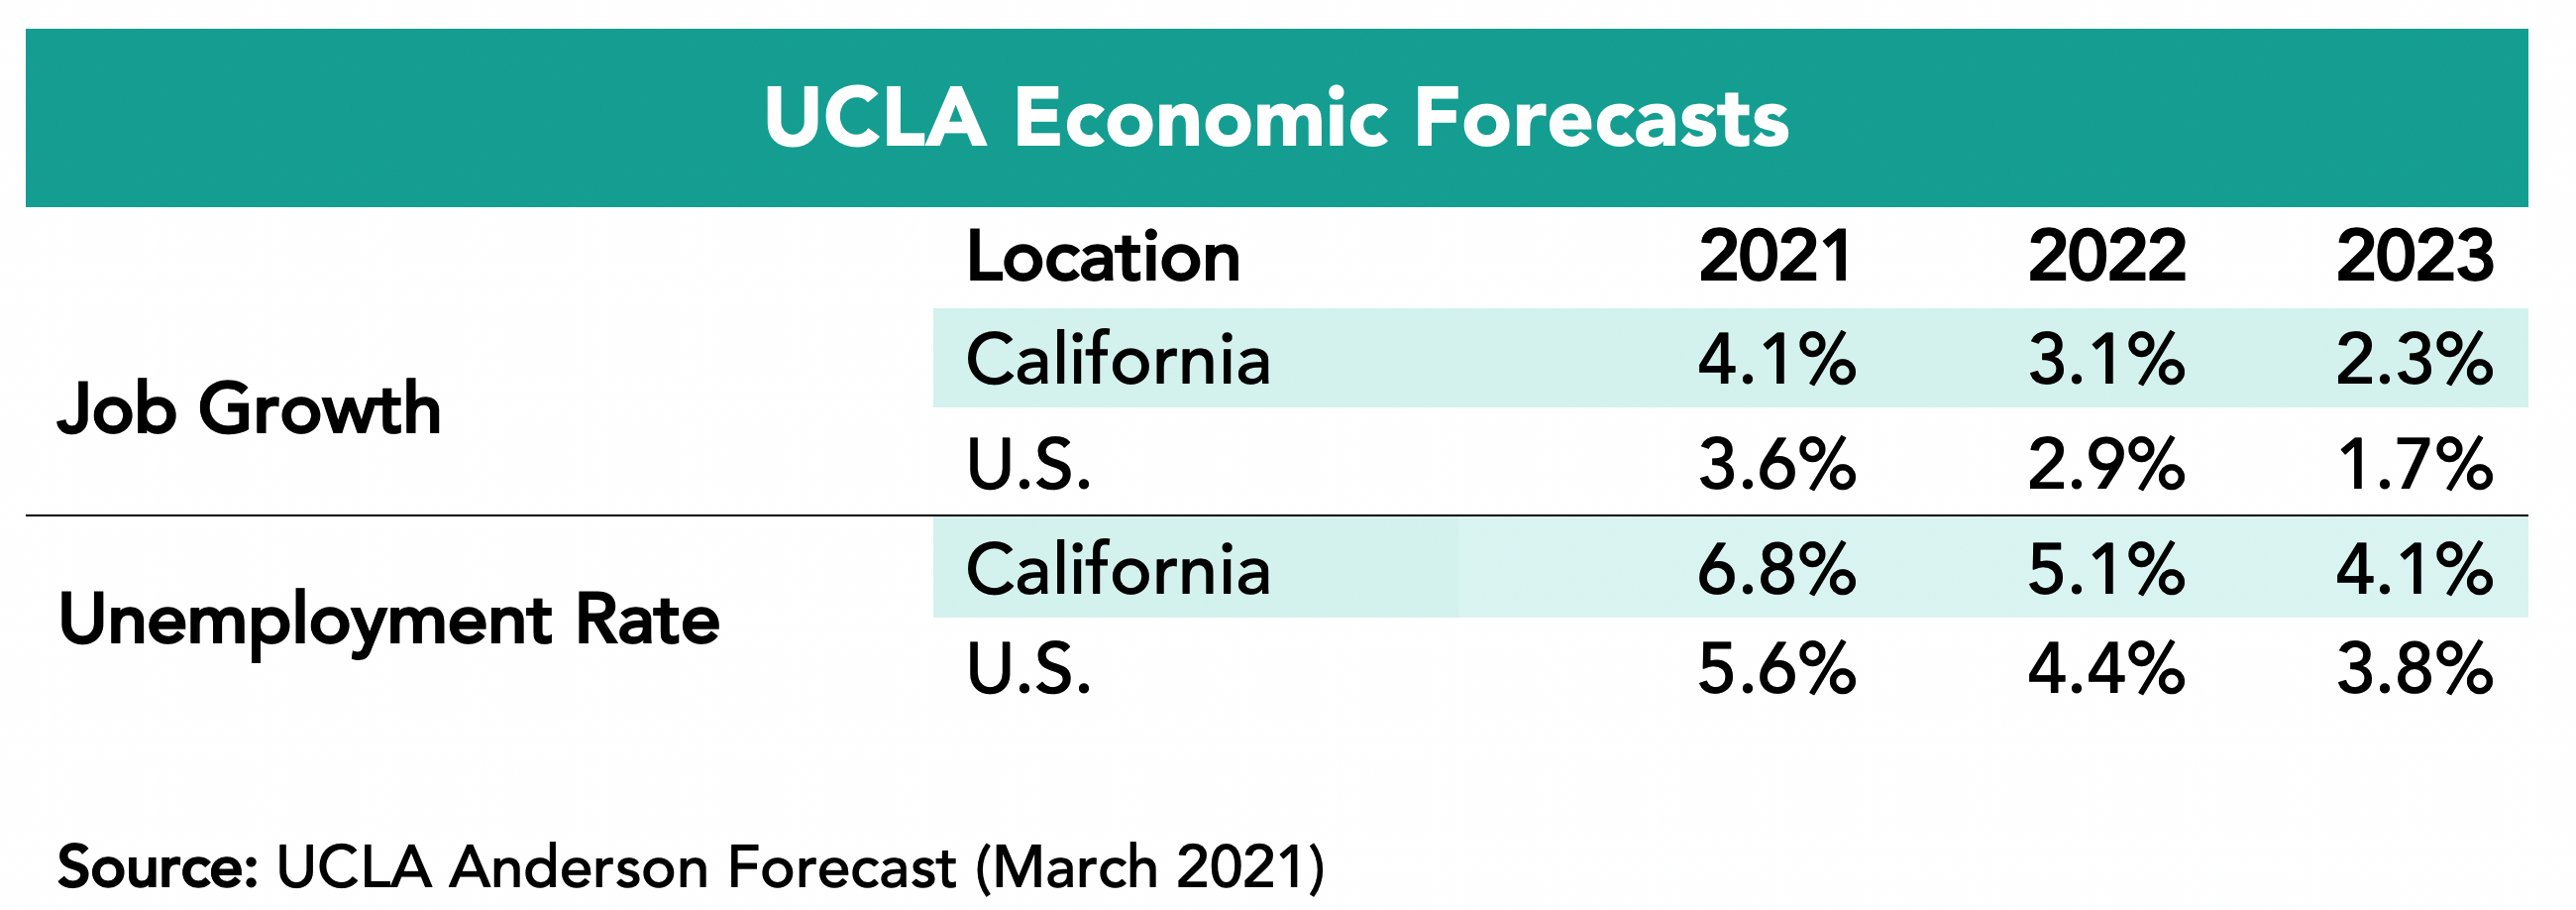
• The UCLA December 2021 forecast has the Bay Area and state outpacing the nation in job growth in 2022 and 2023.
Job Growth Continues But 2020 Losses Constrain the Rate of Recovery
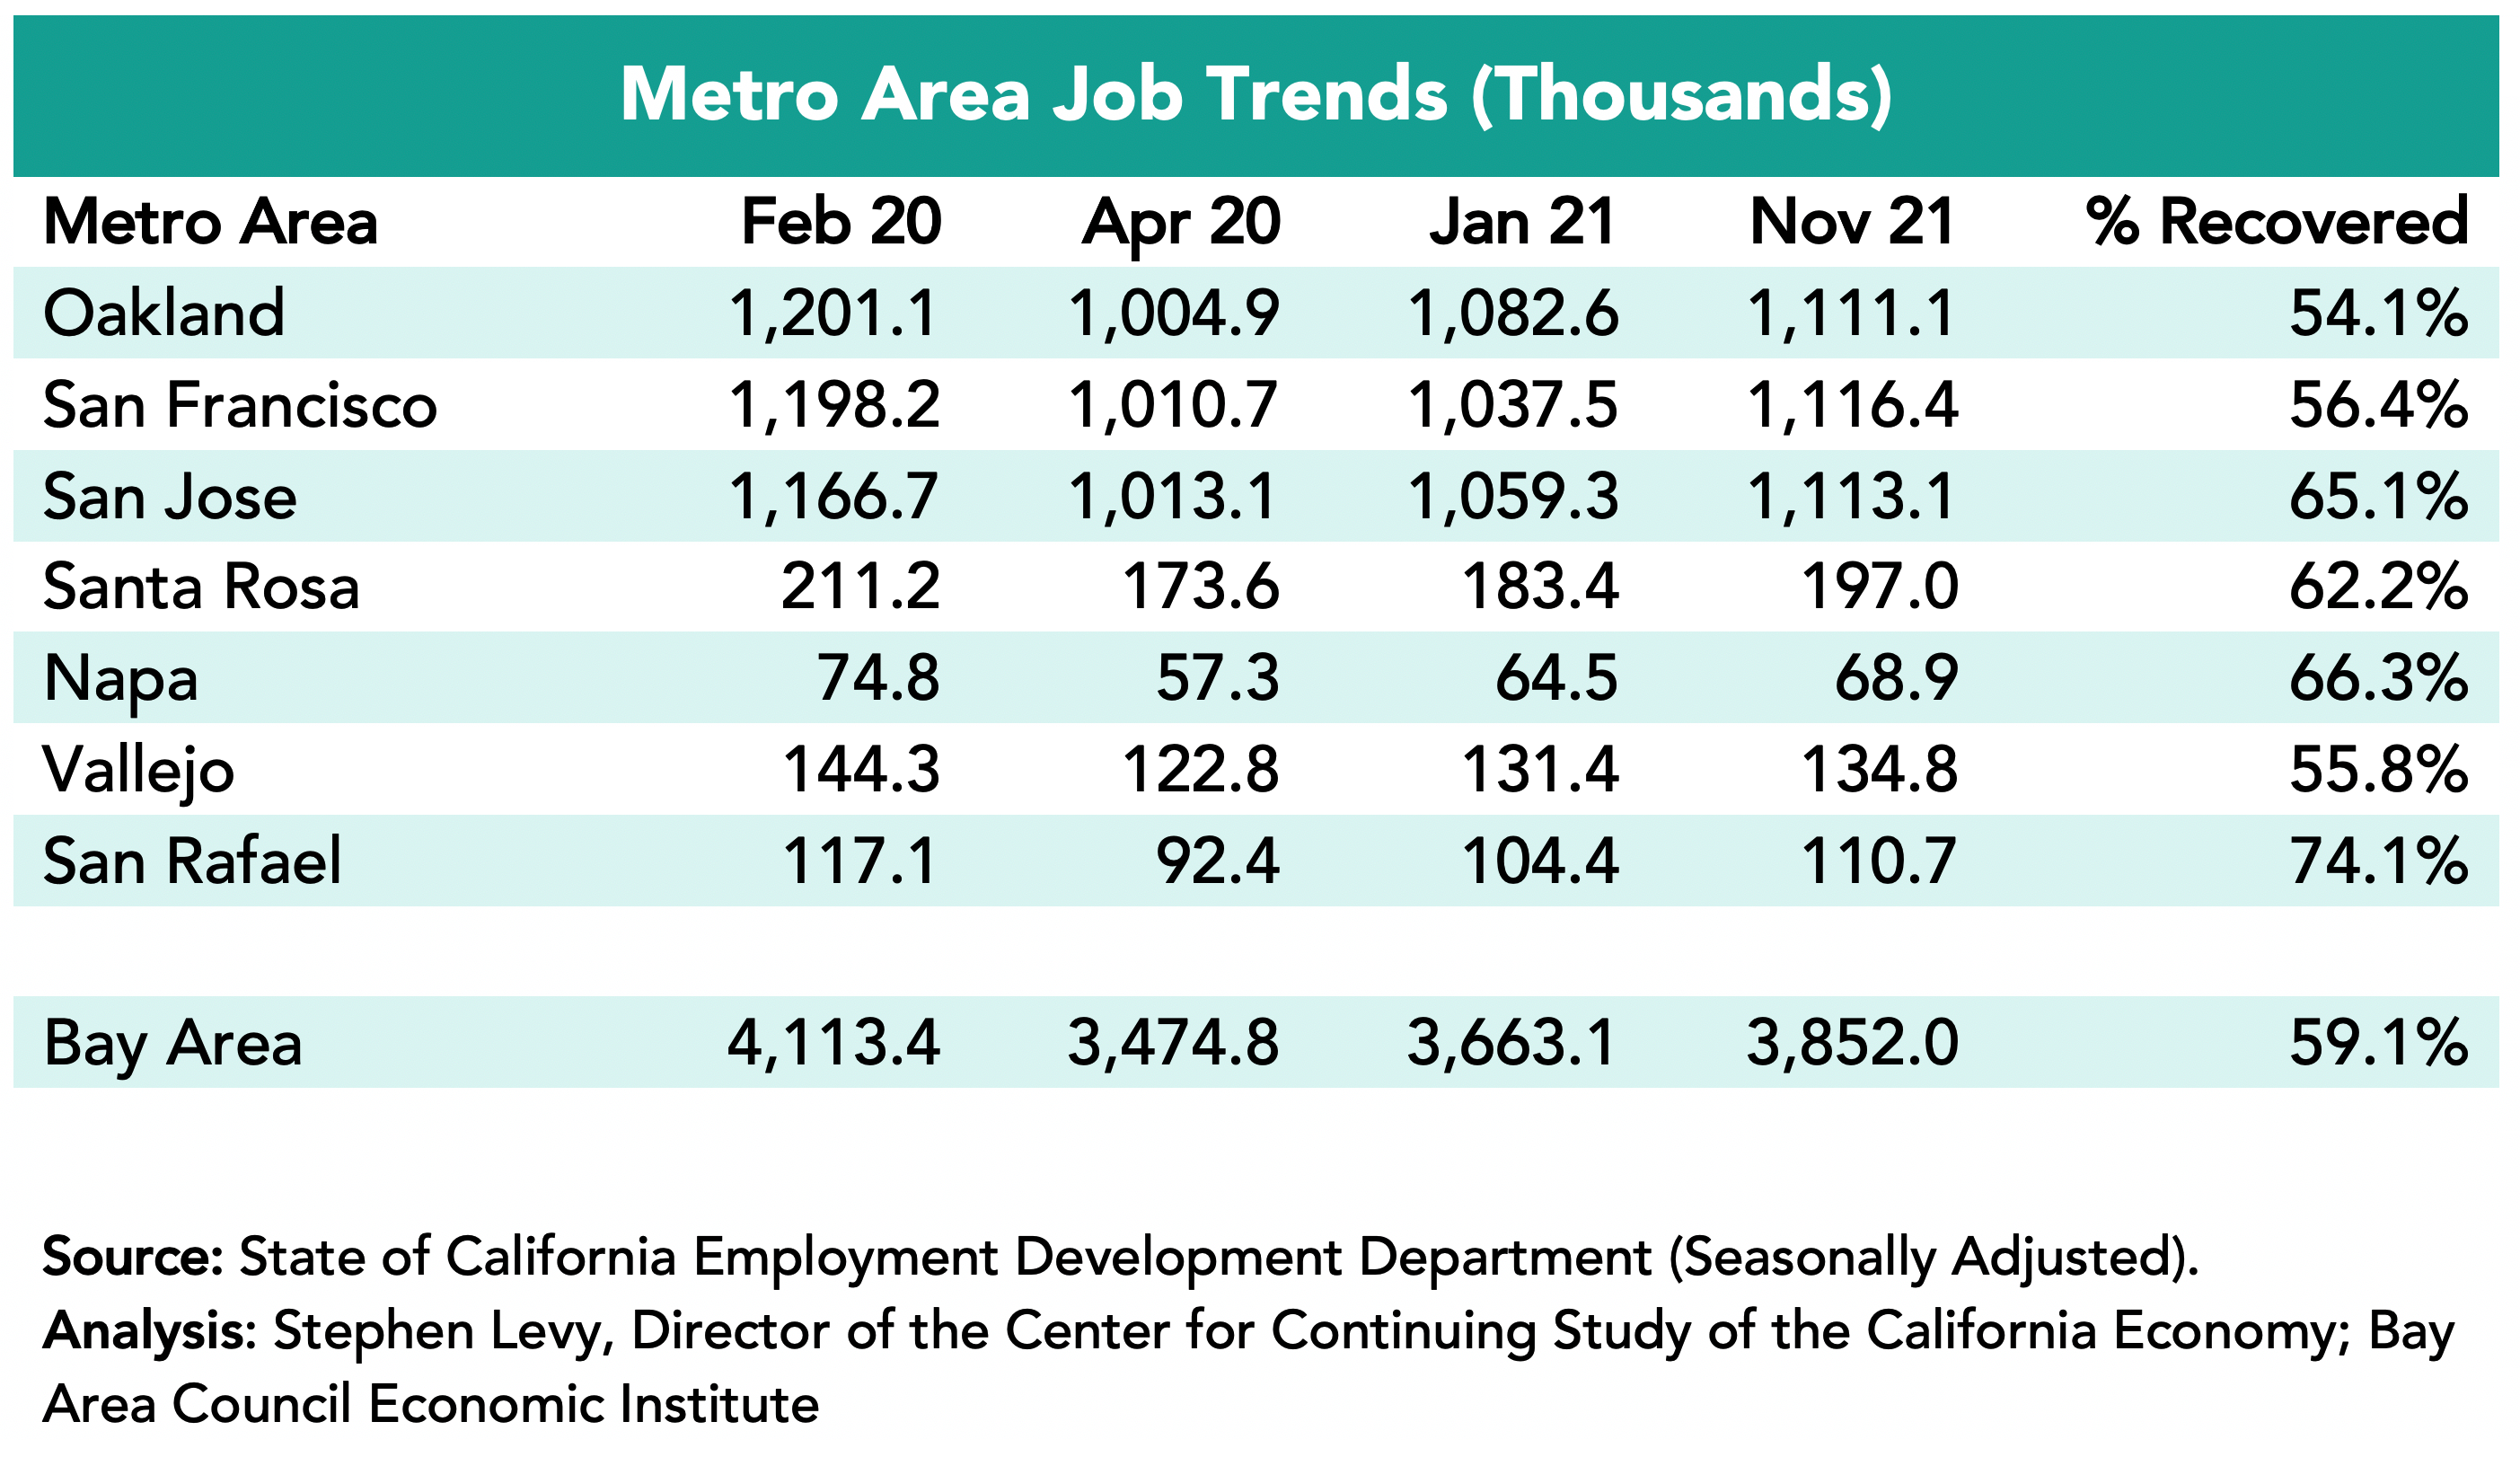
The Bay Area added 188,900 jobs since January 2021 led by a gain of 78,900 in the San Francisco metro area though SF has recovered just 56.4% of the jobs lost between February and April 2020. The San Jose metro area added 53,800 jobs but by November had recovered 65.1% of the jobs lost between February and April 2020. The San Jose, Napa, and San Rafael metro areas had the largest % job recovery by November 2021.
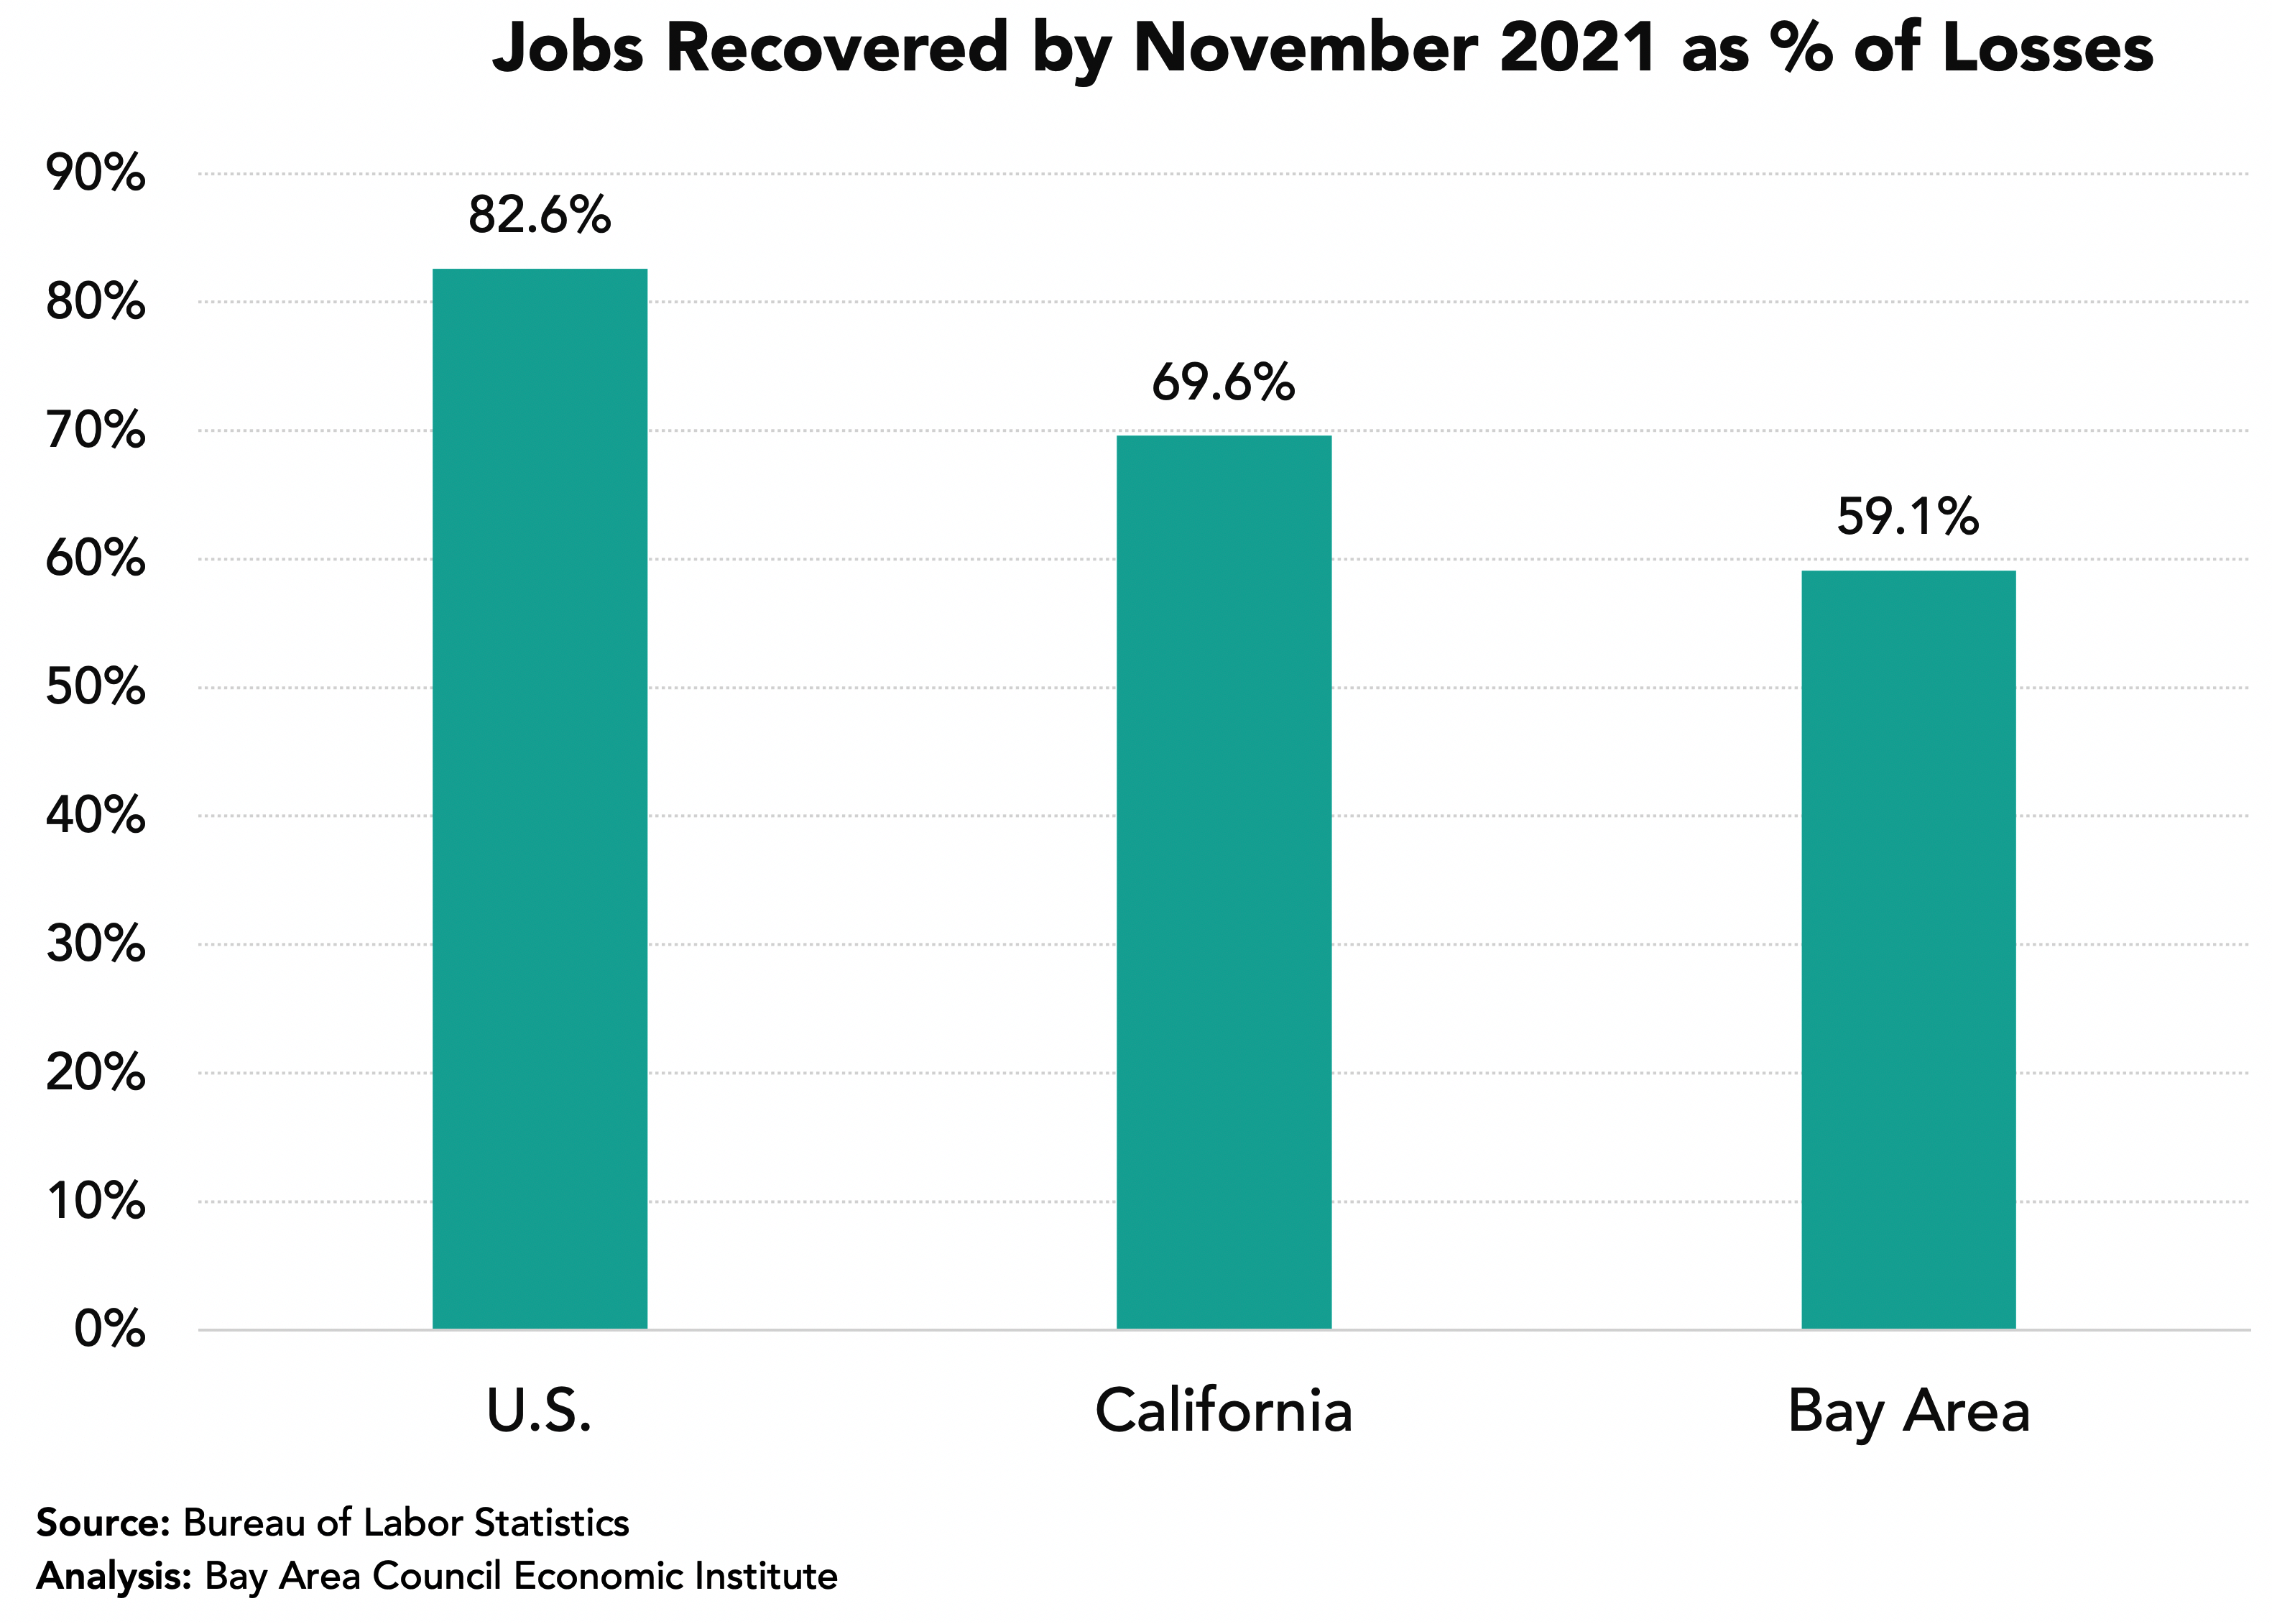
The Bay Area Had Recovered Just 59.1% of Lost Jobs by November 2021 Yet VC Funding is Surging and Tech Jobs Are Above Pre-Pandemic Levels
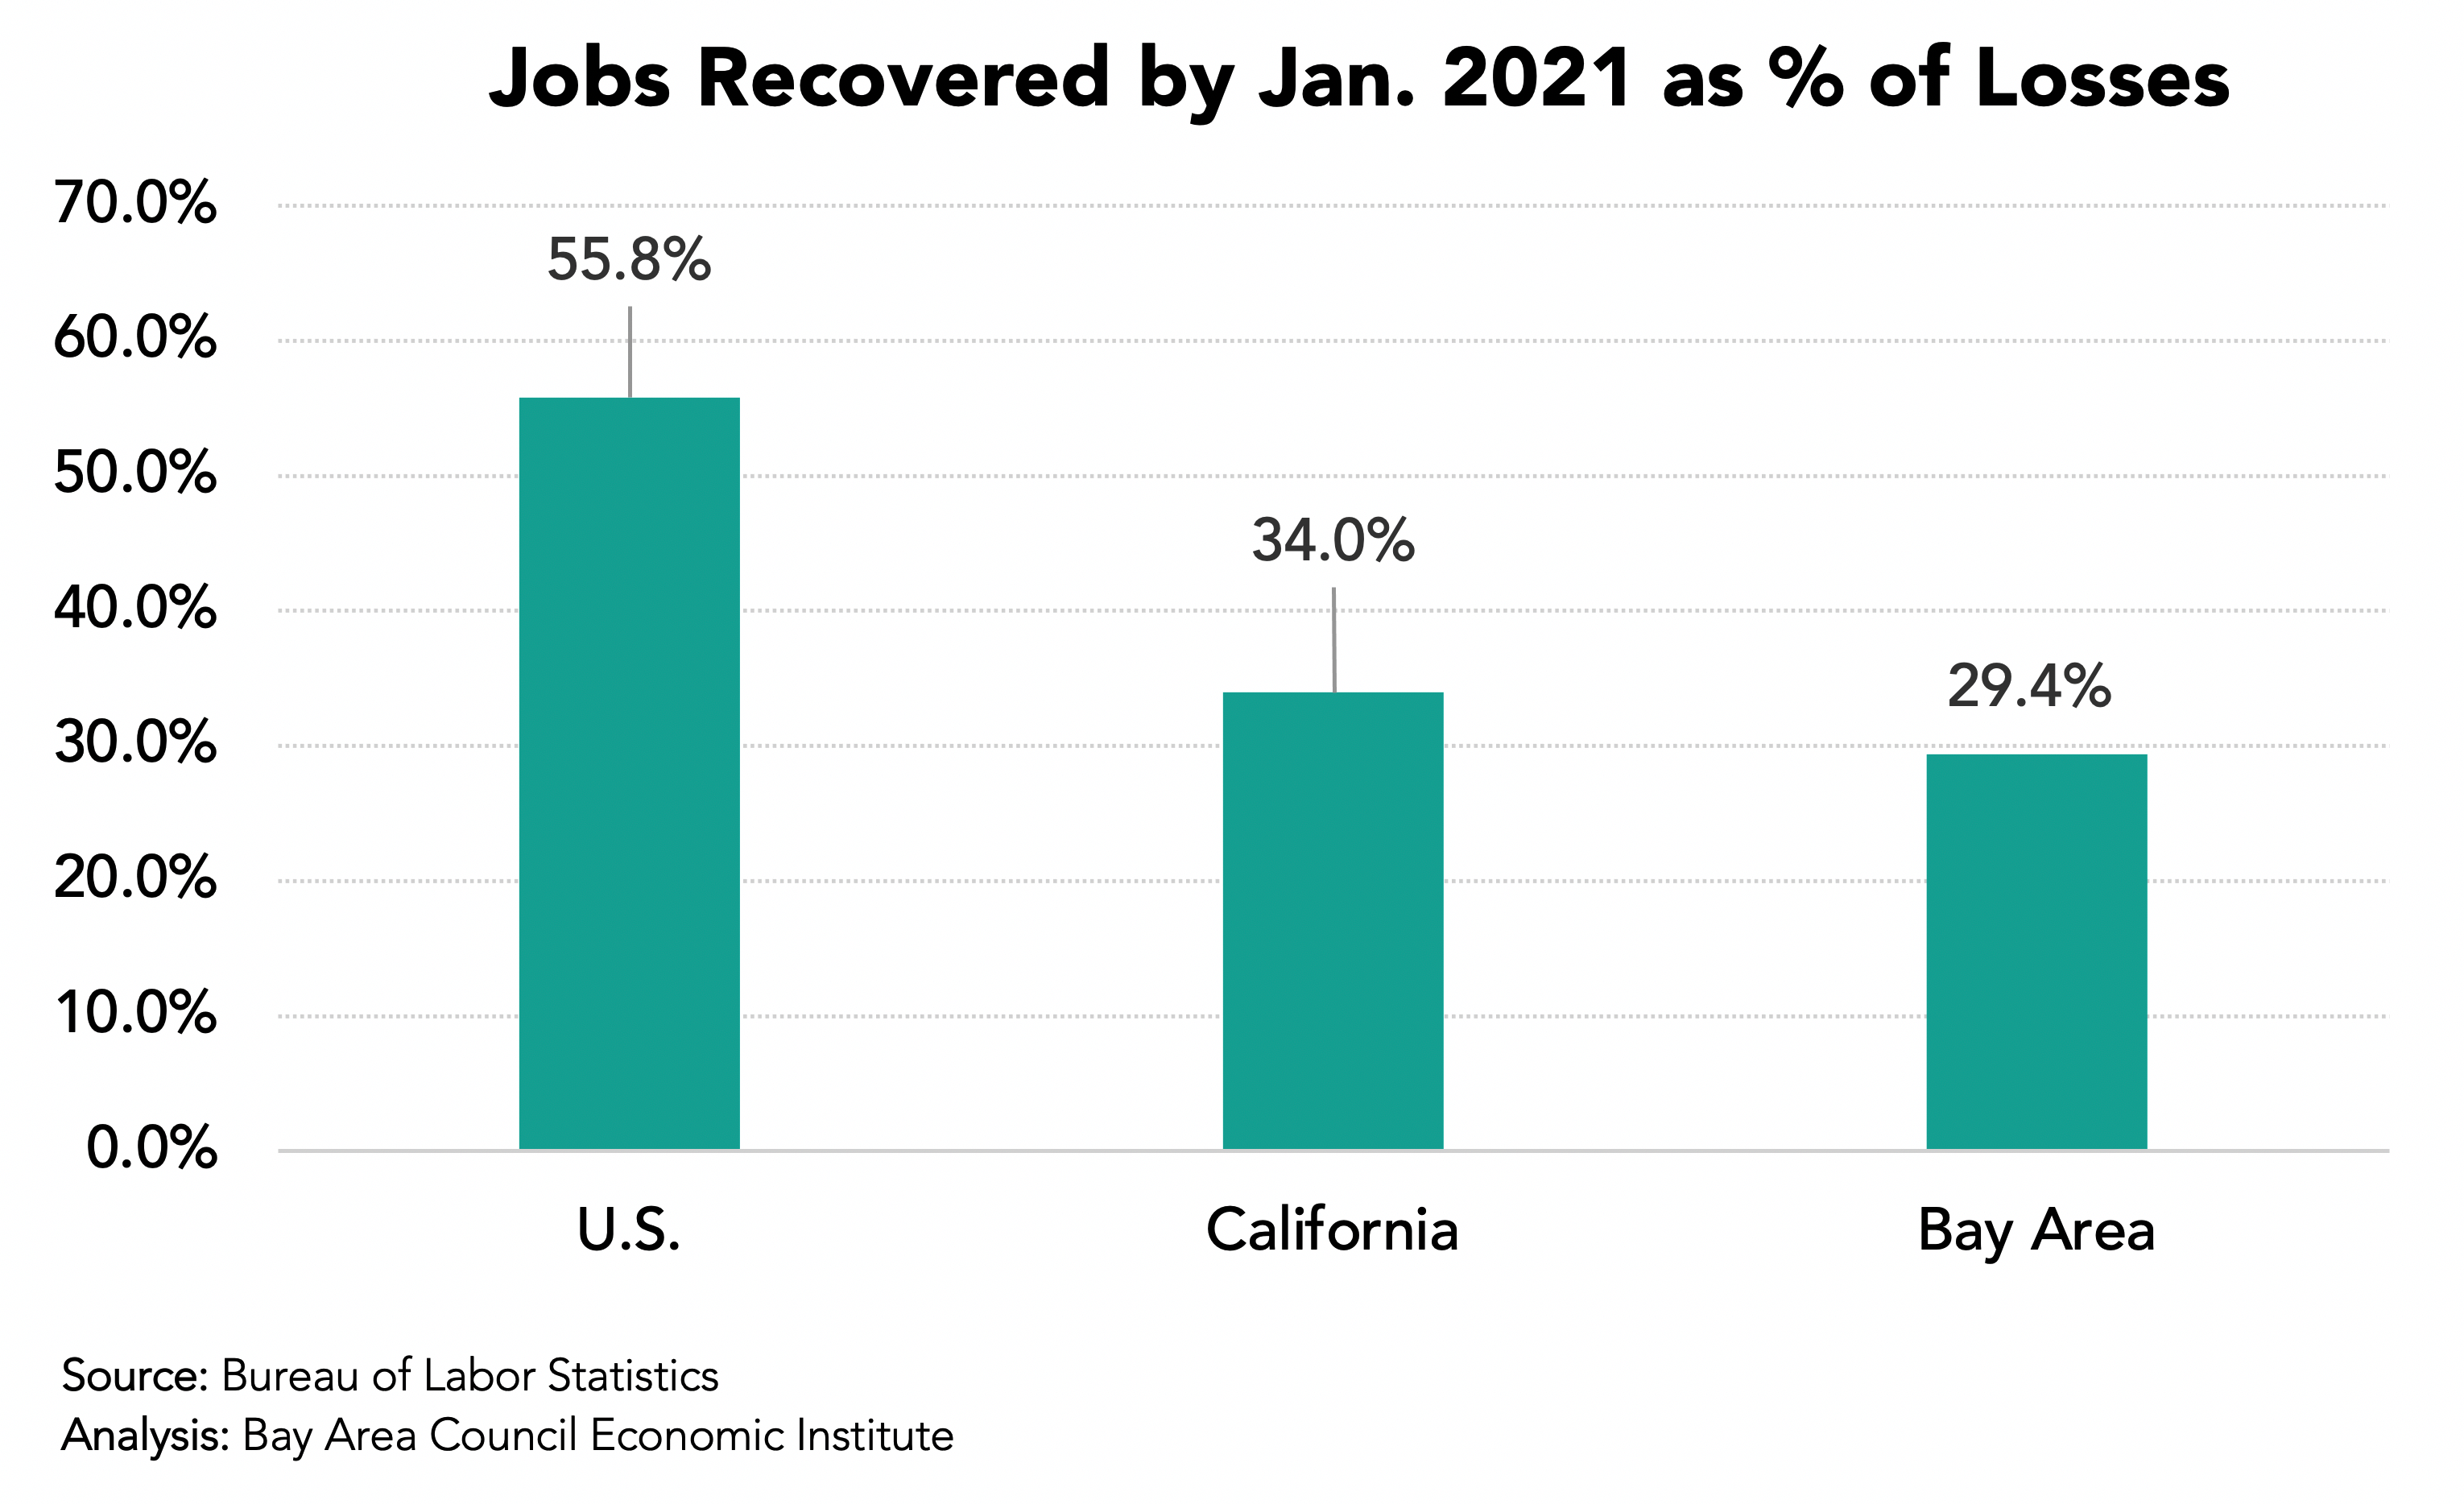
In November 2021 the Bay Area had recovered 59.1% of the jobs lost between February and April 2020 up from 29.4% in January. The state had recovered 69.6% up from 34.0% while the nation had recovered 82.2% of lost jobs up from 55.4%. At the same time VC funding in the first three quarters of 2021 was the highest on record. The Bay Area lagged the nation in 2020 job performance but has outpaced the nation in job growth so far in 2021 (5.2% versus 4.1%).
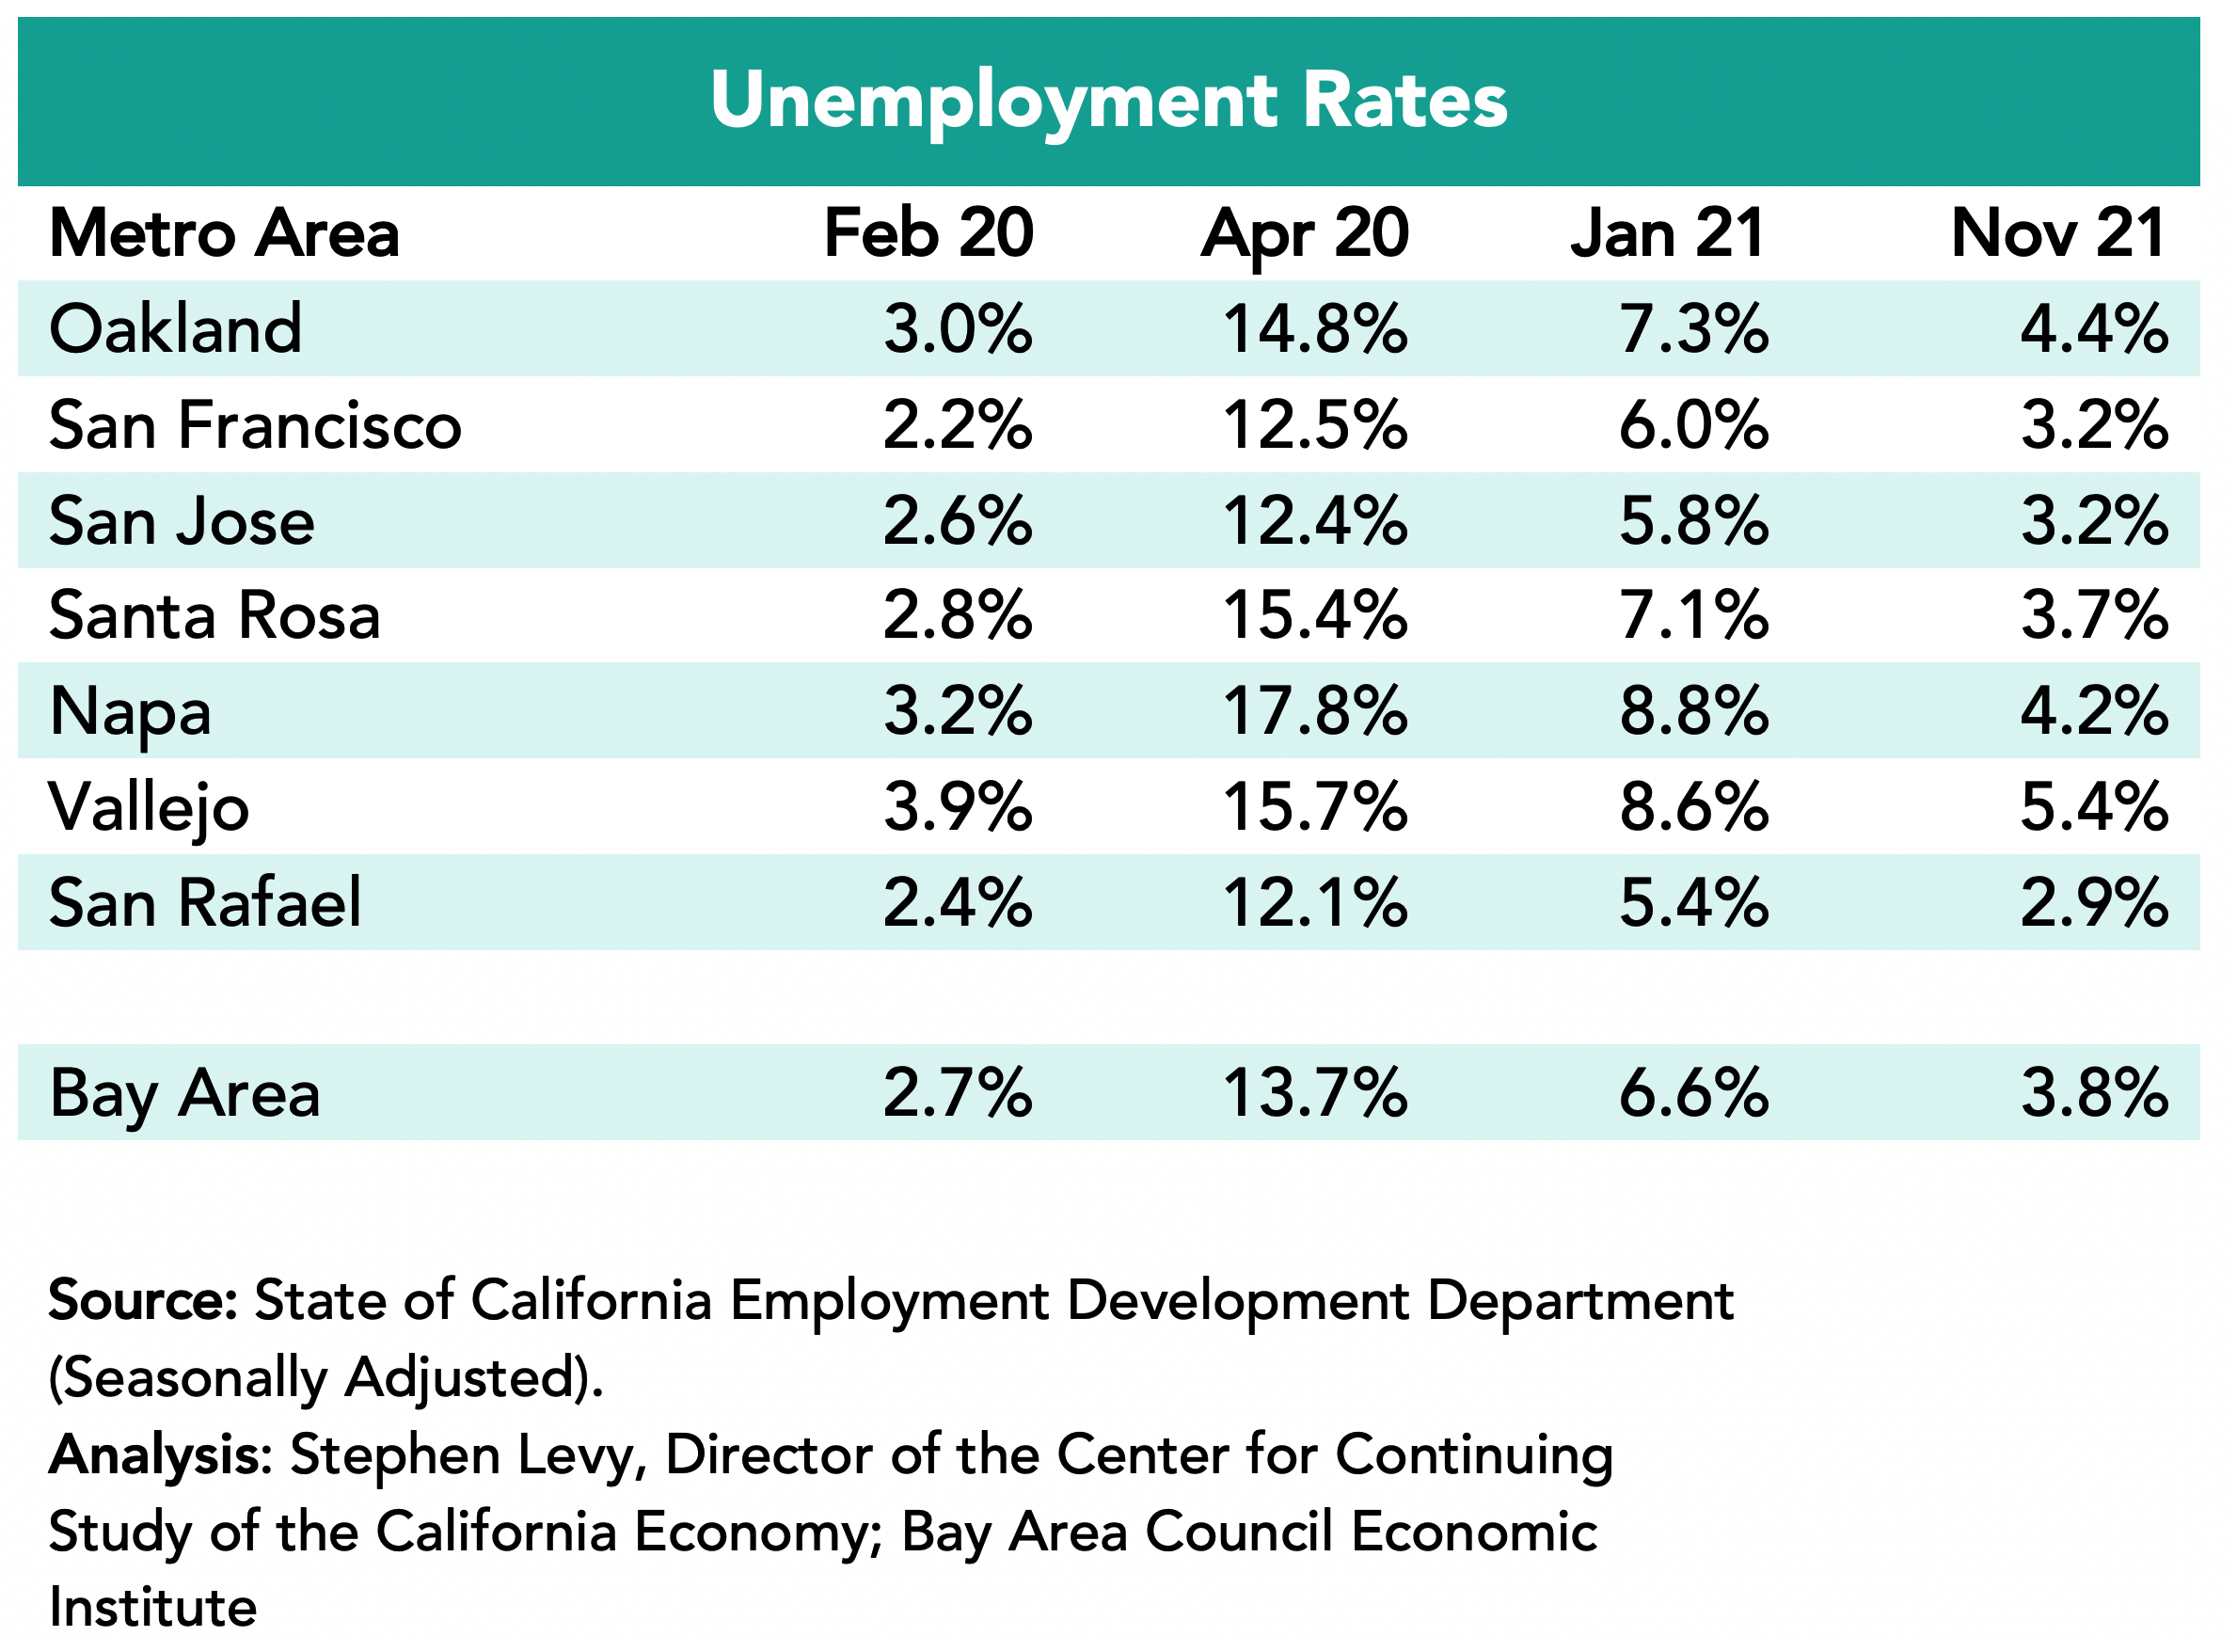
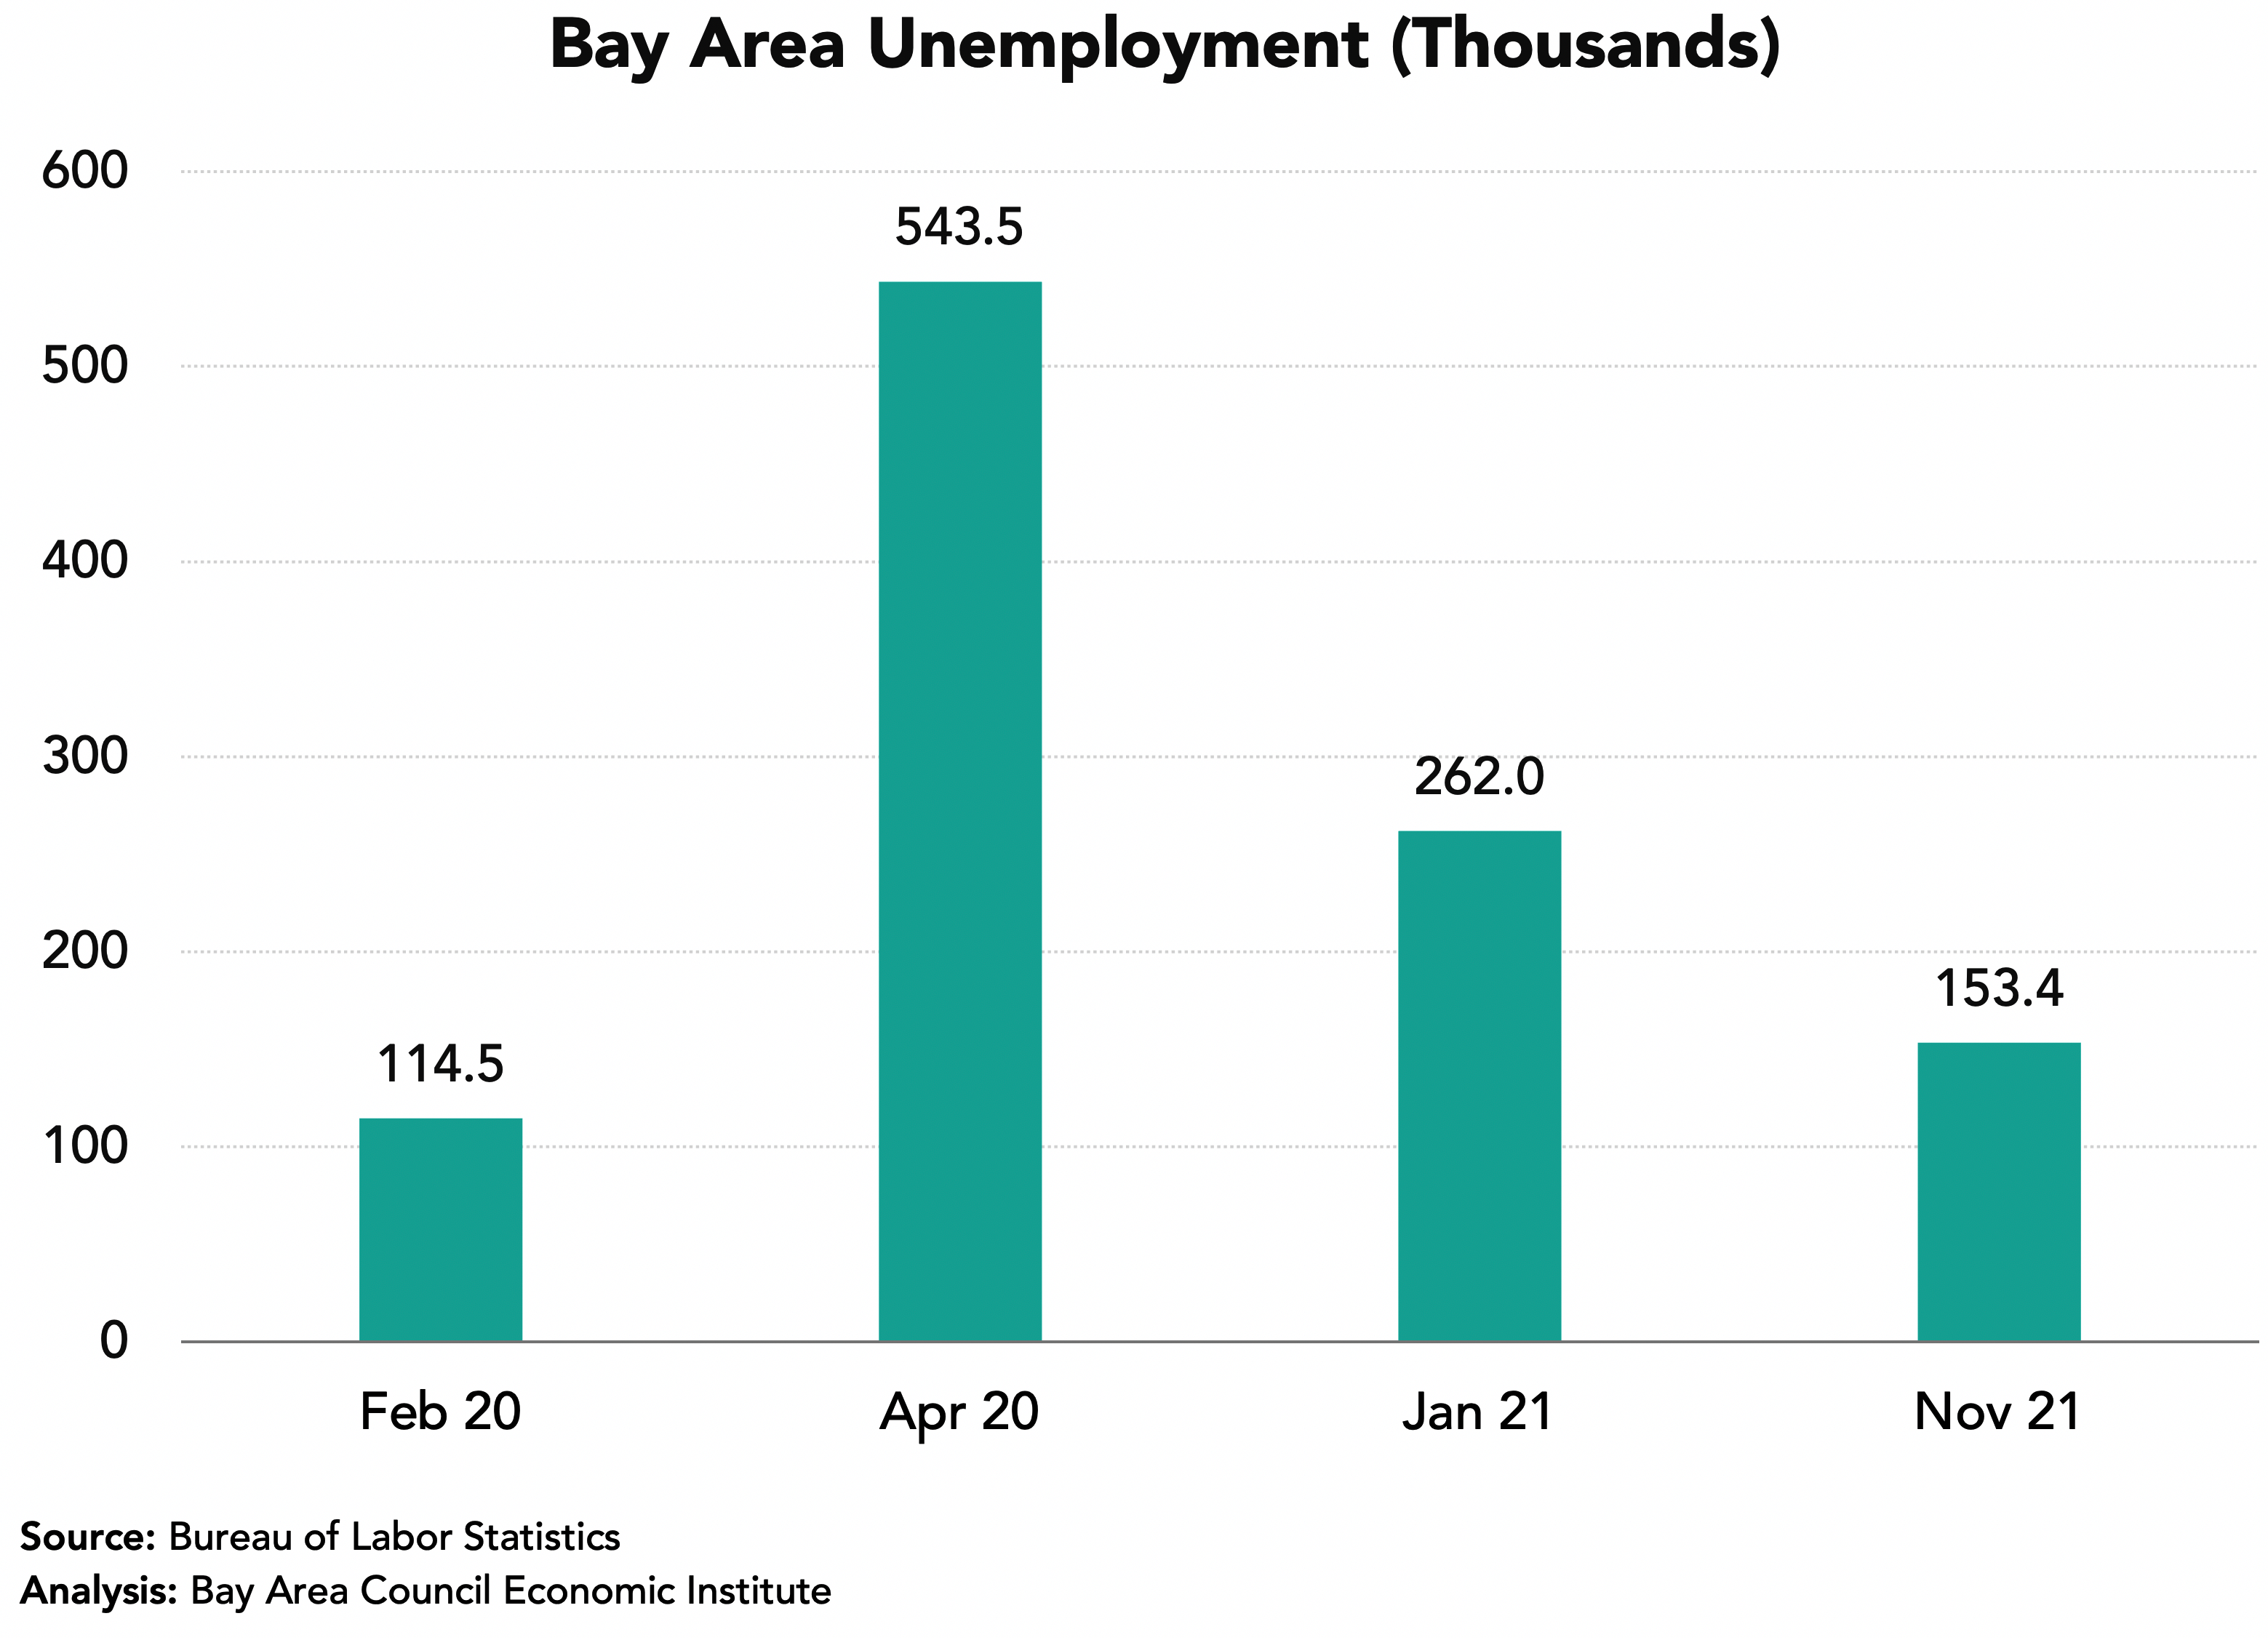
Unemployment Rates Fell to 3.8% in the Region in November 2021 from 6.6% in January 2021
The lowest rates were in the San Rafael metro area (2.9%) followed by the San Francisco and San Jose metro areas (3.2%) in November 2021.
The number of unemployed residents has fallen sharply from the April 2020 high and from January 2021.
Industries Were Affected Differently
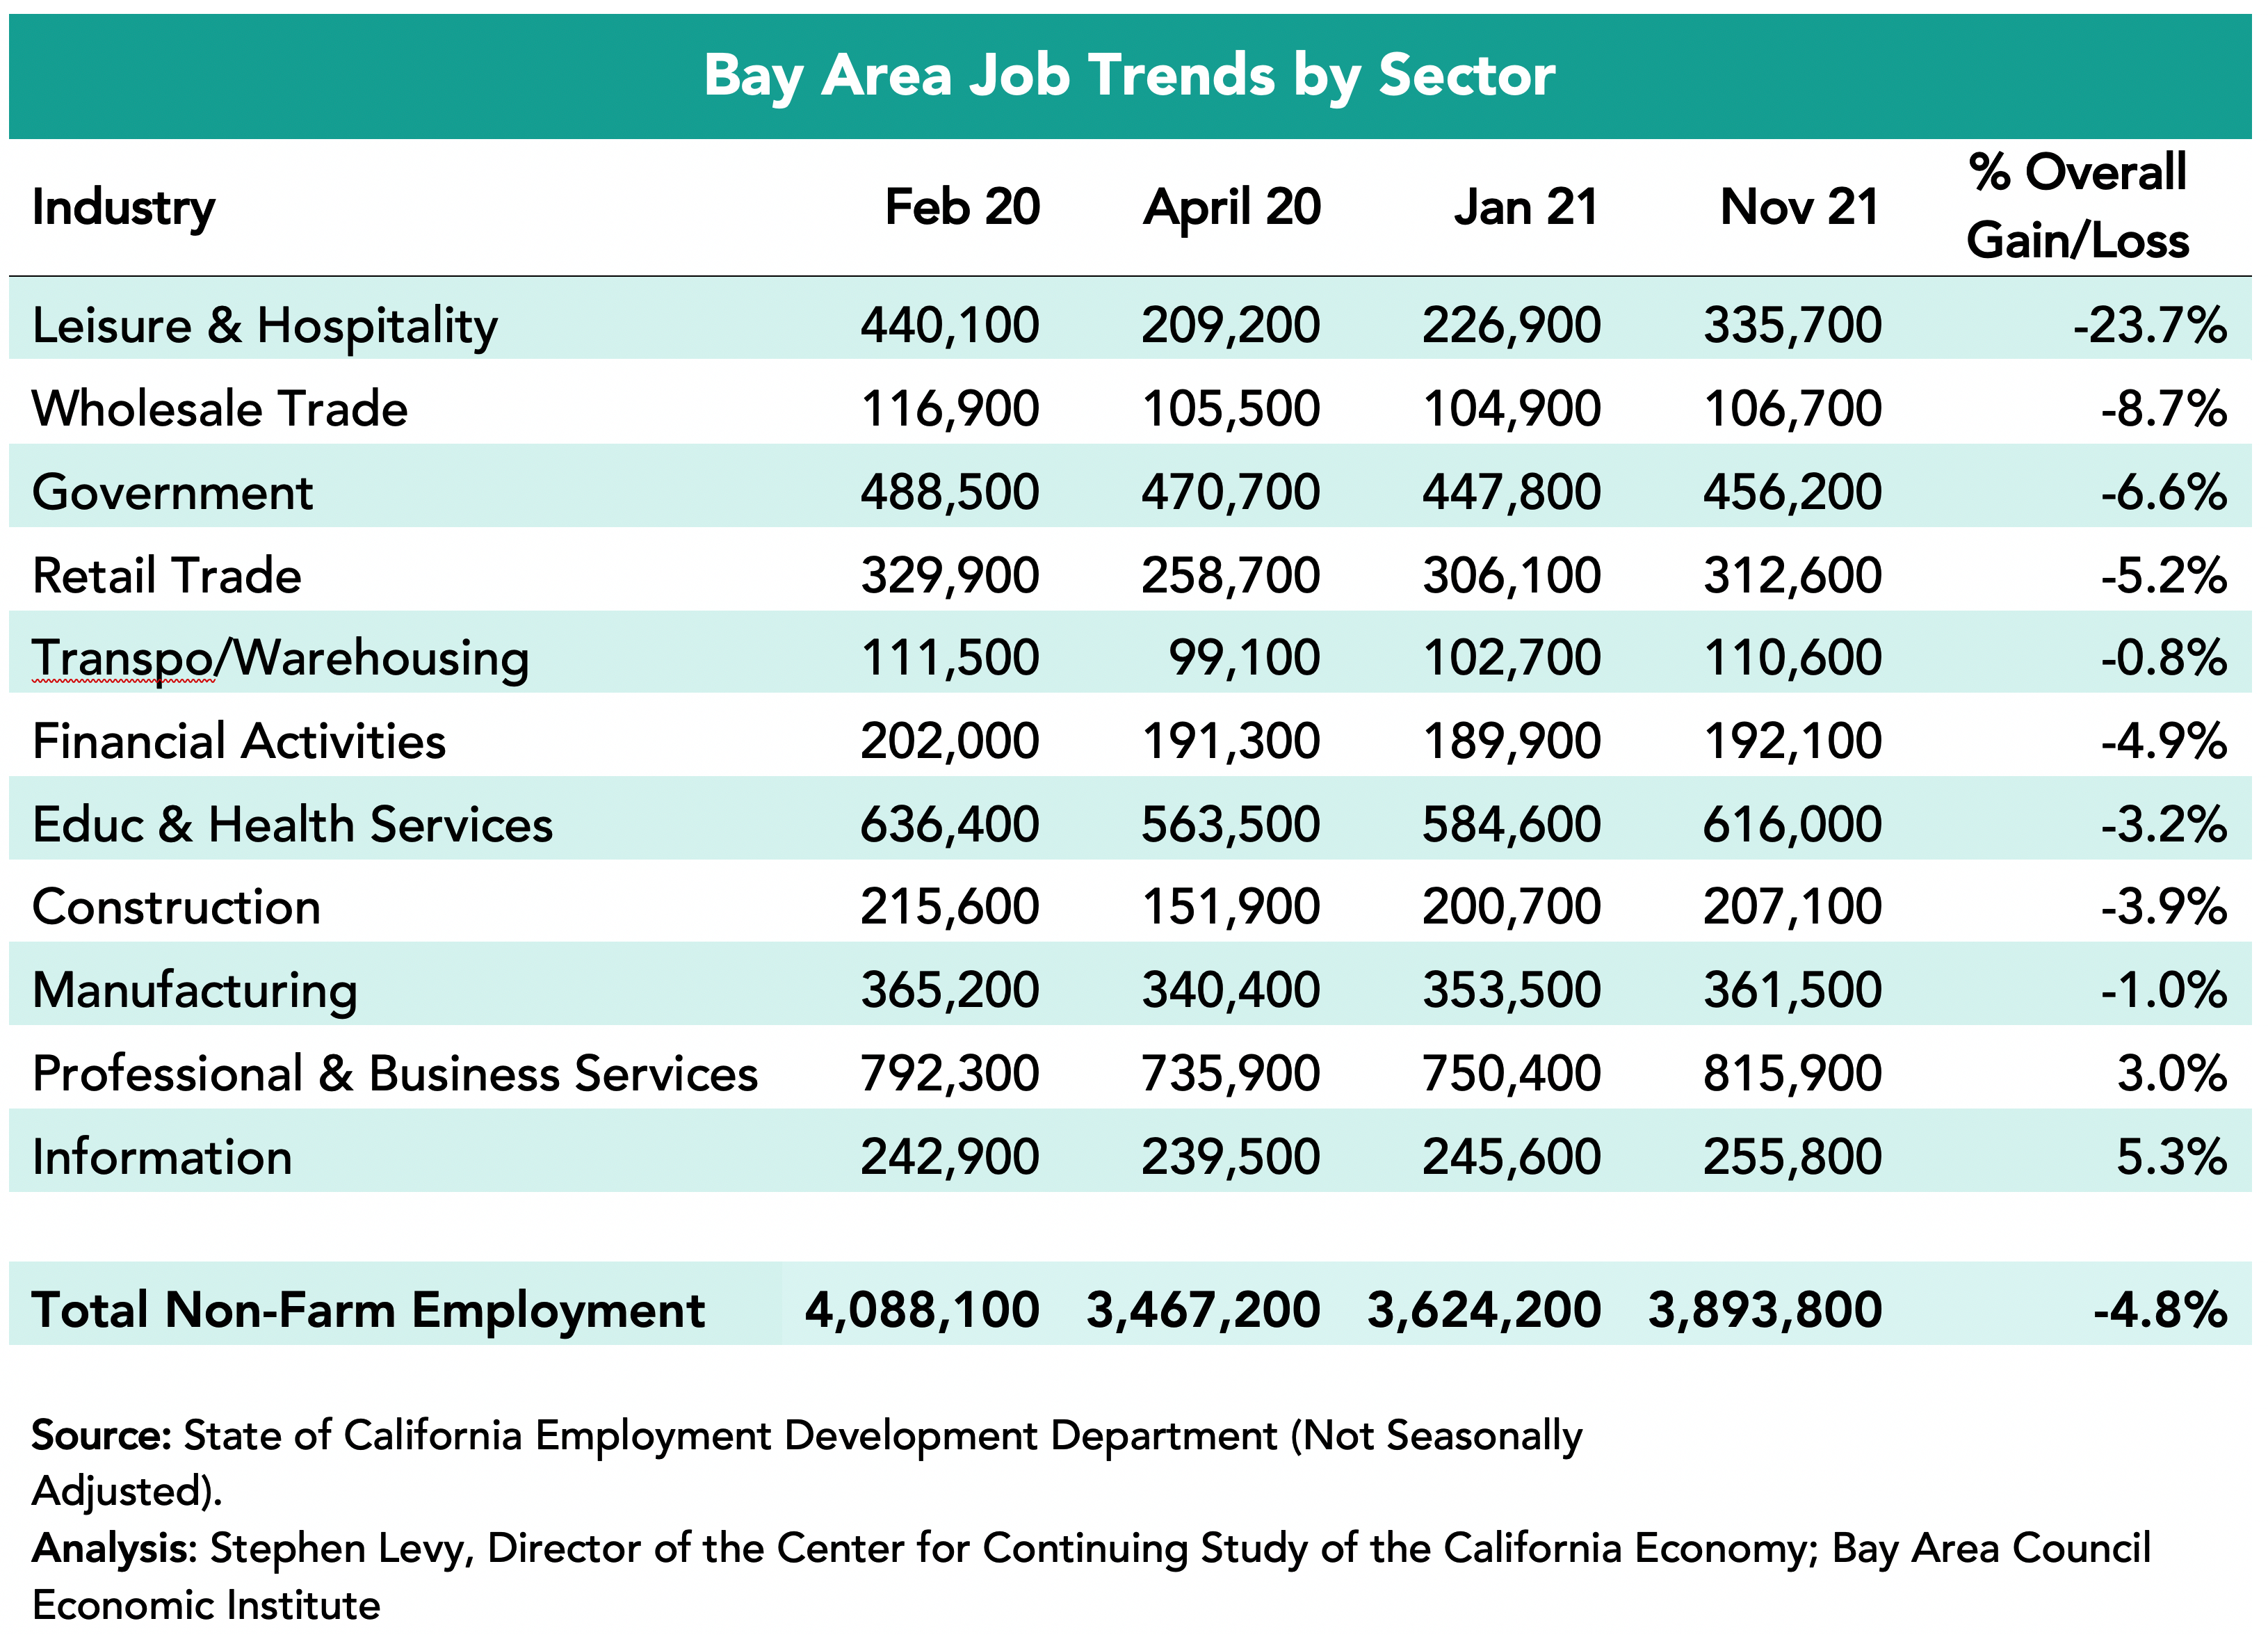
The Information sector added jobs in comparison to before the pandemic hit. And the Professional & Business Services sector is also above pre-pandemic job levels. On the other hand, the Leisure and Hospitality sector recovered only 54.8% of lost jobs by November 2021 though travel and tourism are now picking up again. The Government sector has fewer jobs now than in April 2020 though many jobs are returning as schools and colleges reopen. The Construction and Manufacturing sectors have recovered most of the jobs between February and April 2020.
Housing Permits Up Over 2020 Levels, Trail 2019 Slightly
Housing permit levels are up over 2020 in the first ten months of 2021 but still slightly trail 2019 comparable months. But recently many new developments have been approved or proposed in places like Oakland and San Jose and in other cities as well as new developments being proposed.
Bay Area COVID Stats
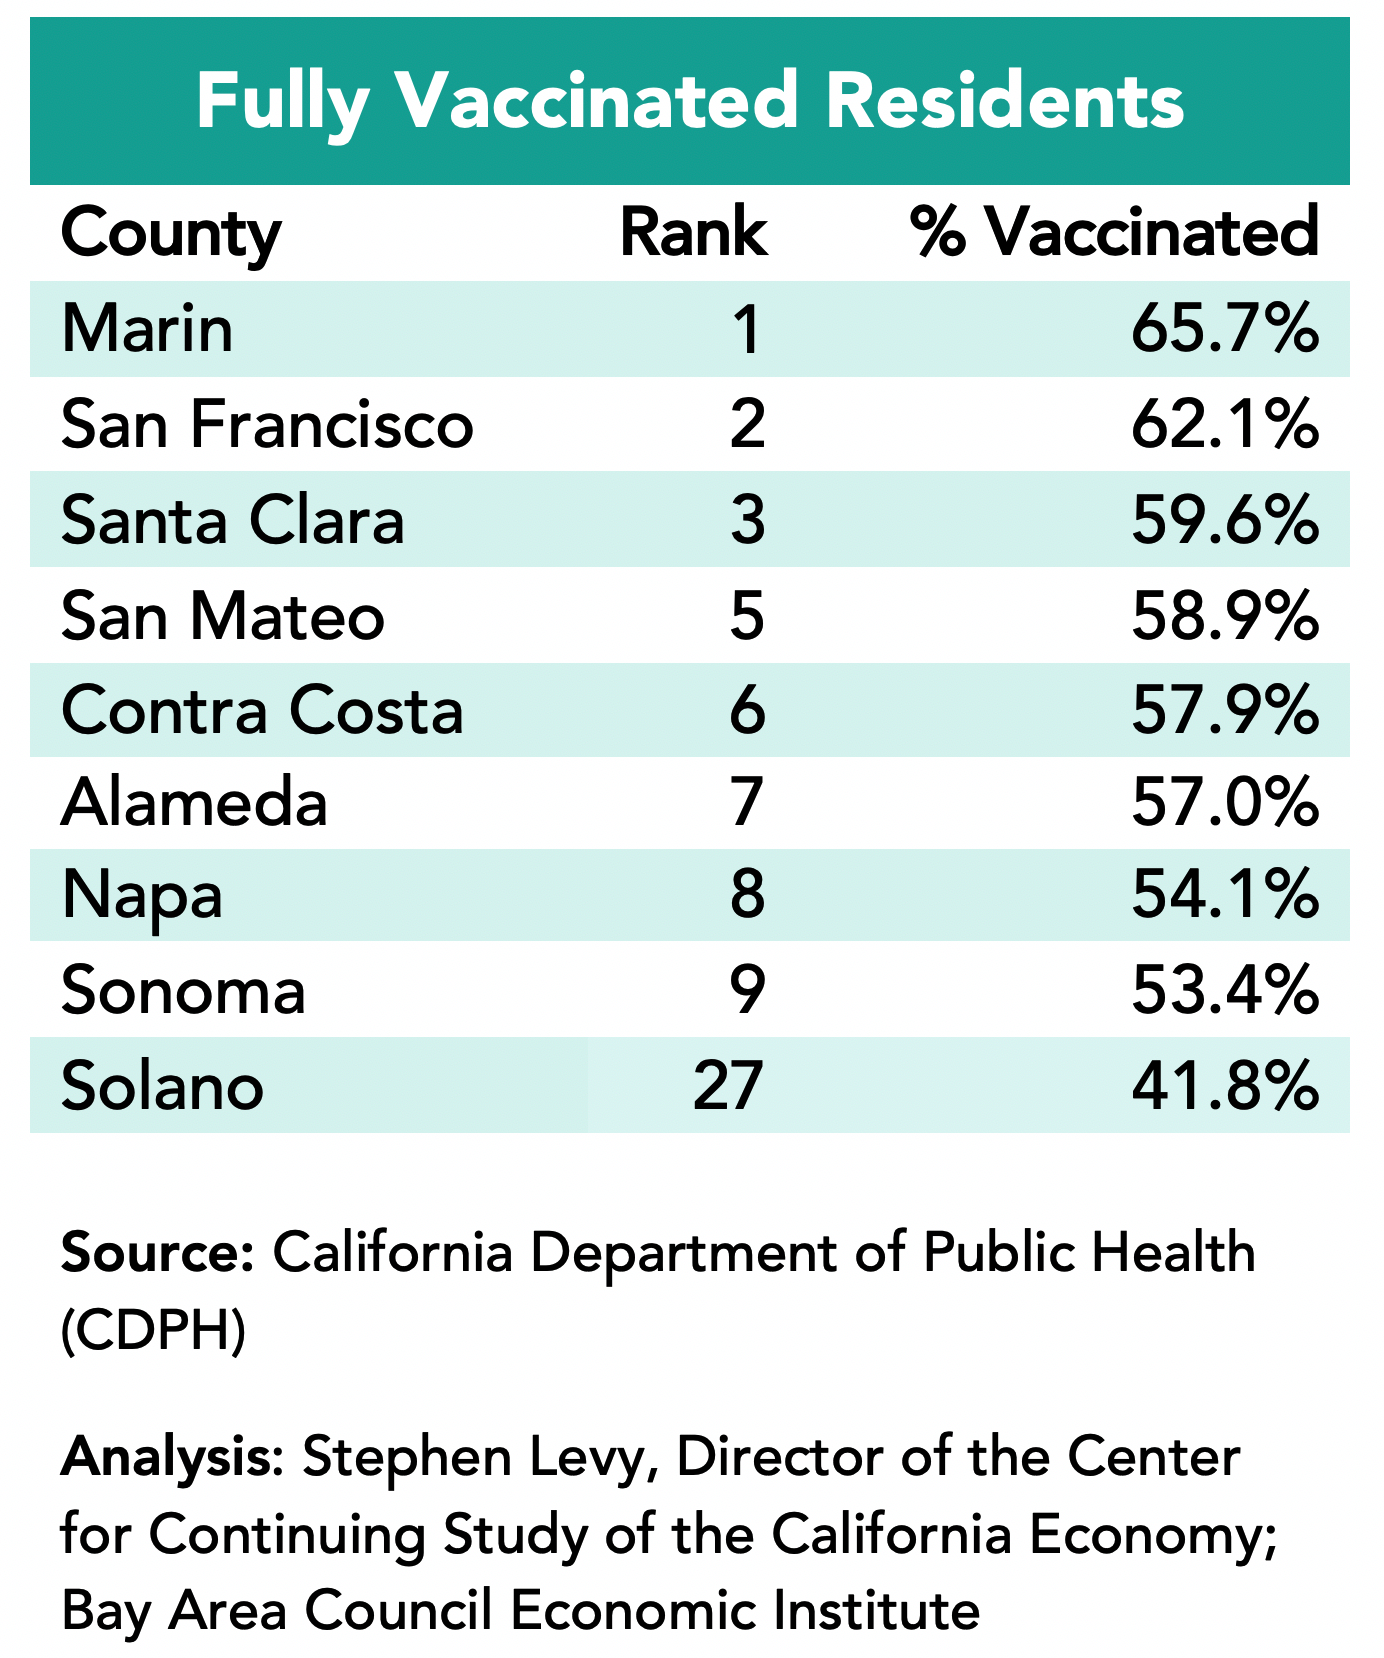
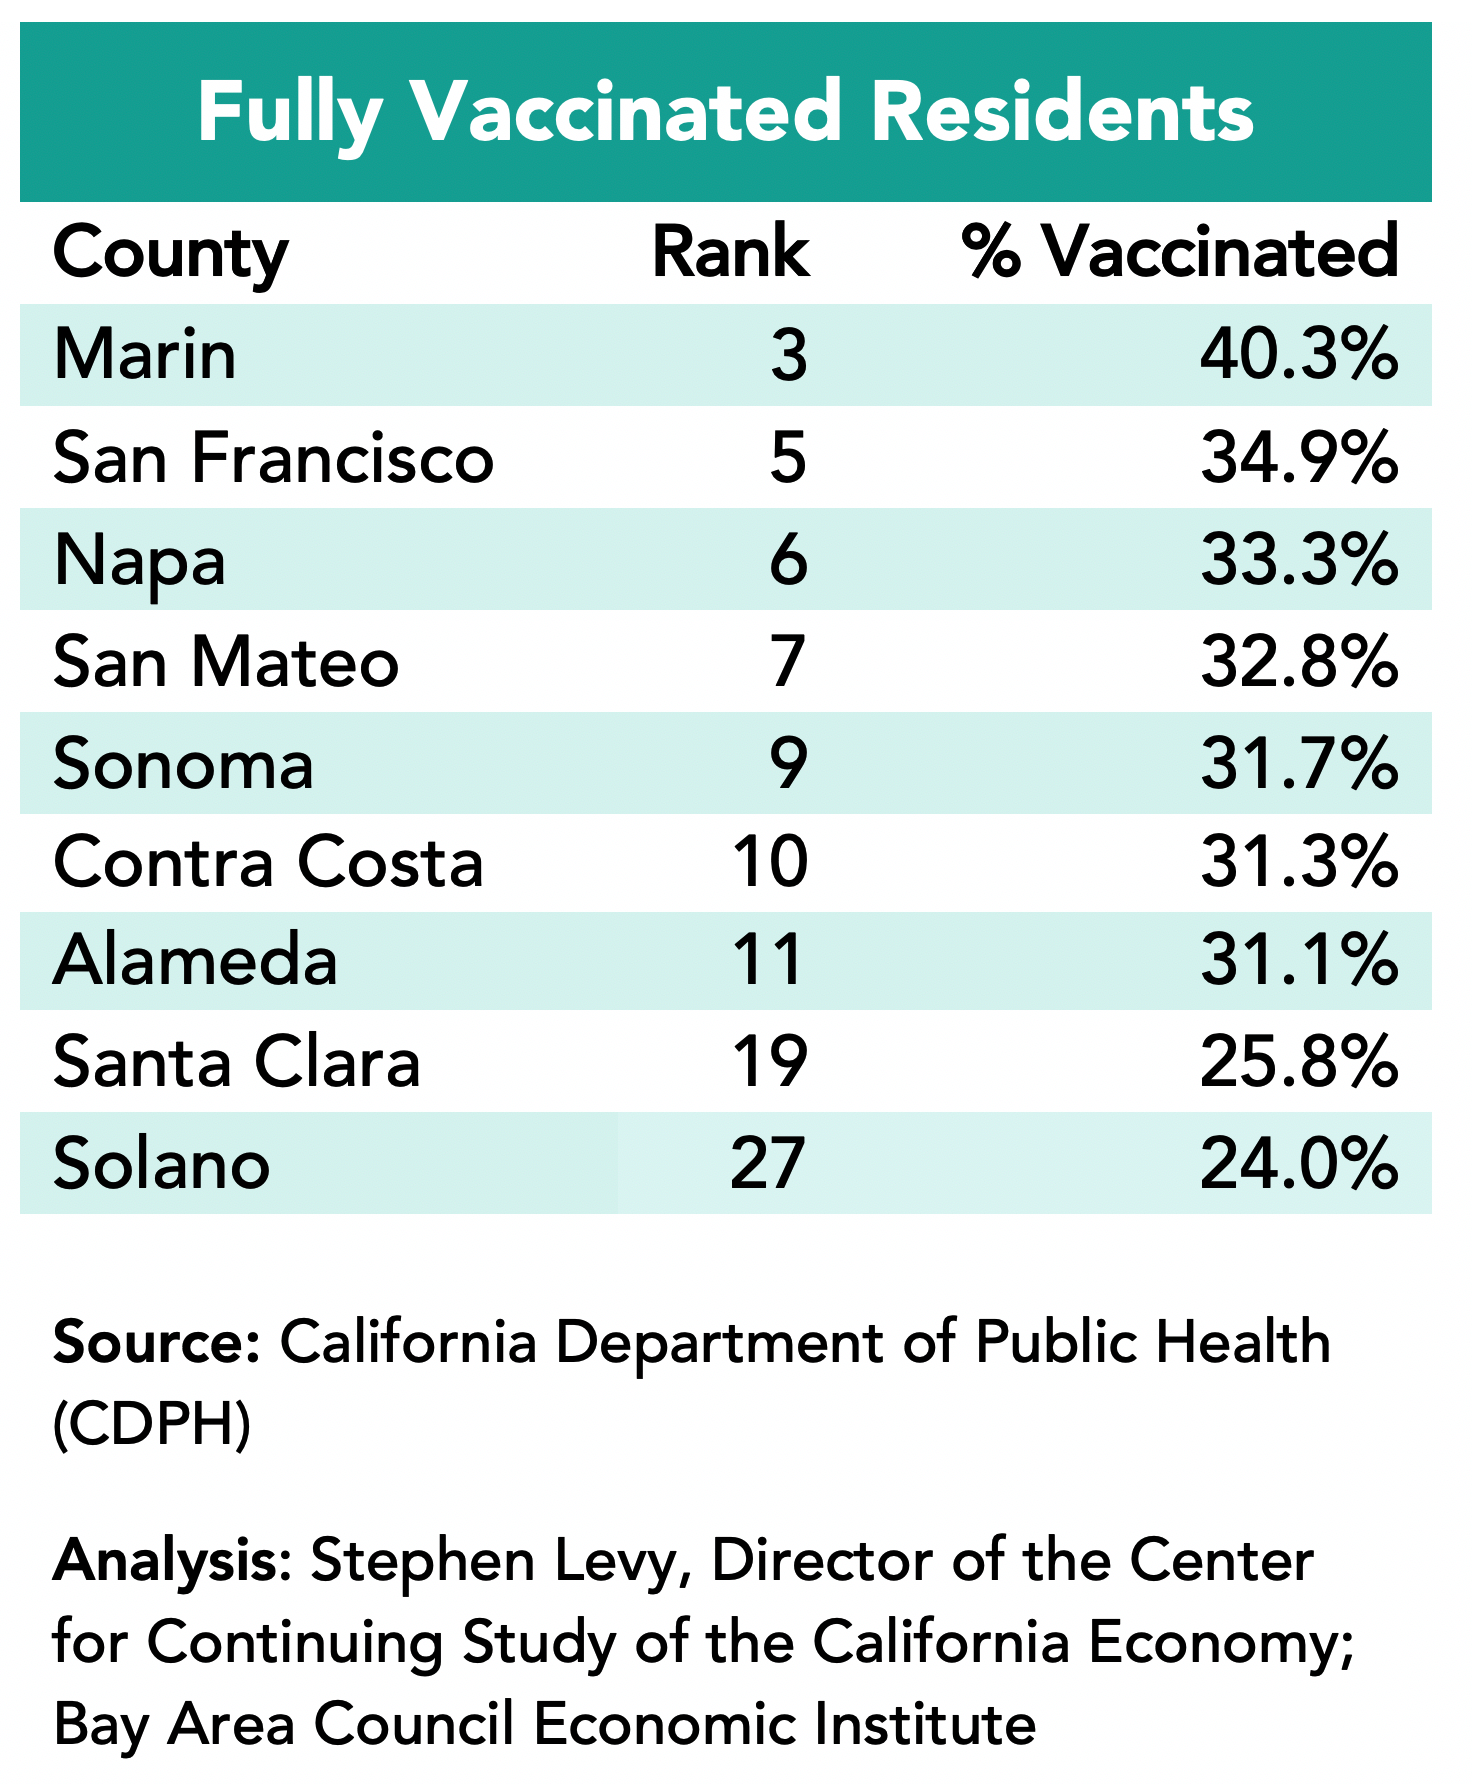
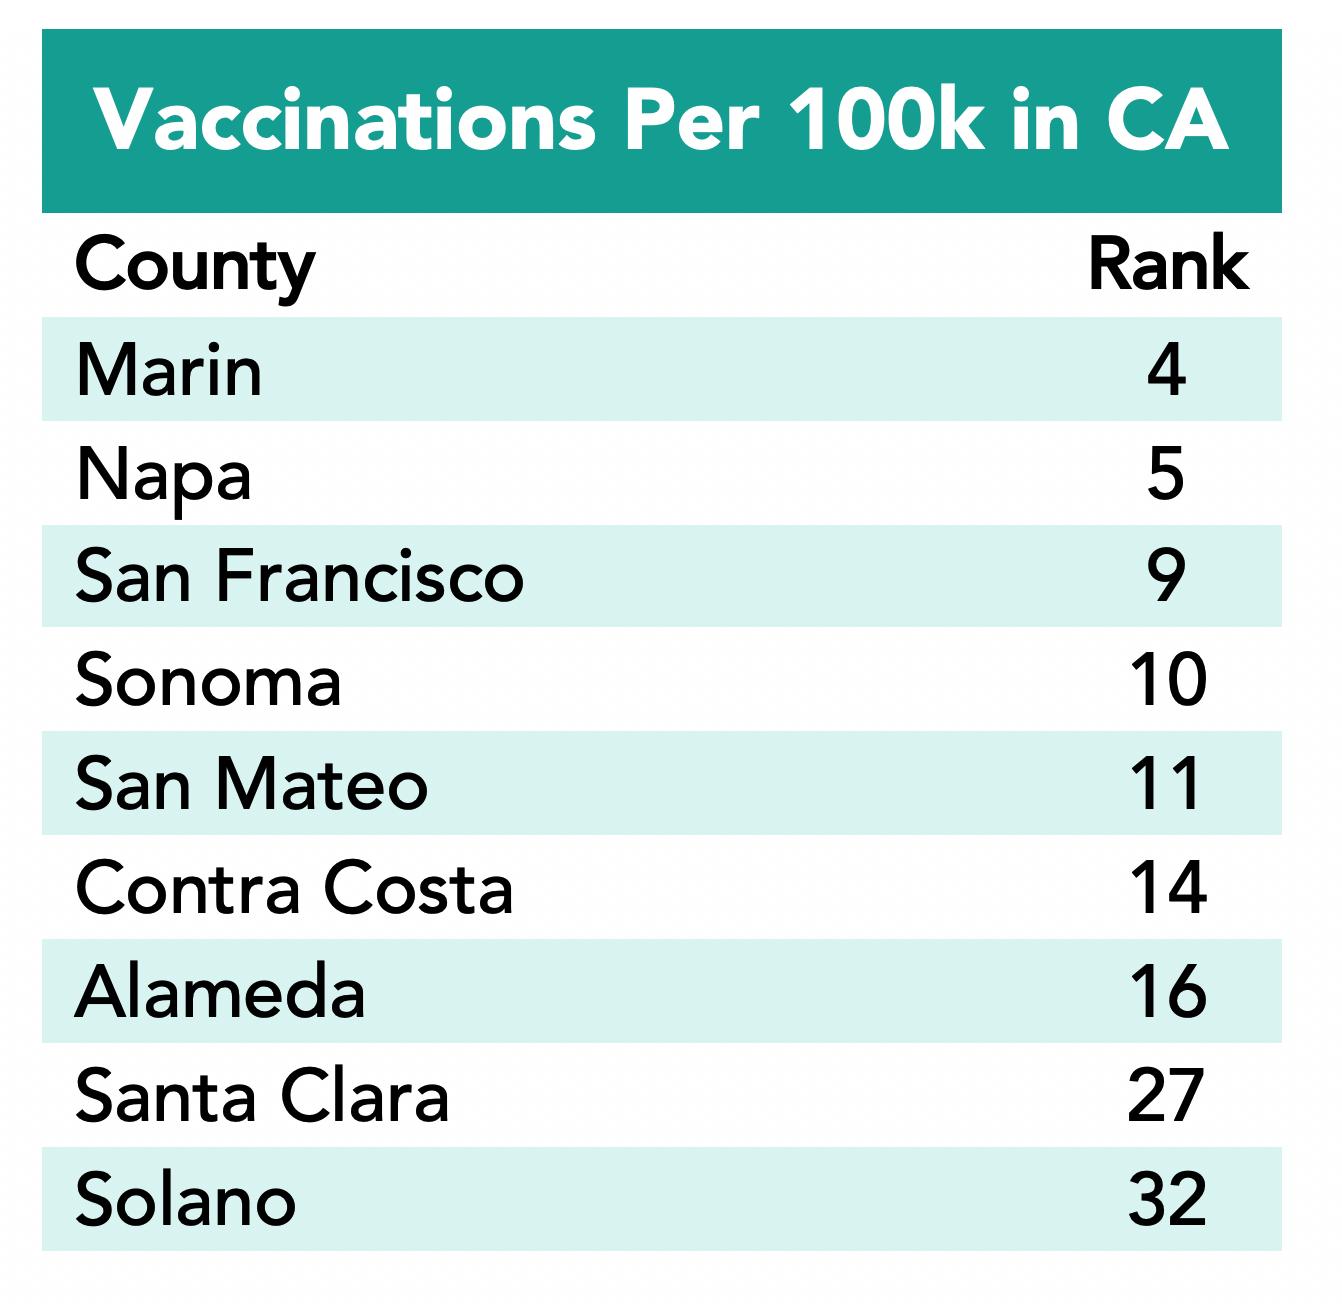
The top eight counties in terms of vaccination percentages (all but Solano) are from the Bay Area with all having more than 80% first doses and six having more than 75% fully vaccinated.
Large Challenges Remain:
We have the paradox of continuing reports of headquarters’ relocations outside of the region at the same the region is capturing record VC funding levels and tech jobs are slightly above pre-pandemic levels. Yet, the Bay Area Council warnings about losing our competitiveness remain as housing and mobility challenges are far from solved—the major causes of recent movements of companies and residents.
The rebound from pandemic related economic losses will continue but new policies are needed to maintain and improve the long-term competitiveness of the Bay Area economy. There is now increased movement to integrate our many transportation systems and agencies and pursue fare integration in an effort both to improve but to maintain the solvency of our main public transit options.
2022 is the year all Bay Area communities must update their Housing Elements to 1) identify sites attract and approve their allocation of new housing units affordable to major income groups, 2) develop programs and policies to overcome constraints and make the sites attractive to non-profit and market-rate developers and 3) comply with the state’s fair housing guidelines.
This is both a great opportunity and a challenge to combine meeting our equity, environmental and economic goals.
These economic updates are authored by Stephen Levy, Director of the Center for Continuing Study of the California Economy, and a member of the Bay Area Council Economic Institute board.
December 9, 2021
Unique economic ties link the Bay Area and California with Israel. For a nation of only 9.3 million people, Israel has an extraordinary record of generating technology and startups. Its role as a major startup hub and source of innovation in fields such as water technology and management, agtech, fintech, mobility, and cybersecurity connect it deeply with Silicon Valley. Built also on shared values and aligned interests, that relationship is reflected in growing venture investment, large-scale acquisitions of Israeli companies, successful Israeli-founded unicorns and public companies in Silicon Valley, and extensive corporate and binational R&D. This article by Sean Randolph, Senior Director of the Institute, in the San Francisco Business Times, further details the connection between the Bay Area and Israel..
Bay Area job growth accelerated in September and October. At the same time VC funding has reached record levels, housing permits have begun to rebound, the Governor signed several housing bills and the region is a leader in vaccinations and lowering COVID cases. Congress passed an infrastructure bill and international travel restrictions have been eased. The Bay Area still faces challenges in housing, transportation and other areas that affect our economic competitiveness and, in doing so, reduce our ability to meet equity and environmental goals.
The highlights:
• The Bay Area added 178,600 jobs between January and October 2021 (+4.9%) outpacing U.S. gains (3.9%) for this period. The regional unemployment rate fell from 6.6% to 4.4%. Job gains were led by the San Francisco and San Jose metro areas
• The U.S. economy is recovering even as inflation and supply chain challenges remain and COVID cases are rising again. At the same time immigration and tourism are on pace to increase and some infrastructure spending could start next year.
• The region is a state and national leader in vaccinations and reducing COVID cases that is allowing a return to more normal living here.
• The long-term Bay Area economic challenges remain with only slow progress on housing, transportation and economic competitiveness, challenges at the front of the Bay Area Council policy agenda.
Job Growth is Steady but Disappointing Compared to the Nation
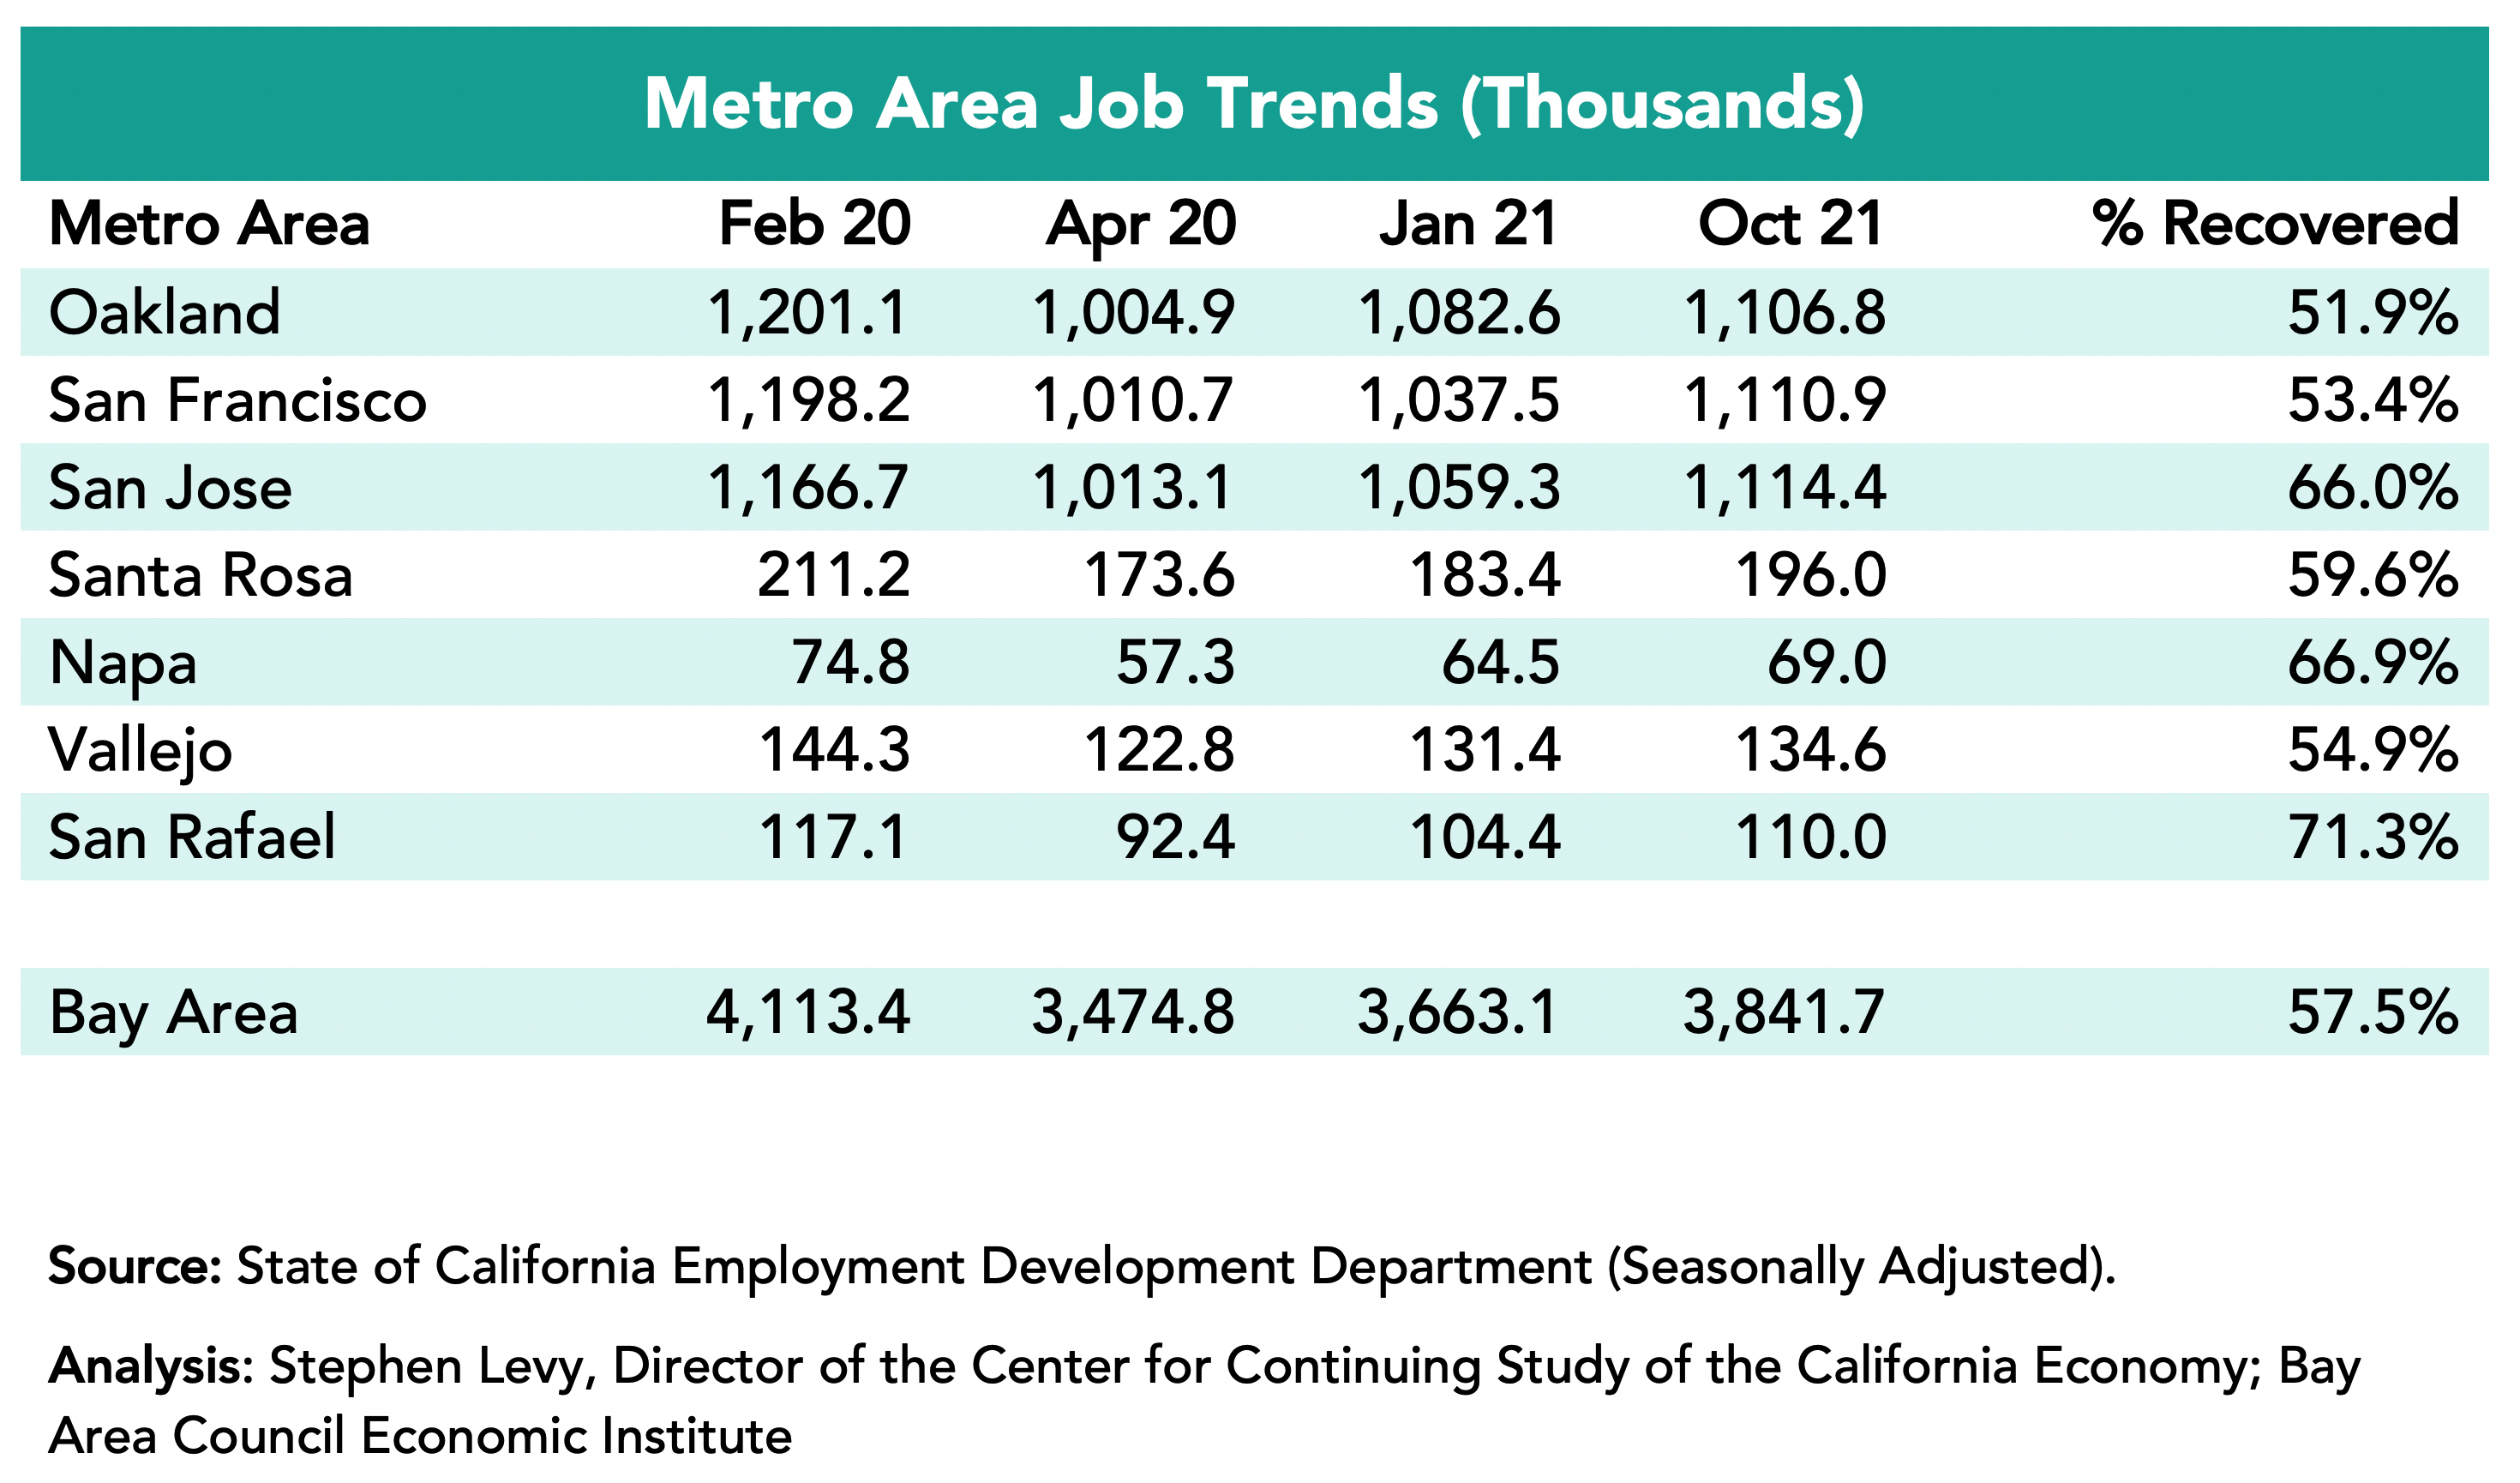
The Bay Area added 178,600 jobs since January 2021 led by a gain of 73,400 in the San Francisco metro area though SF has recovered just 53.4% of the jobs lost between February and April 2020 as job gains are offset by companies moving jobs out of SF. The San Jose metro area added 55,100 jobs but by October had recovered 66.0% of the jobs lost between February and April 2020. The San Jose, Napa, and San Rafael metro areas had the largest % job recovery by October August 2021.
Job growth accelerated in the past two months with gains of 21,100 jobs in October and an upward revised 18,200 jobs in September. There were strong gains in Professional and Business Services as well as a continuing recovery in Leisure and Hospitality.
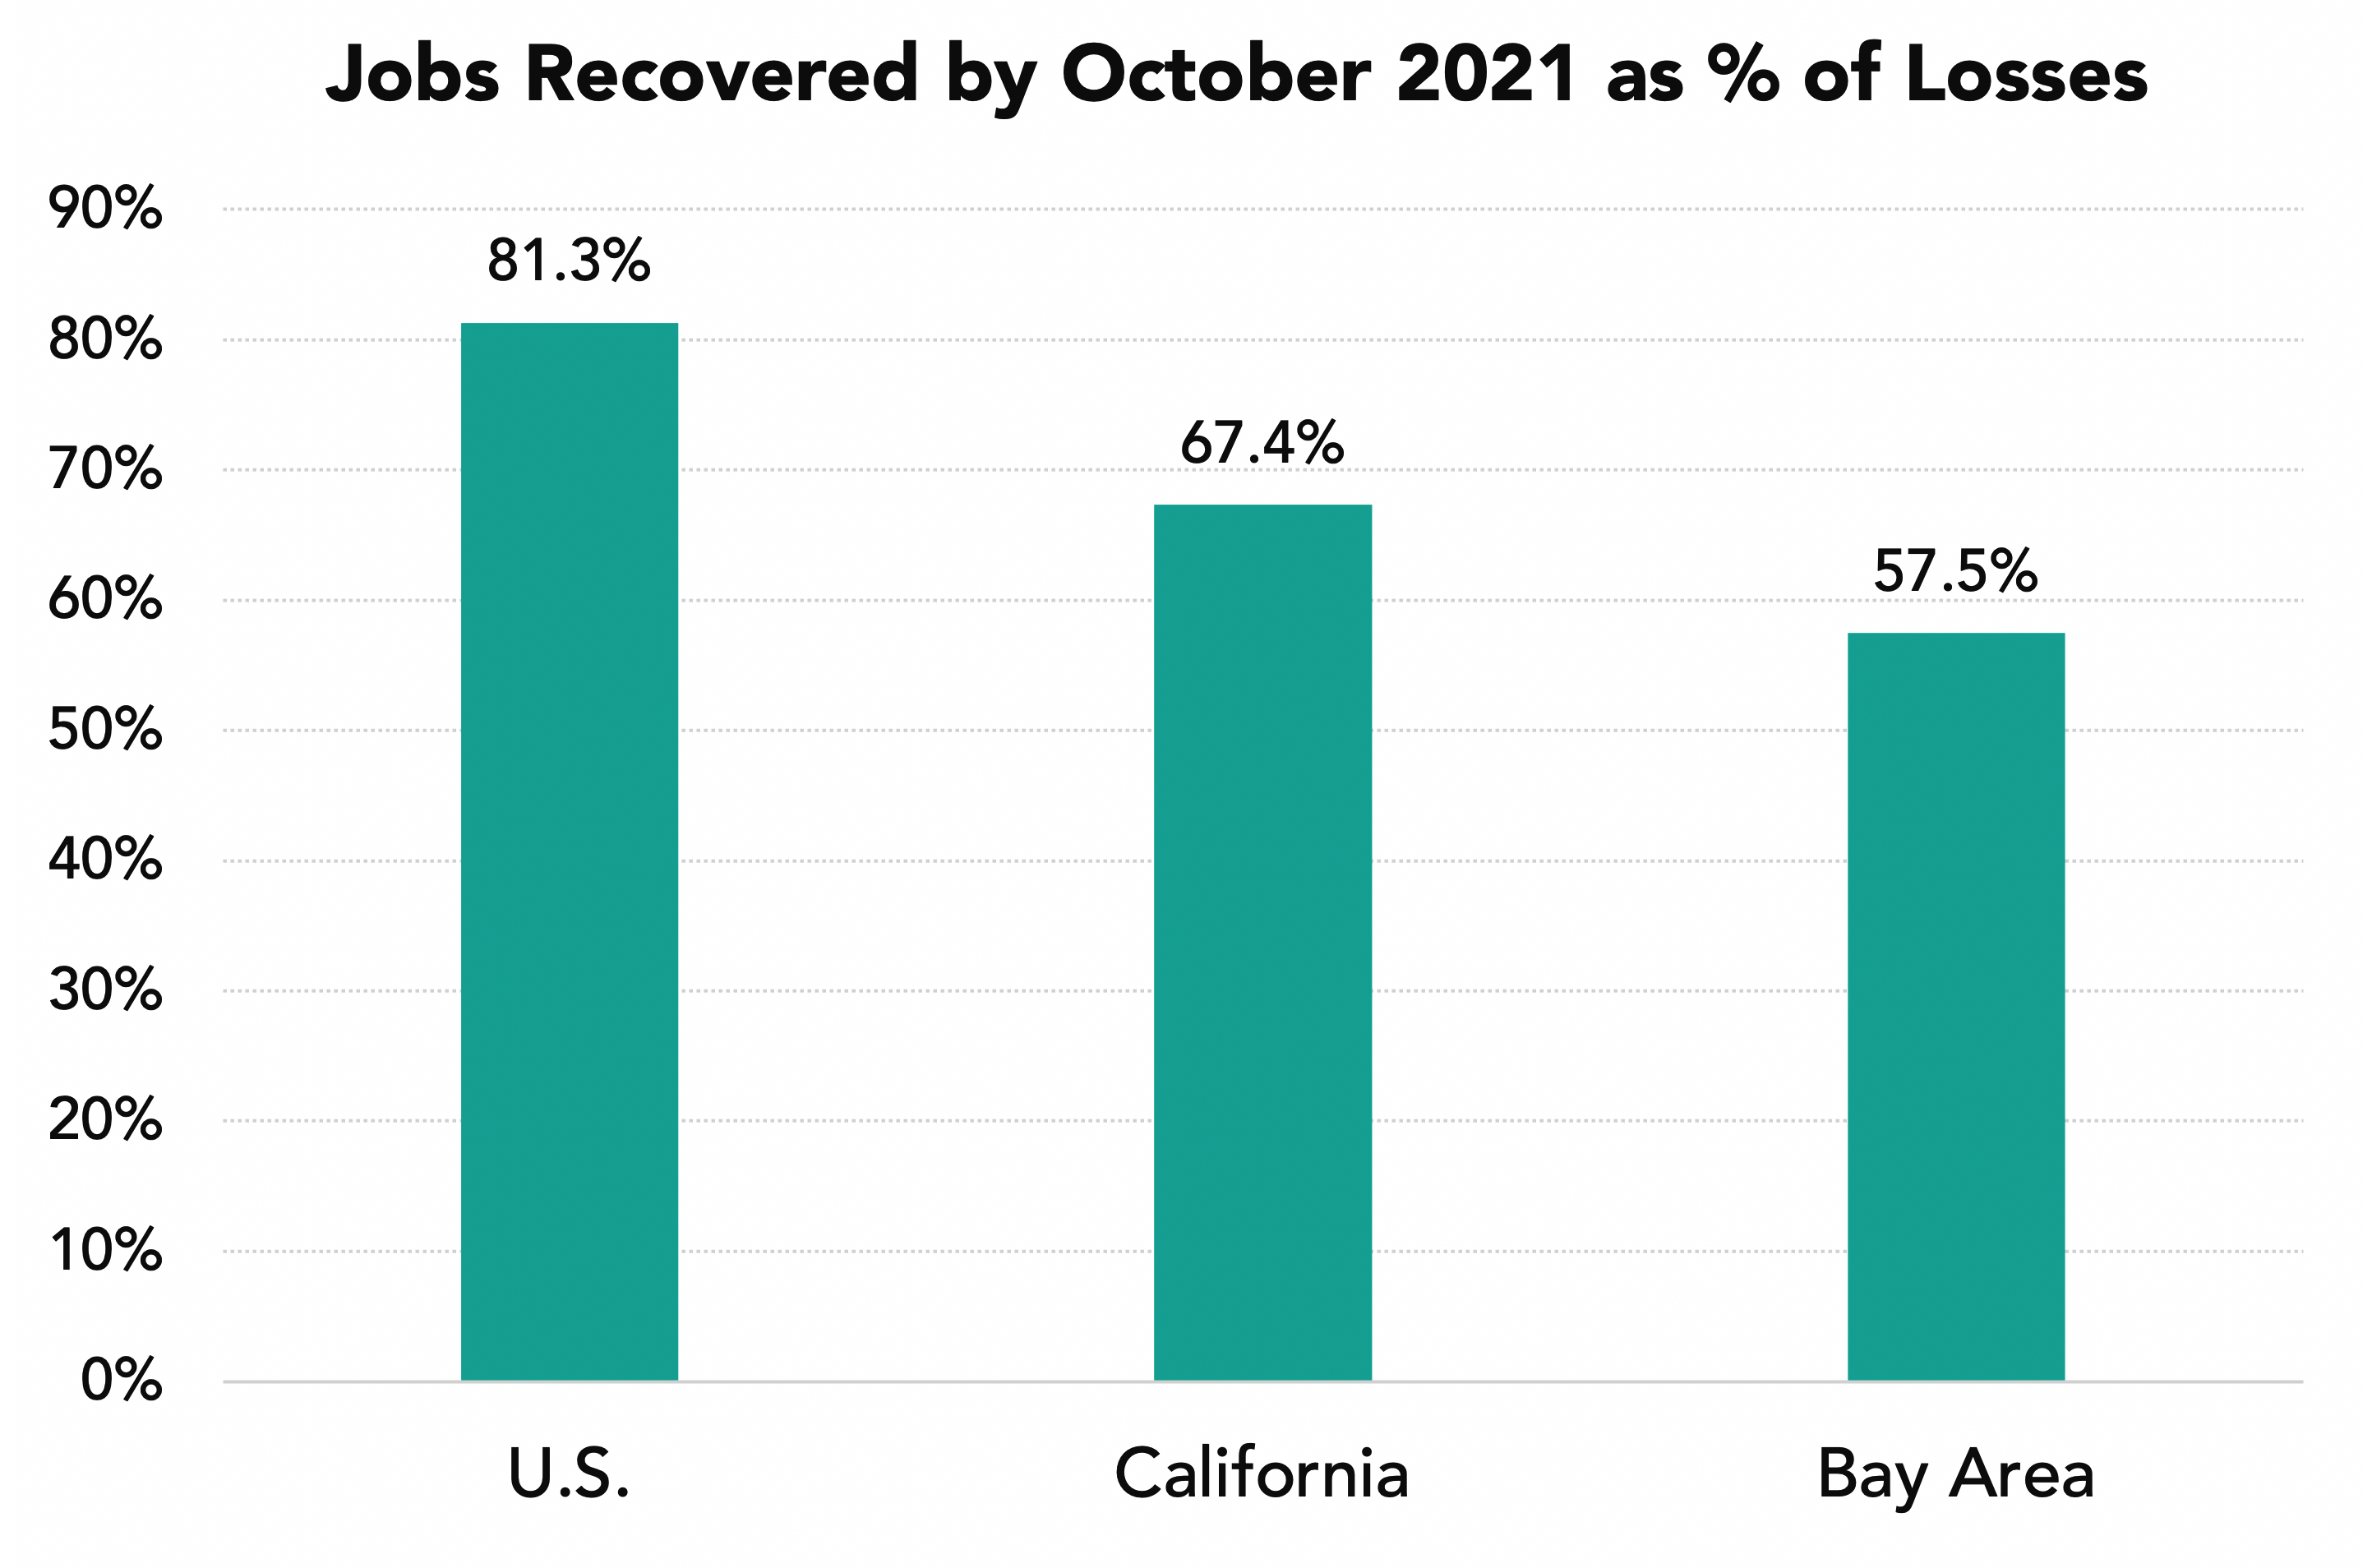
The Bay Area Had Recovered Just 57.5% of Lost Jobs by October 2021 Yet VC Funding is Surging and Tech Jobs Are Above Pre-Pandemic Levels
In October 2021 the Bay Area had recovered 57.5% of the jobs lost between February and April 2020 up from 29.4% in January. The state had recovered 67.4% up from 34.0% while the nation had recovered 81.3% of lost jobs up from 55.4%. At the same time VC funding in the first three quarters of 2021 was the highest on record. The Bay Area lagged the nation in 2020 job performance but has outpaced the nation in job growth so far in 2021 (4.9% versus 3.9%).
Unemployment Rates Fell to 4.4% in the Region in October 2021 from 6.6% in January 2021.
The lowest rates were in the San Rafael metro area (3.4%) followed by the San Francisco and San Jose metro areas (3.8%) in October 2021.
Industries Were Affected Differently
The Information sector actually added jobs compared to before the pandemic hit. And the Professional & Business Services sector is also above pre-pandemic job levels. On the other hand, the Leisure and Hospitality sector recovered only 55.0% of lost jobs by October 2021 though travel and tourism are now picking up again. The Government sector has fewer jobs now than in April 2020 though many jobs may be returning as schools and colleges reopen. The Construction and Manufacturing sectors have recovered most of the jobs between February and April 2020.
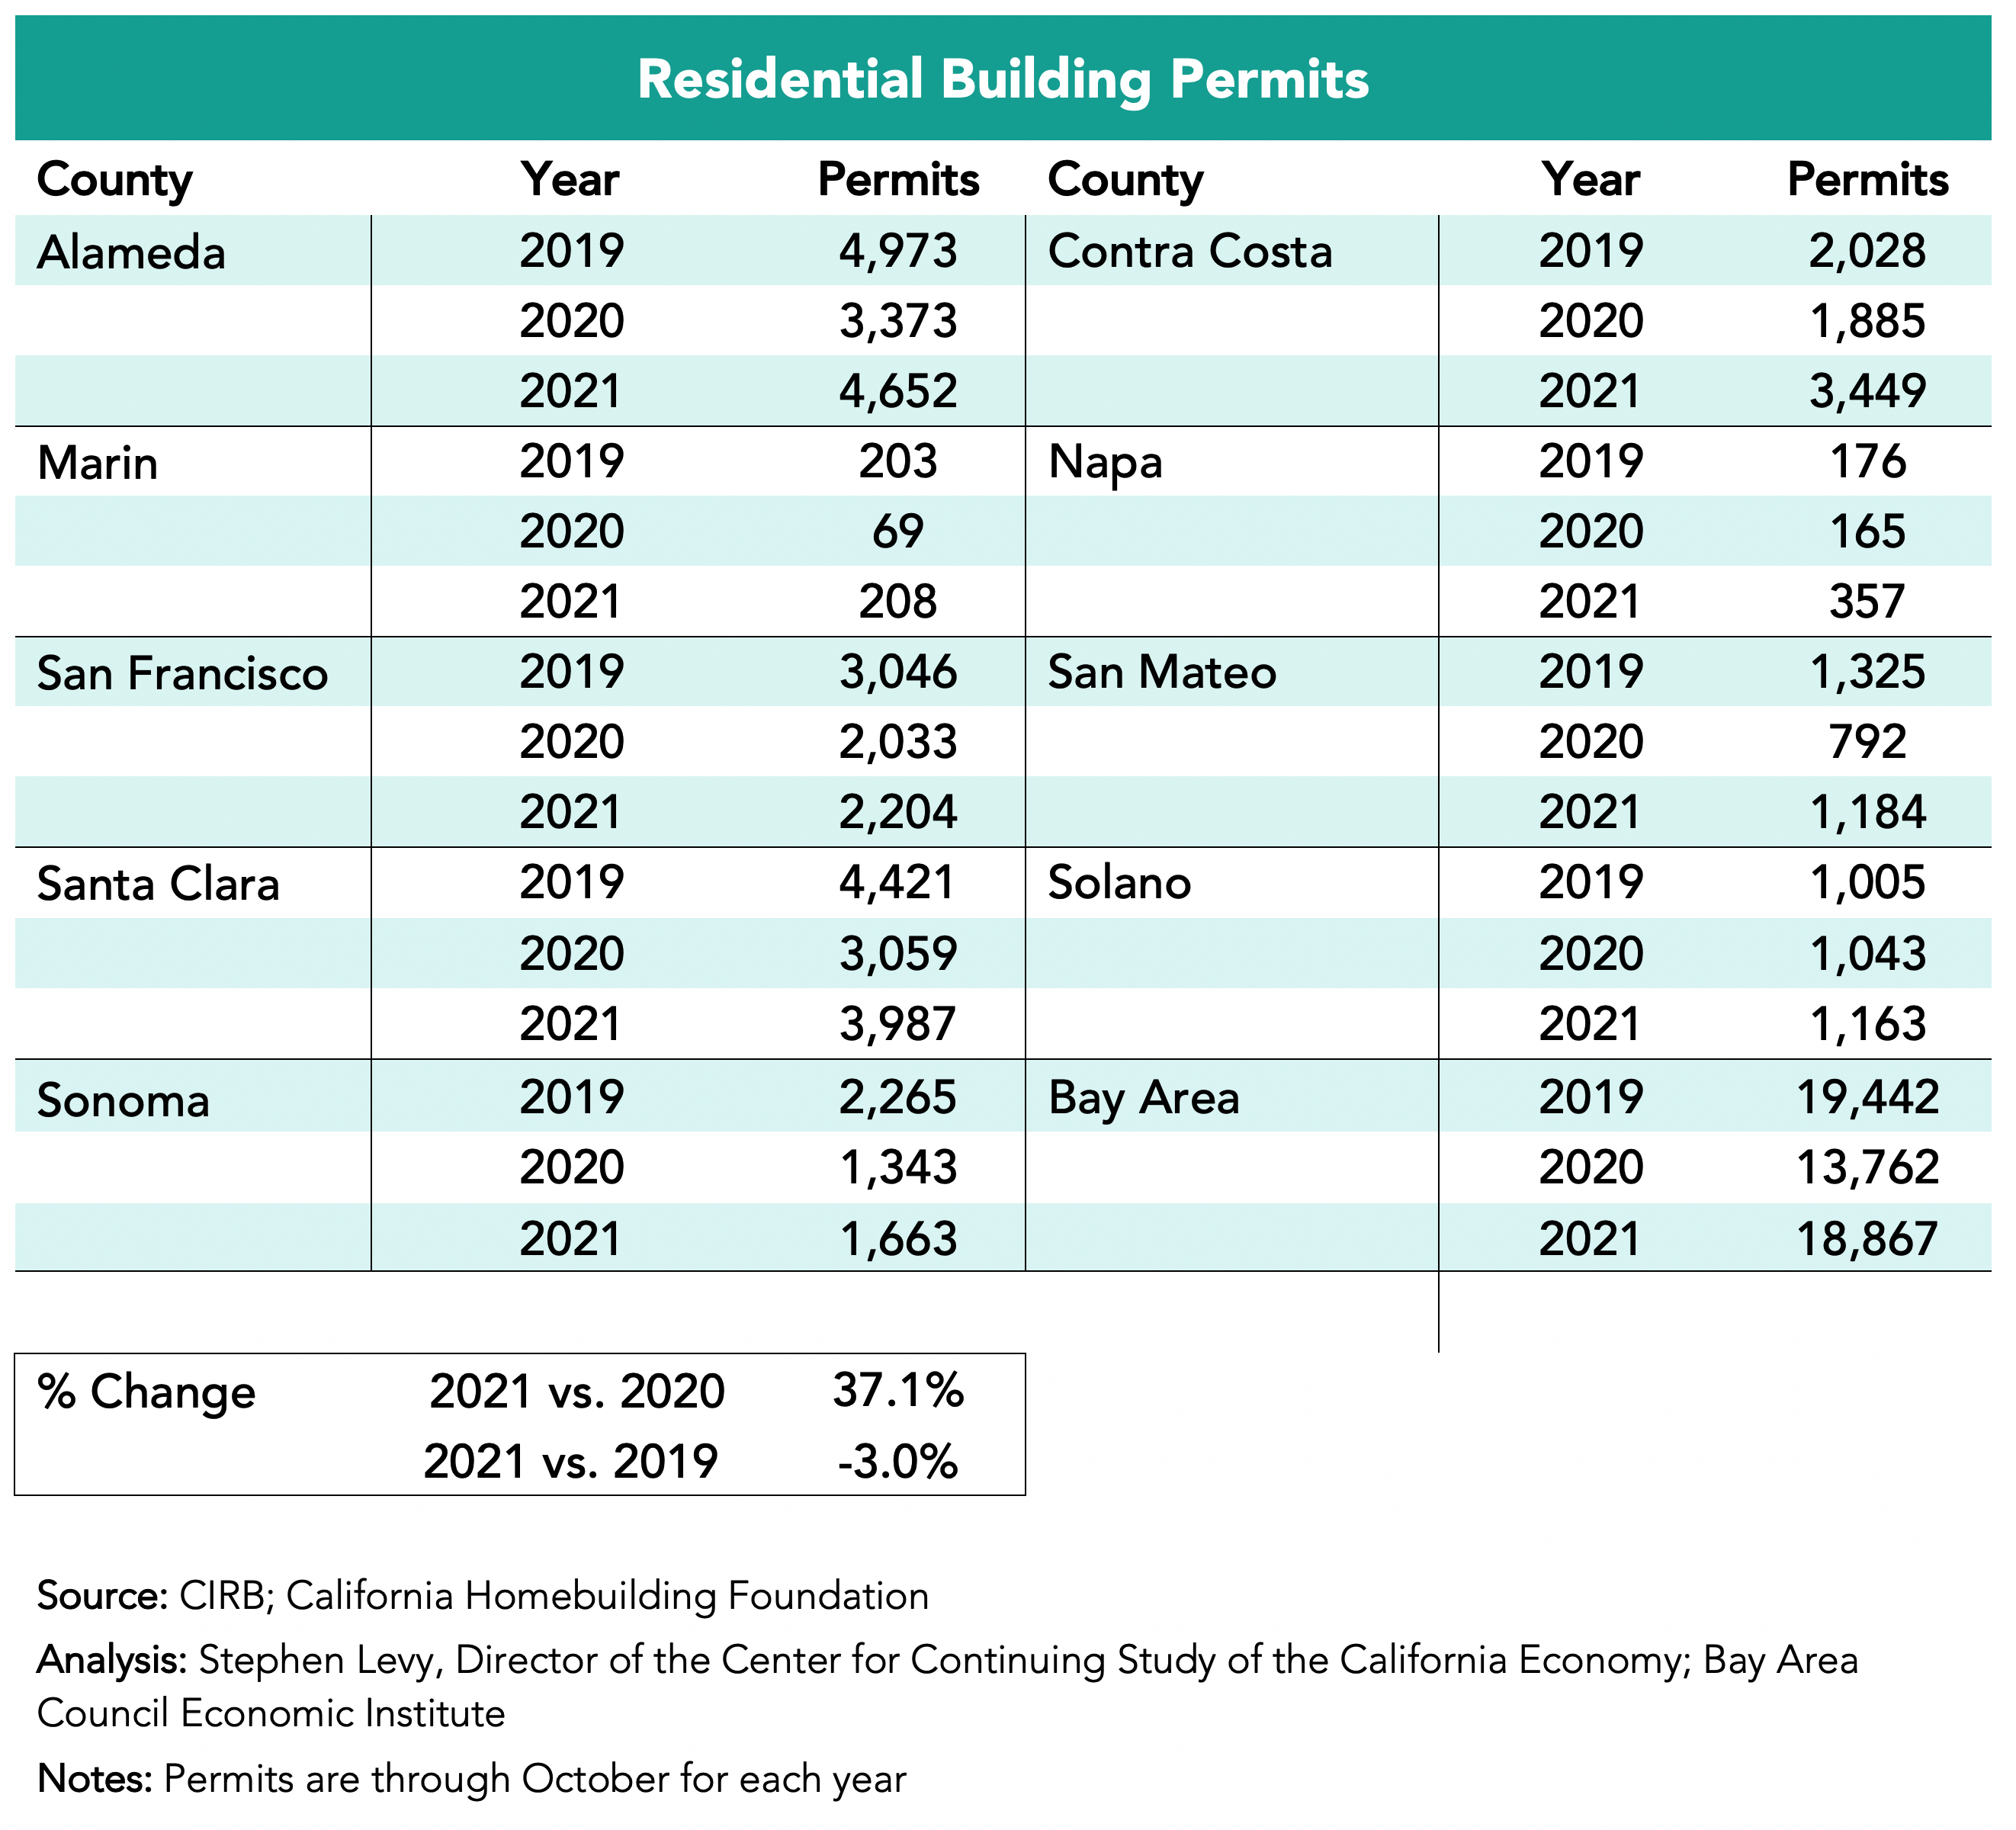
Housing Permits Up Over 2020 Levels, Trail 2019 Slightly
Housing permit levels are up over 2020 in the first nine months of 2021 but still slightly trail 2019 comparable months. But recently many new developments have been approved or proposed in places like Oakland and San Jose and in other cities as well as new developments being proposed.
Bay Area COVID Stats
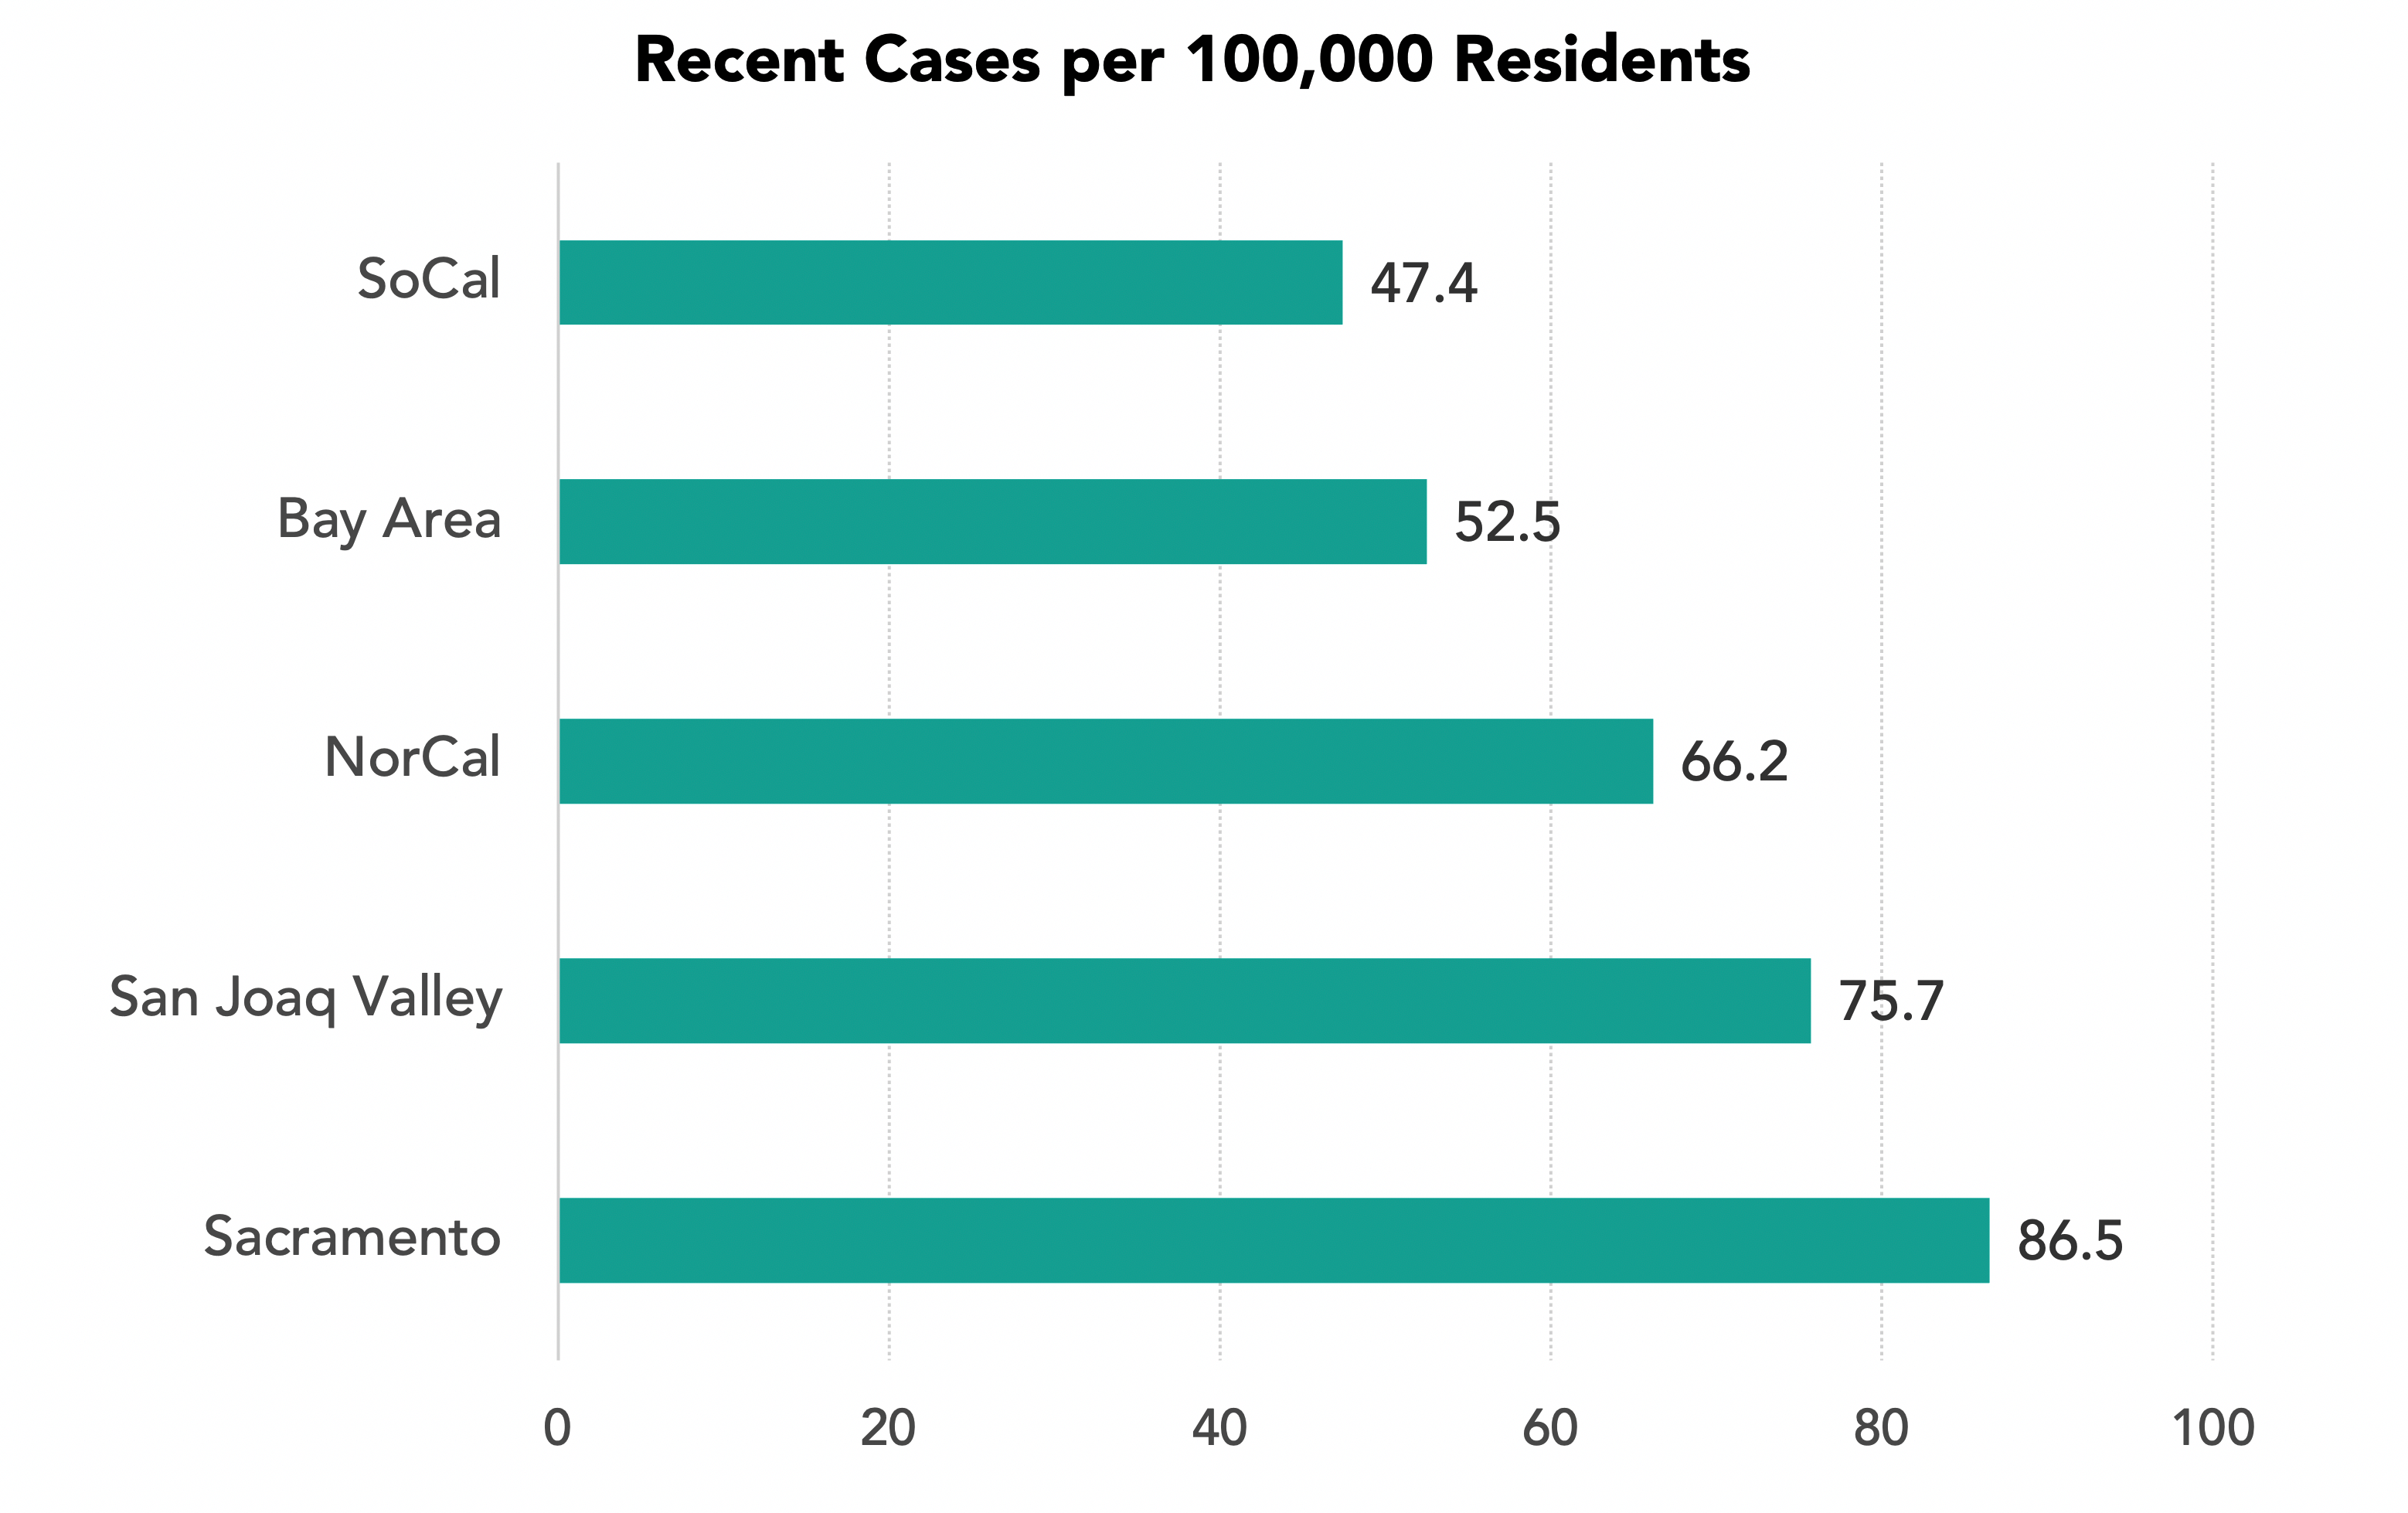
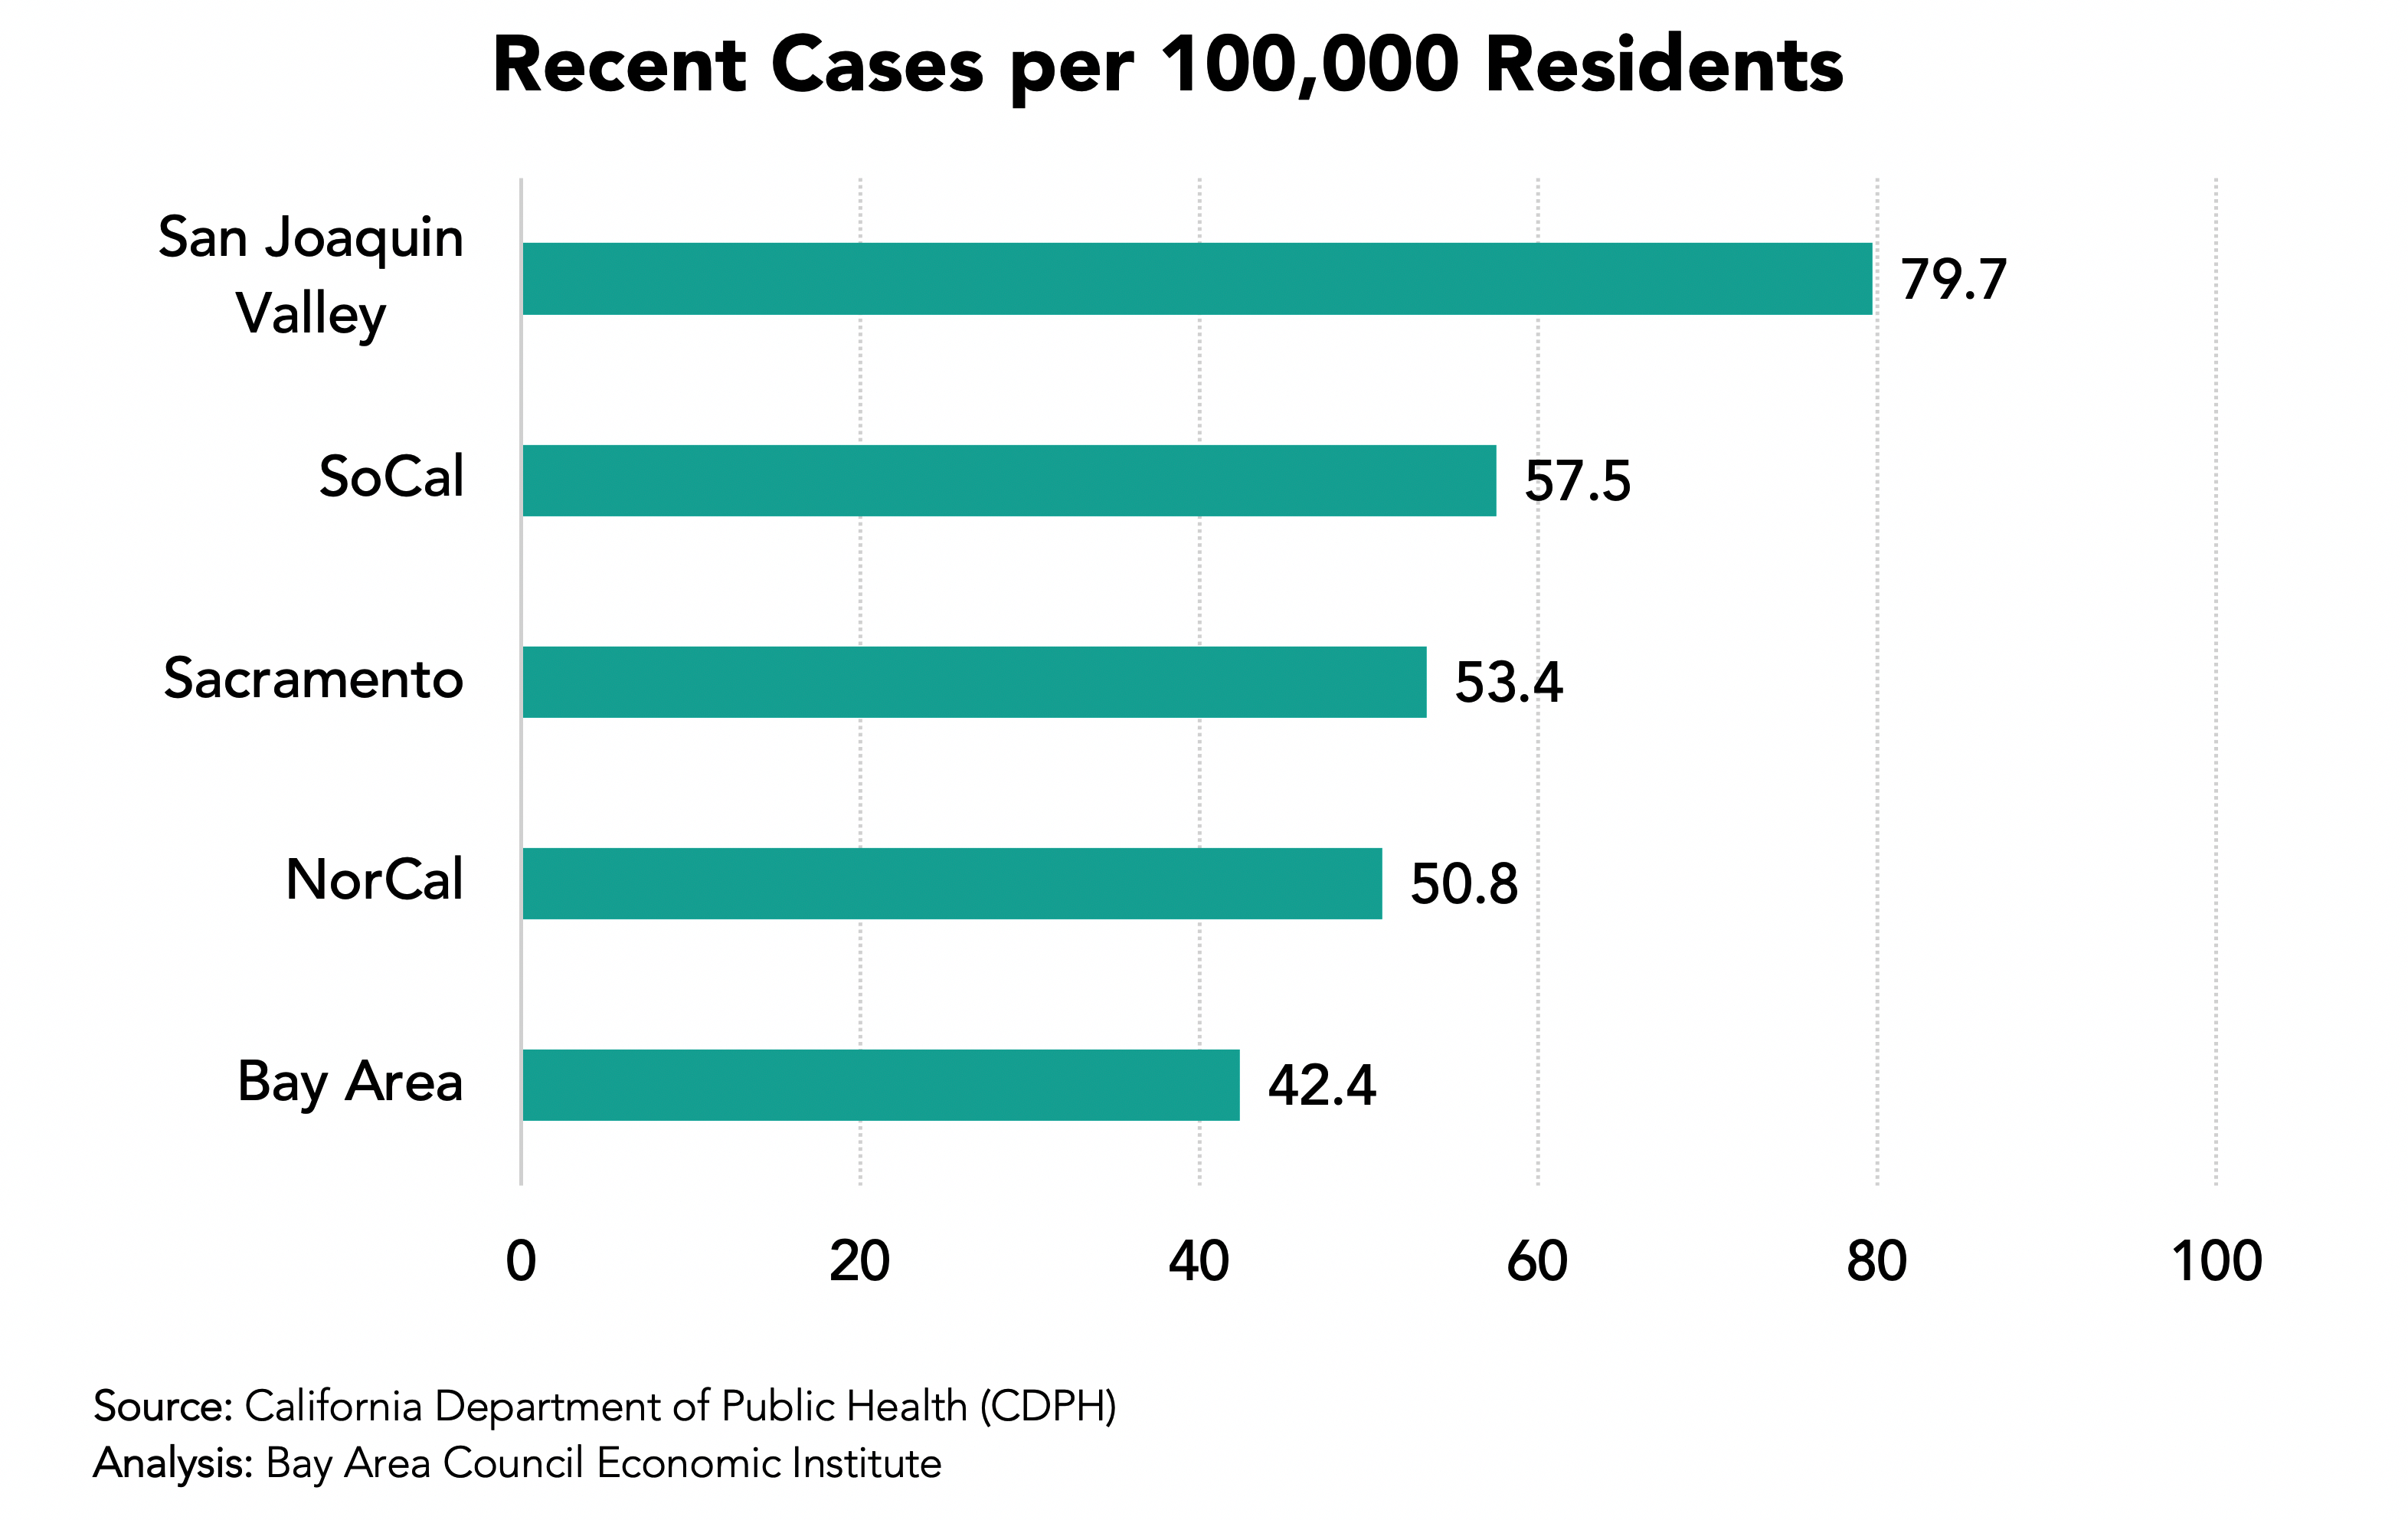
The top eight counties in terms of vaccination %s (all but Solano) are from the Bay Area with all having more than 75% first doses and six having more than 70% fully vaccinated. The Bay Area has by far the lowest number of new cases per capita and all 9 Bay Area counties are in the 15 counties with the lowest recent per capita cases are in the Bay Area.
Large Challenges Remain:
We have the paradox of continuing reports of headquarters’ relocations outside of the region at the same the region is capturing record VC funding levels and tech jobs are slightly above pre-pandemic levels. Yet, the Bay Area Council warnings about losing our competitiveness remain as housing and mobility challenges are far from solved—the major causes of recent movements of companies and residents.
The rebound from pandemic related economic losses will continue but new policies are needed to maintain and improve the long-term competitiveness of the Bay Area economy. There is now increased movement to integrate our many transportation systems and agencies and pursue fare integration in an effort both to improve but to maintain the solvency of our main public transit options.
These economic updates are authored by Stephen Levy, Director of the Center for Continuing Study of the California Economy, and a member of the Bay Area Council Economic Institute board.
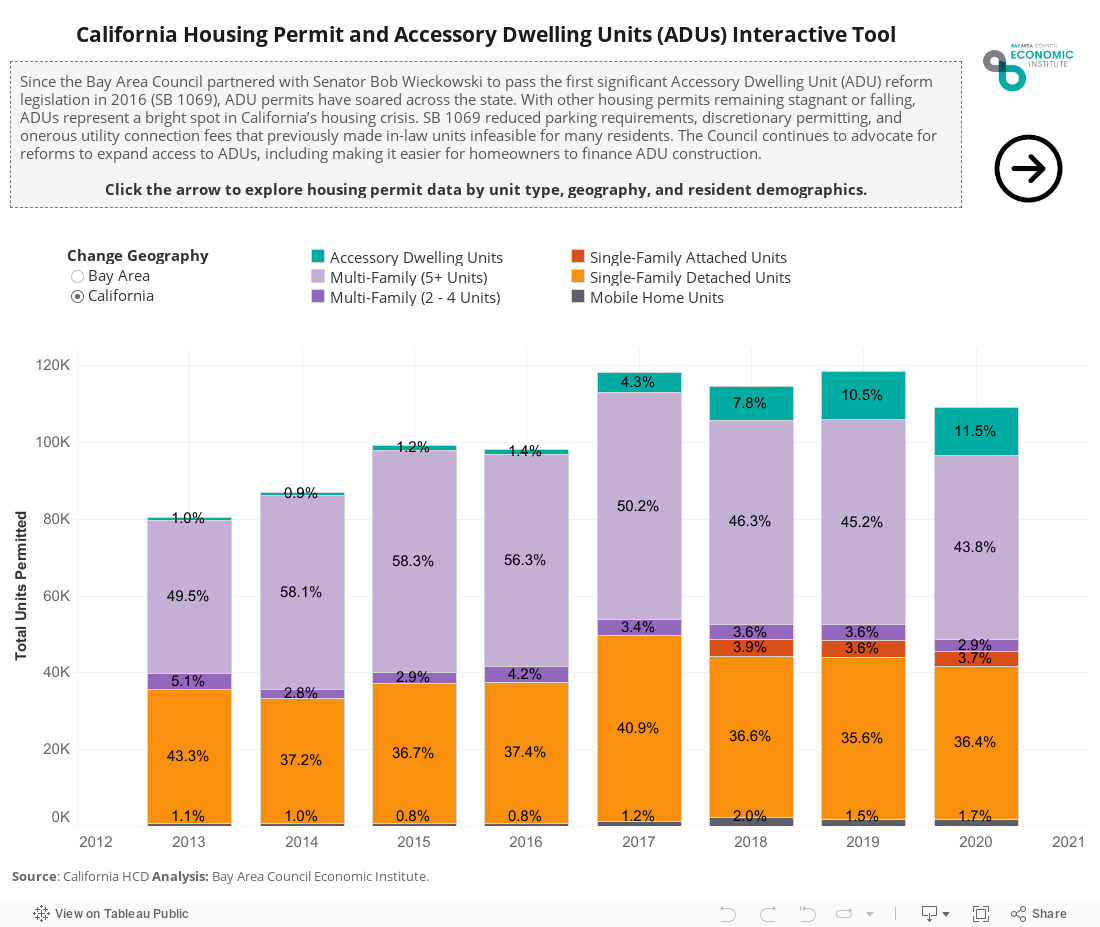
An analysis by the Bay Area Council Economic Institute using data from the California Department of Housing and Community Development (HCD) shows Accessory Dwelling Units (ADUs) accounted for 13.4 percent of all housing permit types in the Bay Area in 2020, a significant jump from 3.2 percent in 2016. In Marin and Napa, the Bay Area counties permitting the lowest amount of housing, ADUs are the majority of permits, making up 49.4 percent of all housing permits in Marin County and 40.3 percent in Napa County.
Since the Bay Area Council partnered with Senator Bob Wieckowski to pass the first significant Accessory Dwelling Unit (ADU) reform legislation in 2016 (SB 1069), ADU permits have soared across the state. With other housing permits remaining stagnant or falling, ADUs represent a bright spot in California’s housing crisis. The Council continues to advocate for reforms to expand access to ADUs, including most recently sponsoring legislation by Assemblymember Phil Ting (AB 561) making it easier for homeowners to finance ADU construction. For questions or to engage in the Council’s housing policy work,please contact Senior Policy Manager, Kelli Fallon. For questions on this data visualization,please contact Research Manager, Abby Raisz.
Image Source: Housable
Modest Job Growth, Good News on Housing and COVID
Sept 22, 2021
The Bay Area has posted modest but disappointing job gains since March. At the same time VC funding is strong, housing permits have begun to rebound, the Governor signed several housing bills and the region is a leader in vaccinations and lowering COVID cases. The U.S. economic outlook and federal policies have improved with positive implications for our region. The Bay Area still faces challenges in housing, transportation and other areas that affect our economic competitiveness and, in doing so, reduce our ability to meet equity and environmental goals.
The highlights:
• The Bay Area added 141,500 jobs between January and August 2021 and the regional unemployment rate fell from 6.6% to 5.5%. Job gains were led by the San Francisco and San Jose metro areas and a rebound in the restaurant and tourist sectors.
• The U.S, and Bay Area economic outlook has been upgraded by the $1.9 billion COVID relief package, the likely passage of a major infrastructure package, and positive movement on the safety net and environmental investments and the possibility of more favorable immigration policies that all play to Bay Area strengths.
• The region is a state and national leader in vaccinations and reducing COVID cases that is allowing a return to more normal living here
• The long-term Bay Area economic challenges remain with only slow progress on housing, transportation and economic competitiveness, challenges at the front of the Bay Area Council policy agenda.
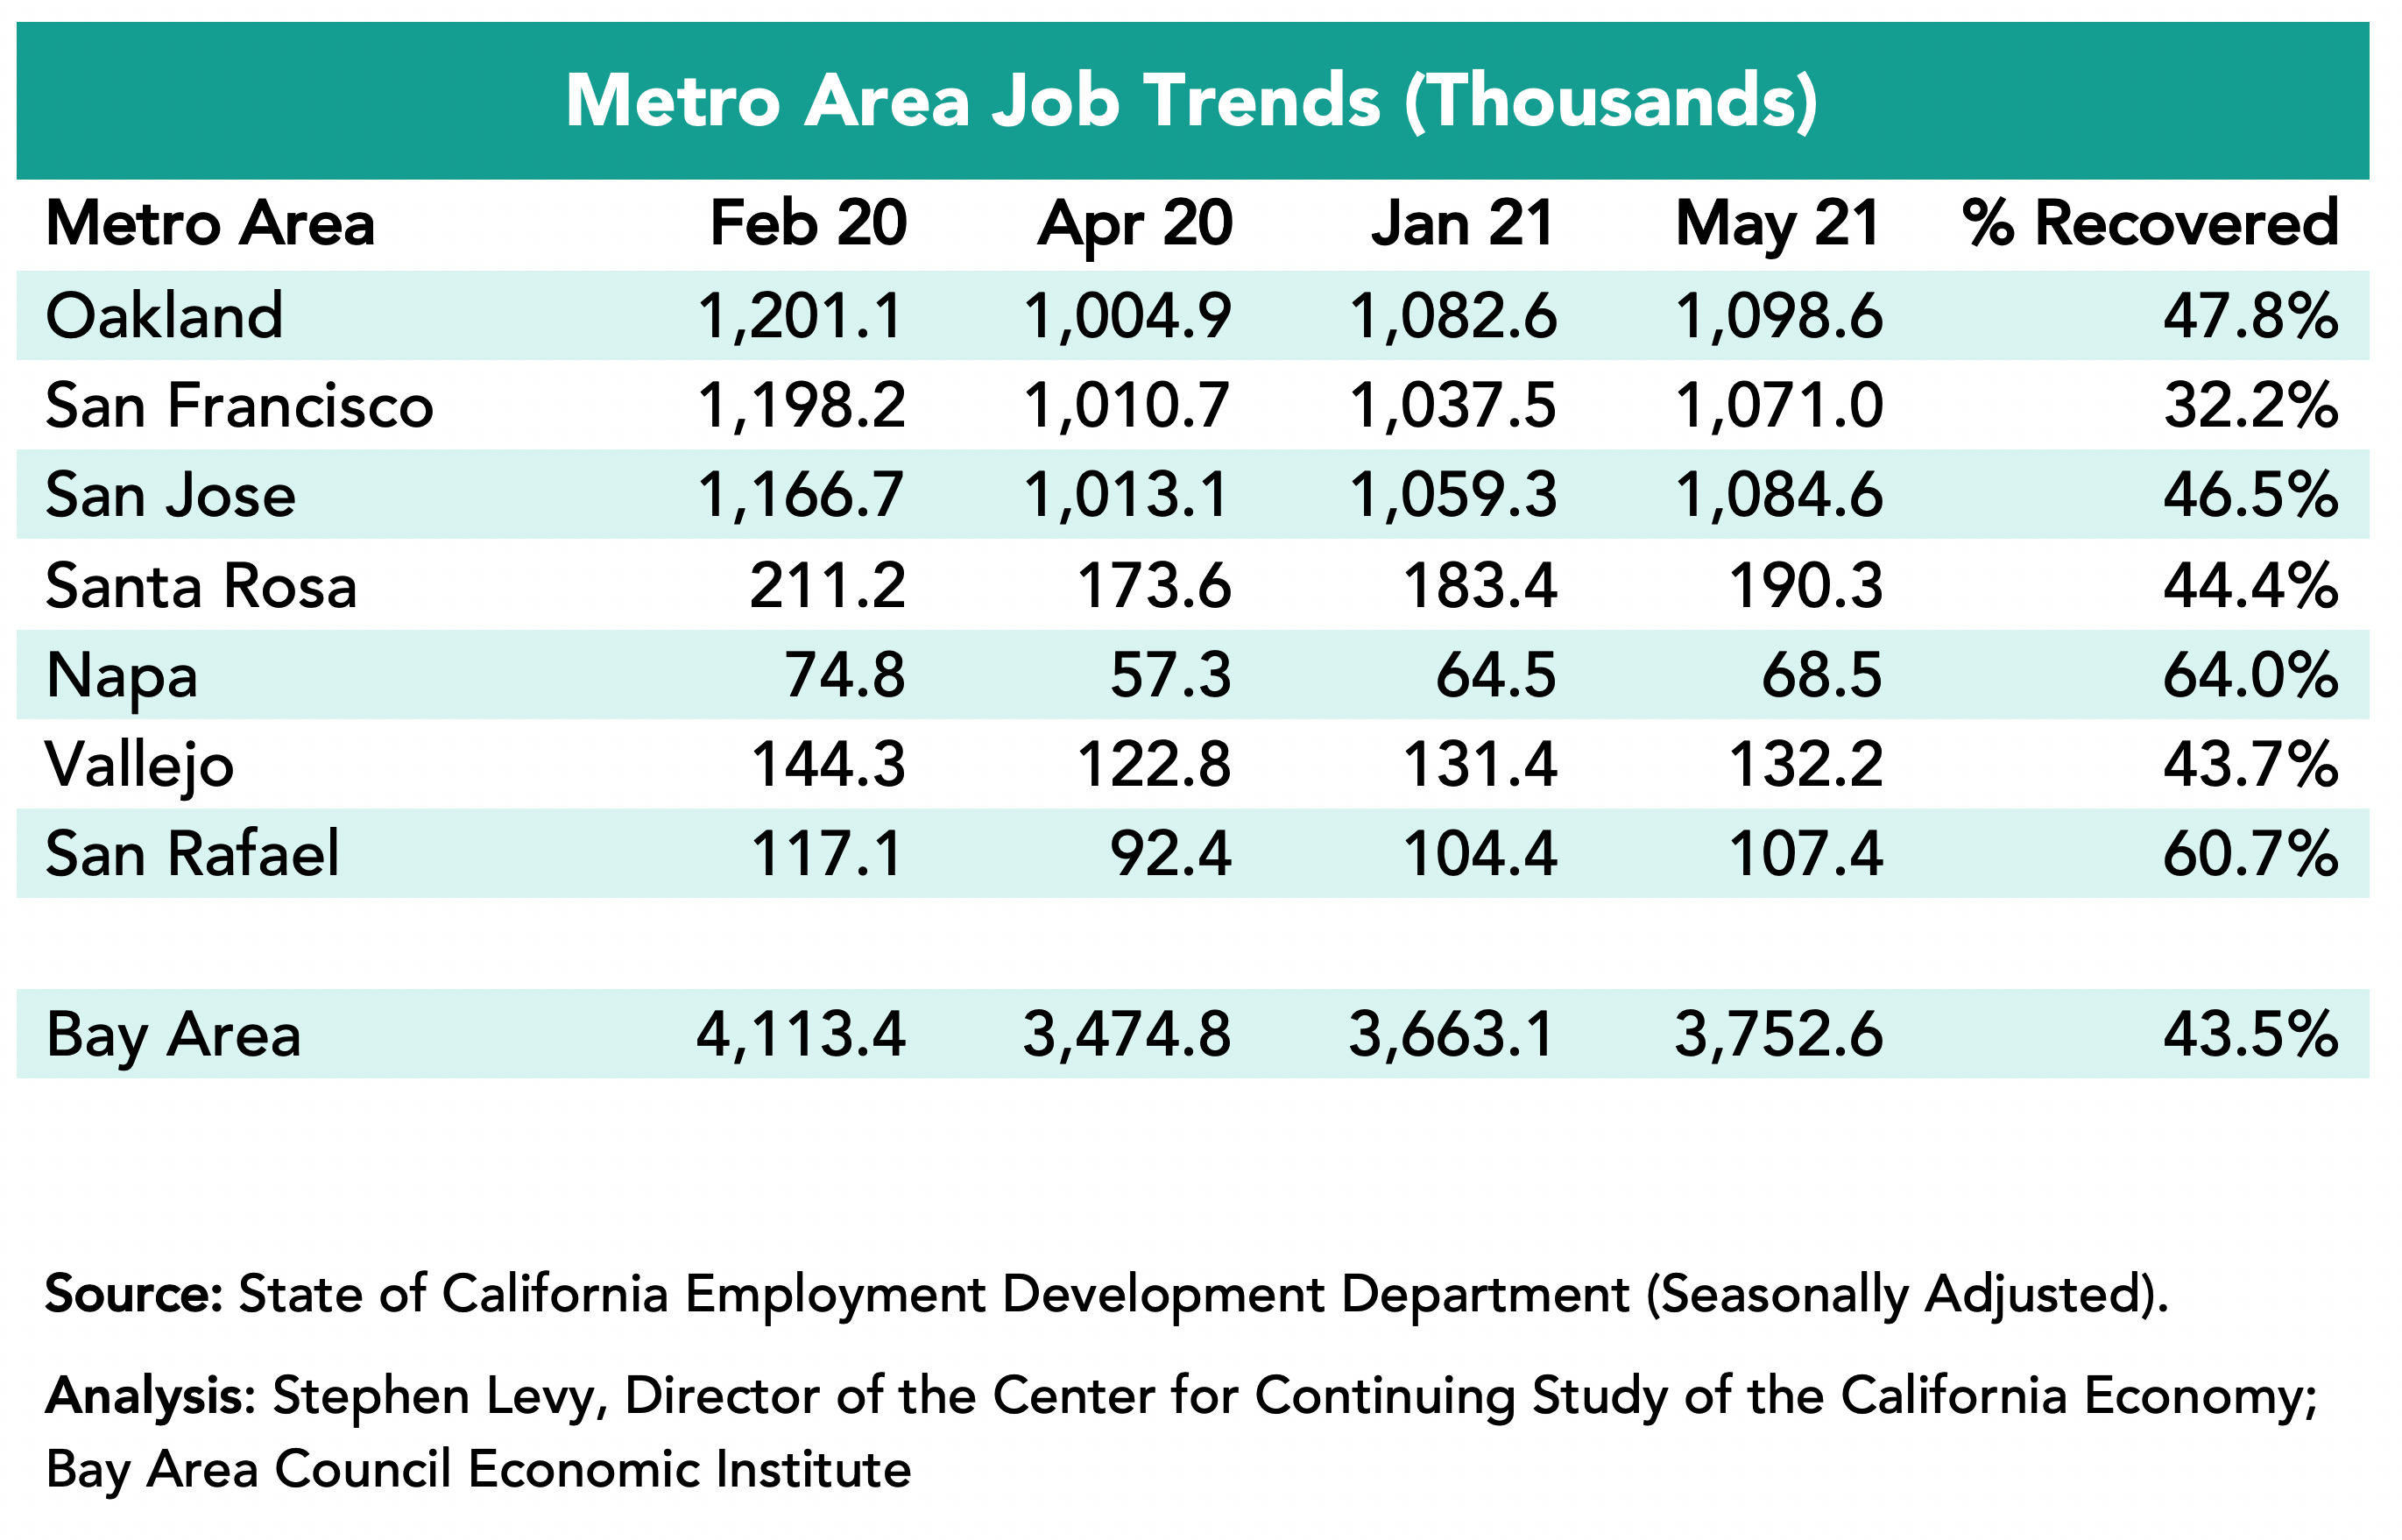
Job Growth is Steady but Disappointing Compared to the Nation
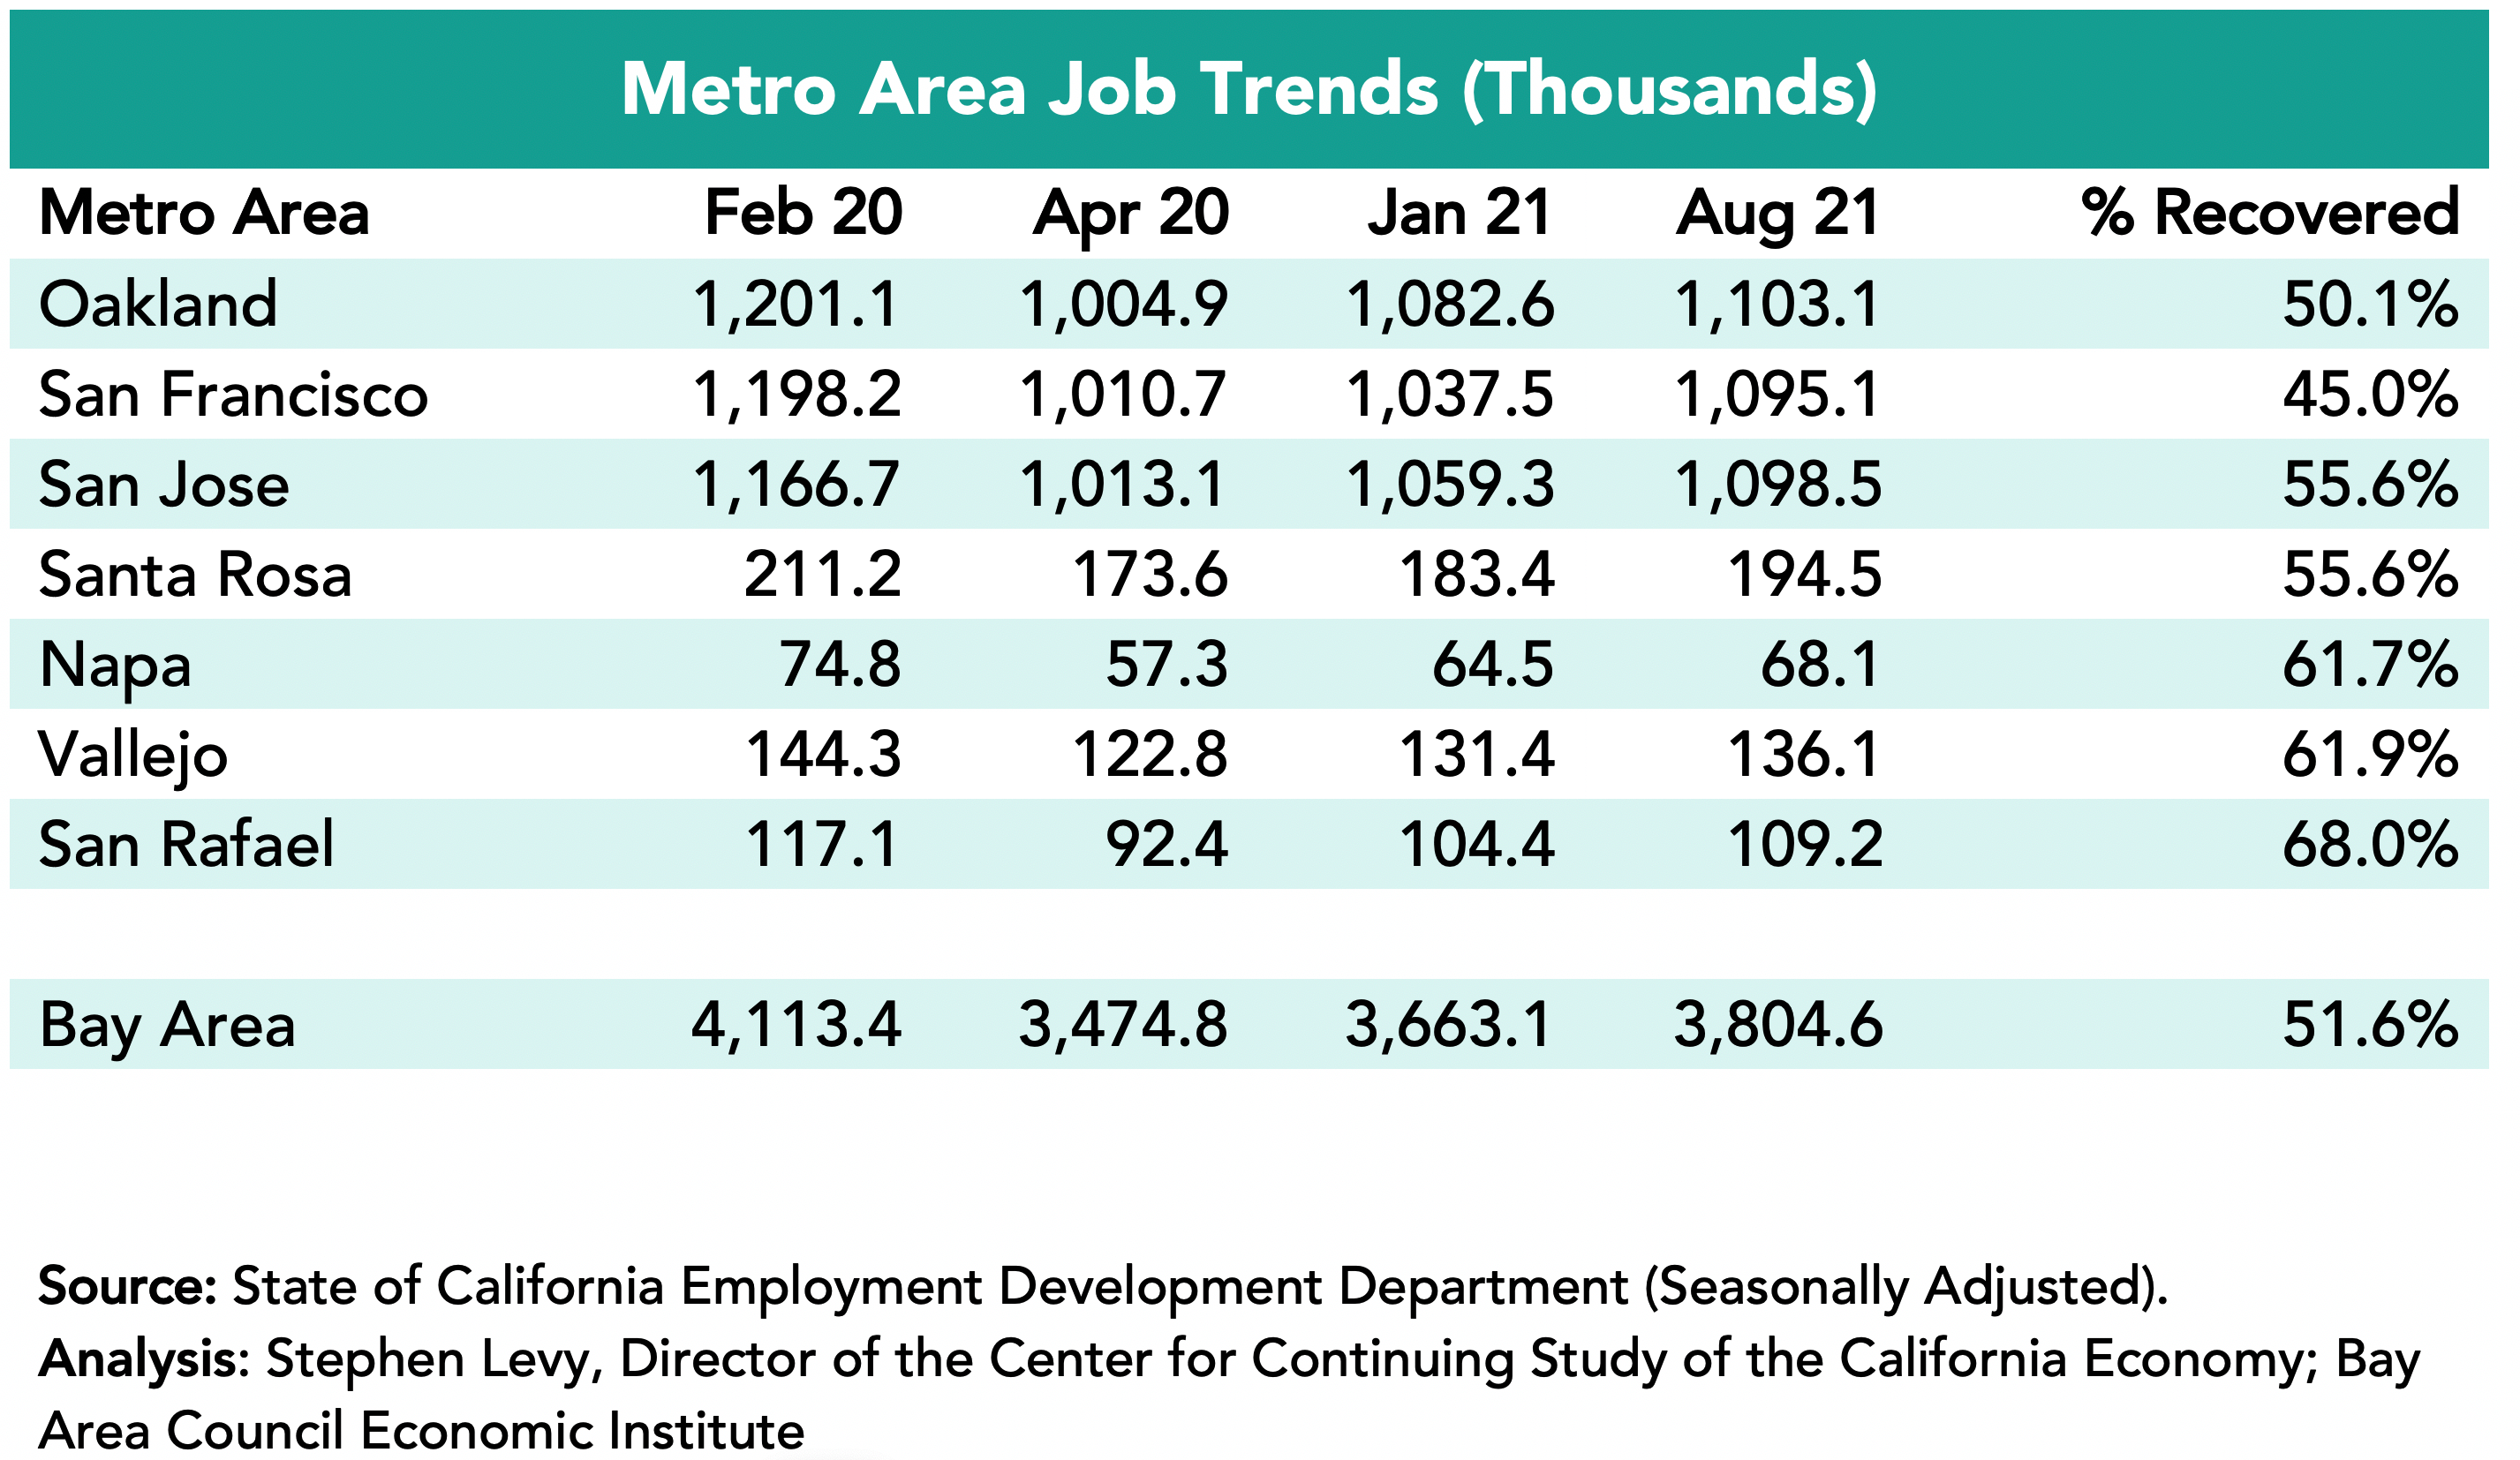
The Bay Area added 141,500 jobs since January 2021 led by a gain of 57,600 in the San Francisco metro area though SF has recovered just 45.0% of the jobs lost between February and April 2020 as job gains are offset by companies moving jobs out of SF. The San Jose metro area added 39,200 jobs but by August had recovered only 55.6% of the jobs lost between February and April 2020. The Napa, Vallejo and San Rafael metro areas had the largest % job recovery by August 2021.
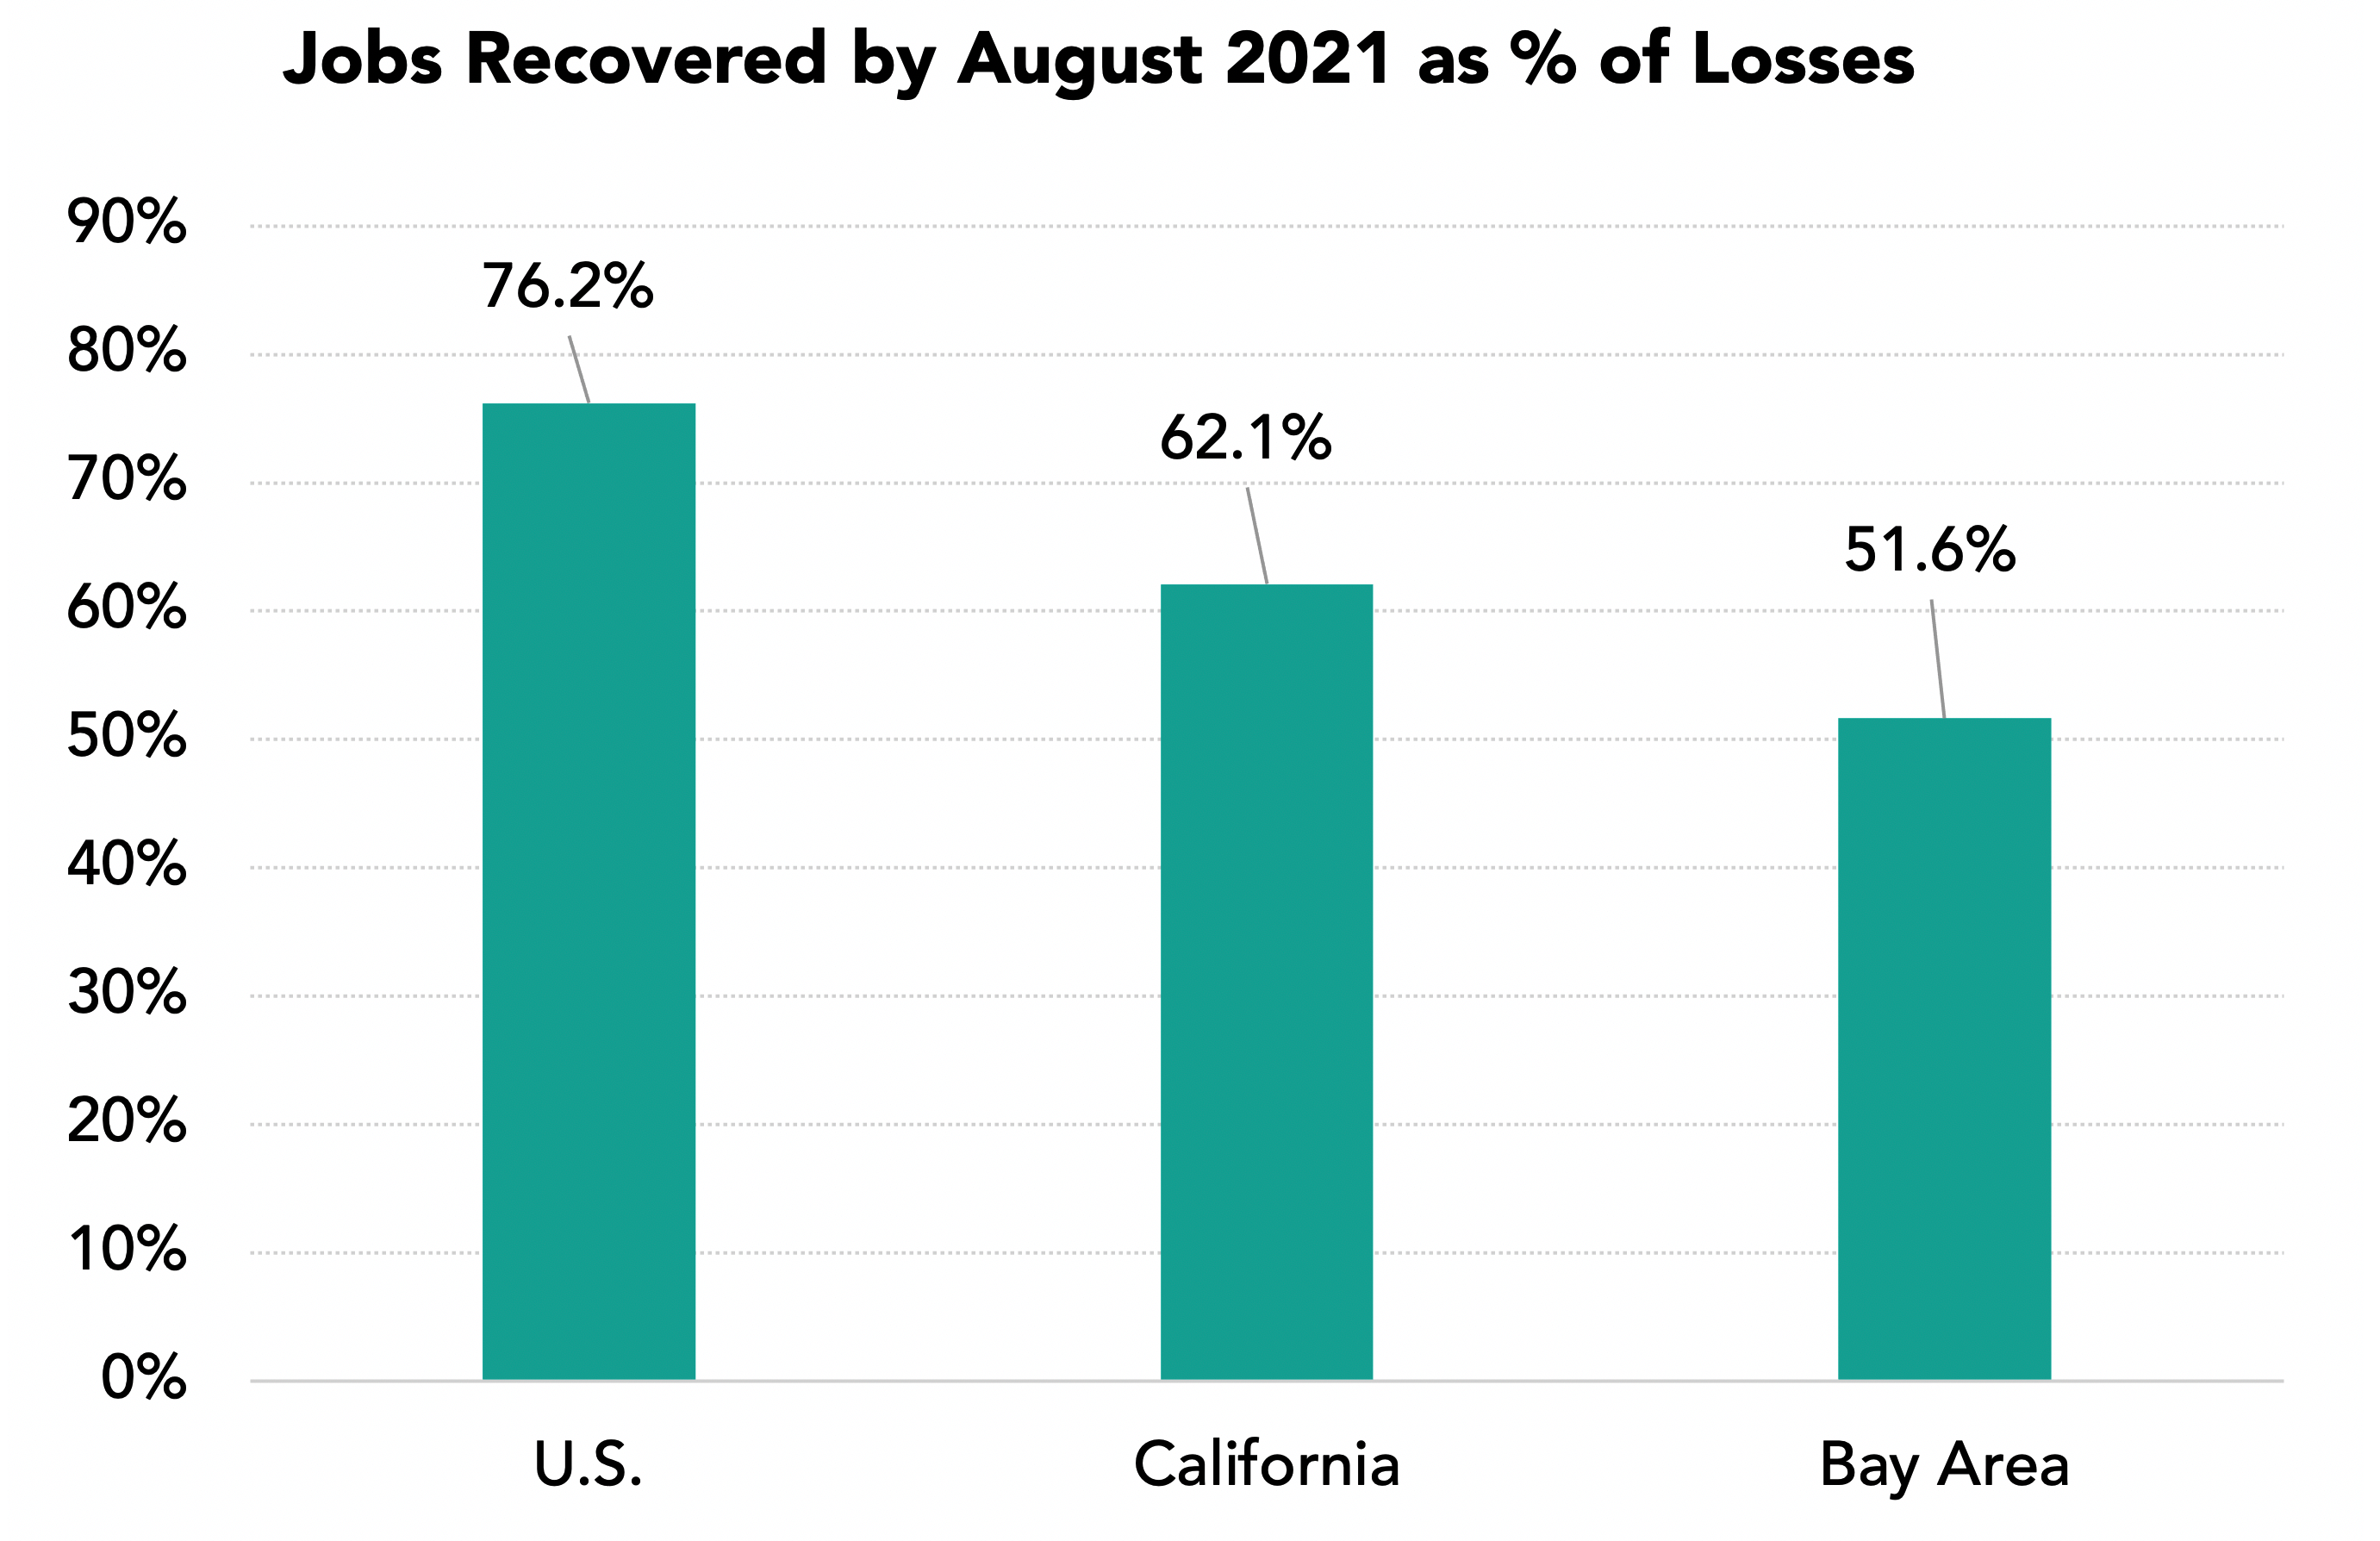
The Bay Area Had Recovered Just 51.6% of Lost Jobs by August 2021 Yet VC Funding is Surging and Tech Jobs Are Above Pre-Pandemic Levels
In August 2021 the Bay Area had recovered 51.6% of the jobs lost between February and April 2020 up from 29.4% in January. The state had recovered 62.1% up from 34.0% while the nation had recovered 76.2% of lost jobs up from 55.4%. At the same time VC funding in the first half of 2021 was $48.1 billion, the highest first half on record and 35% of a record $139 billion nationally.
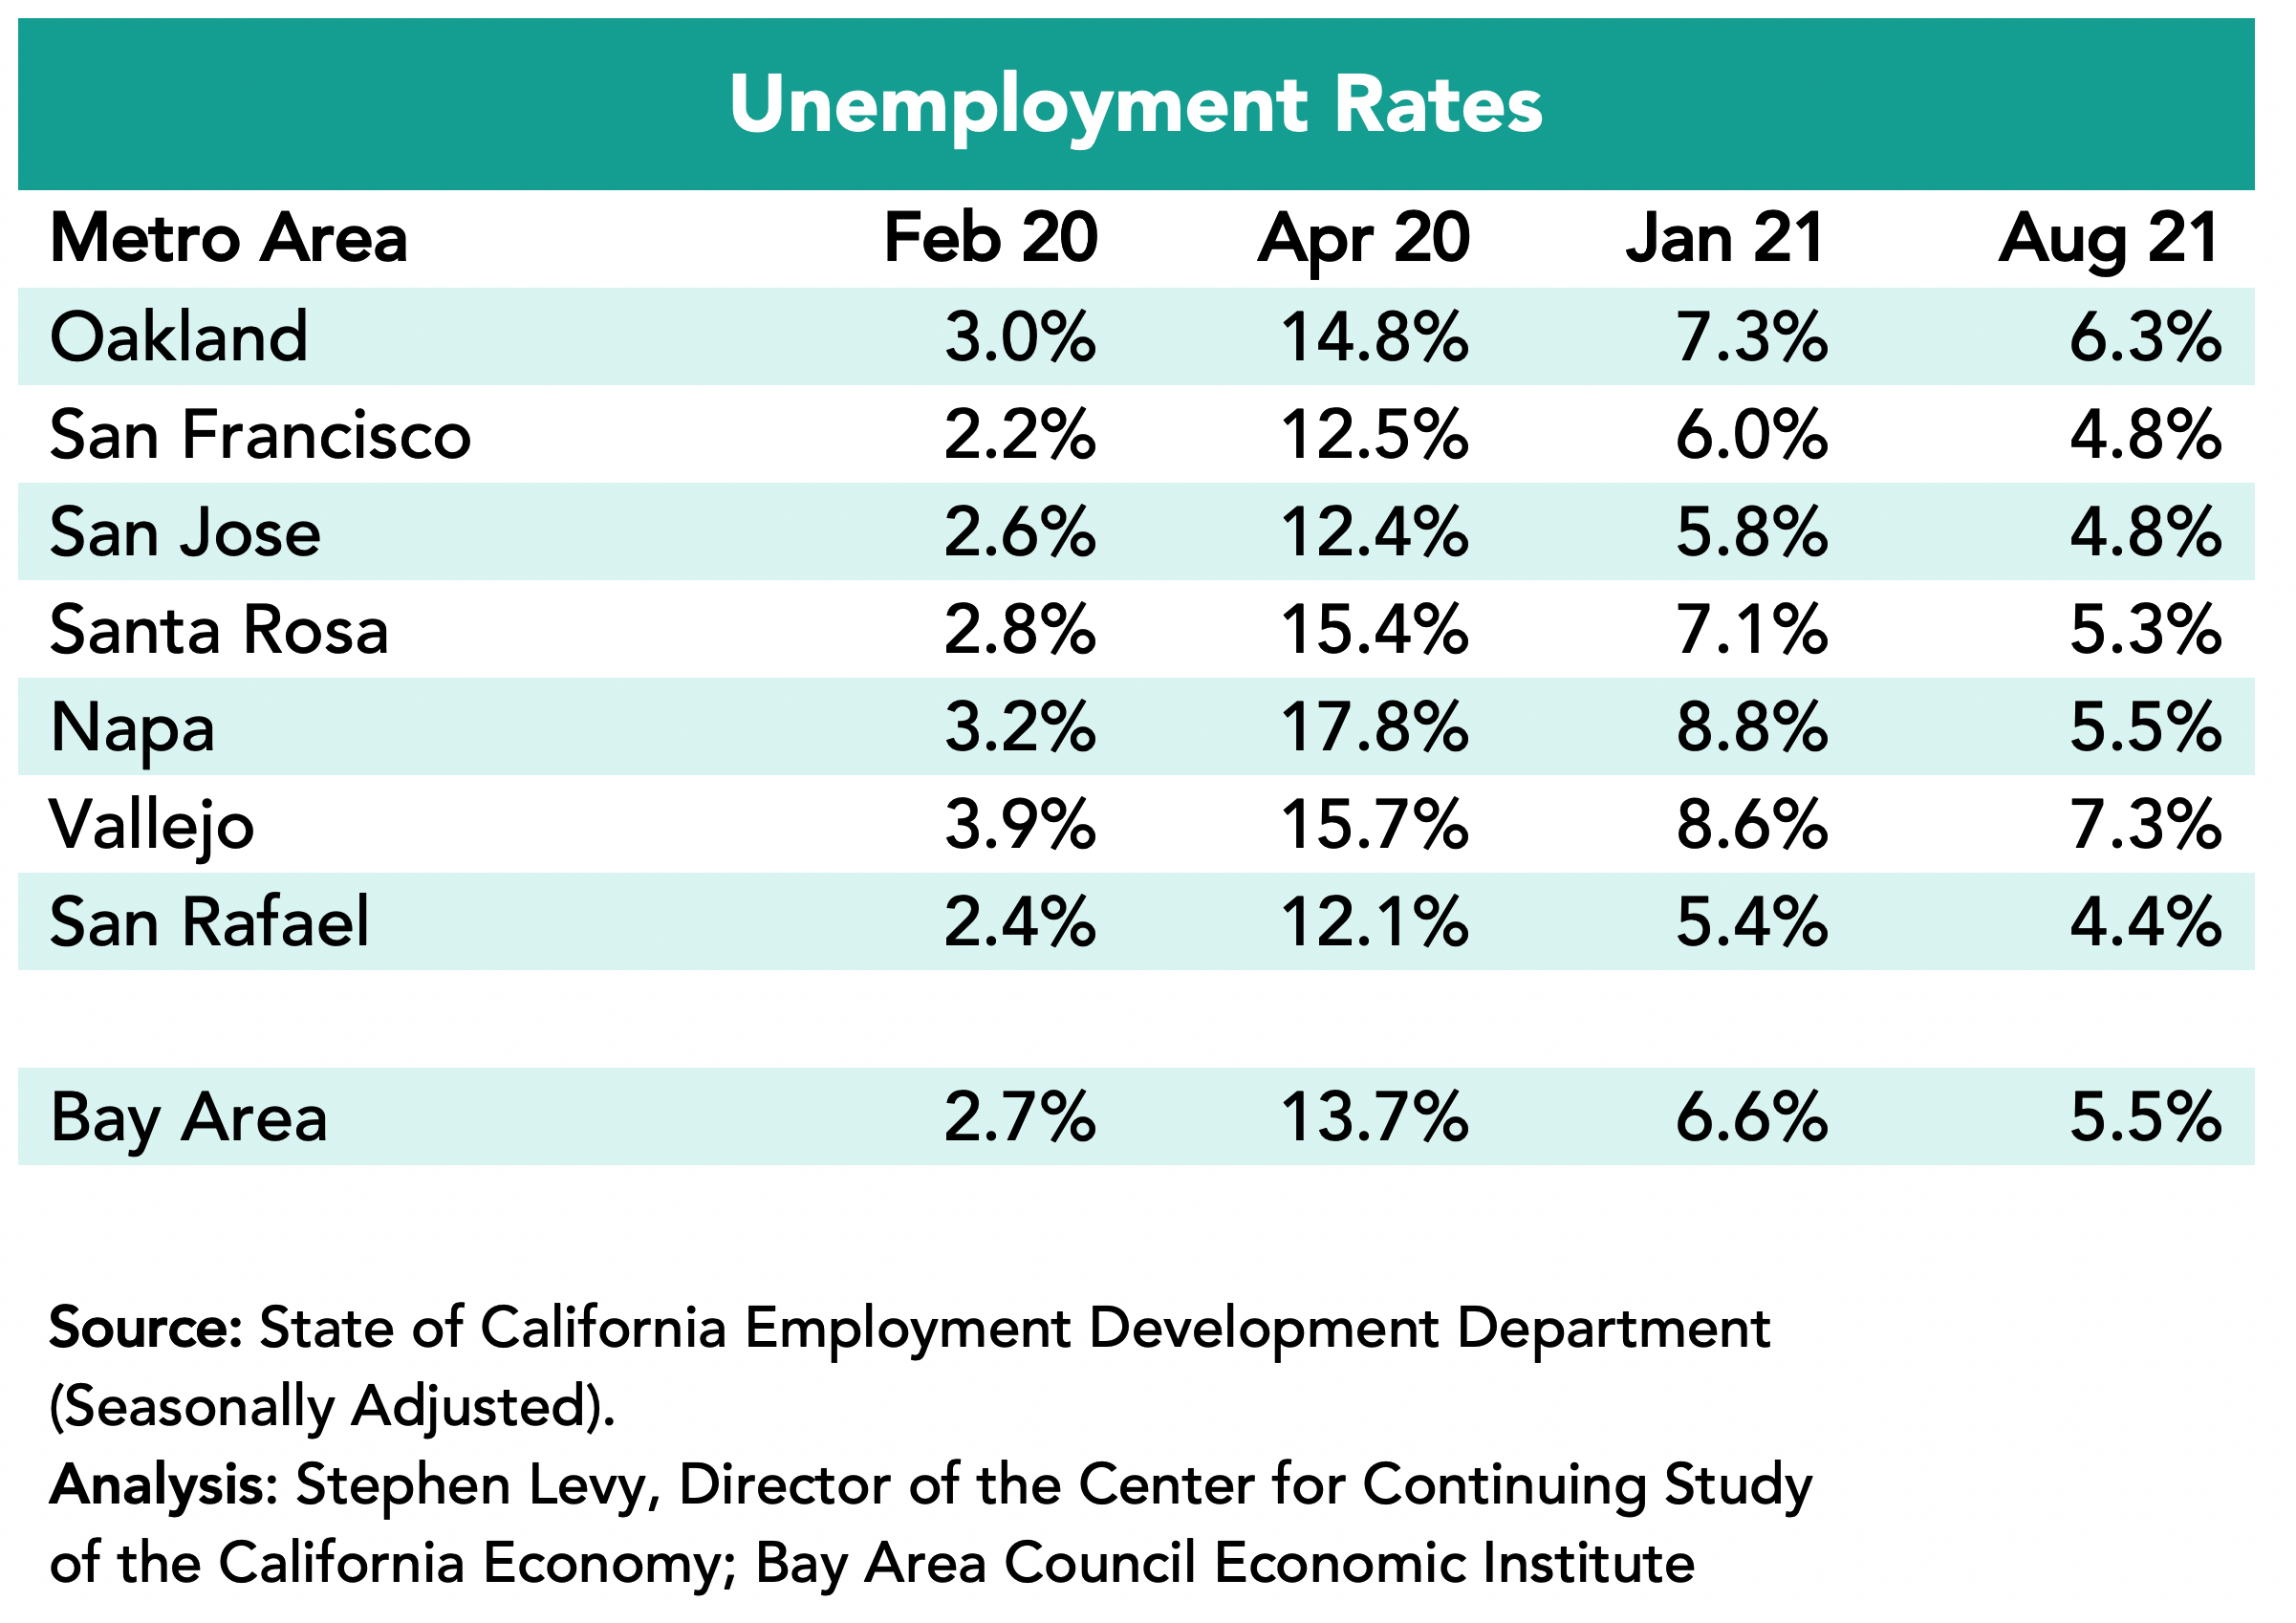
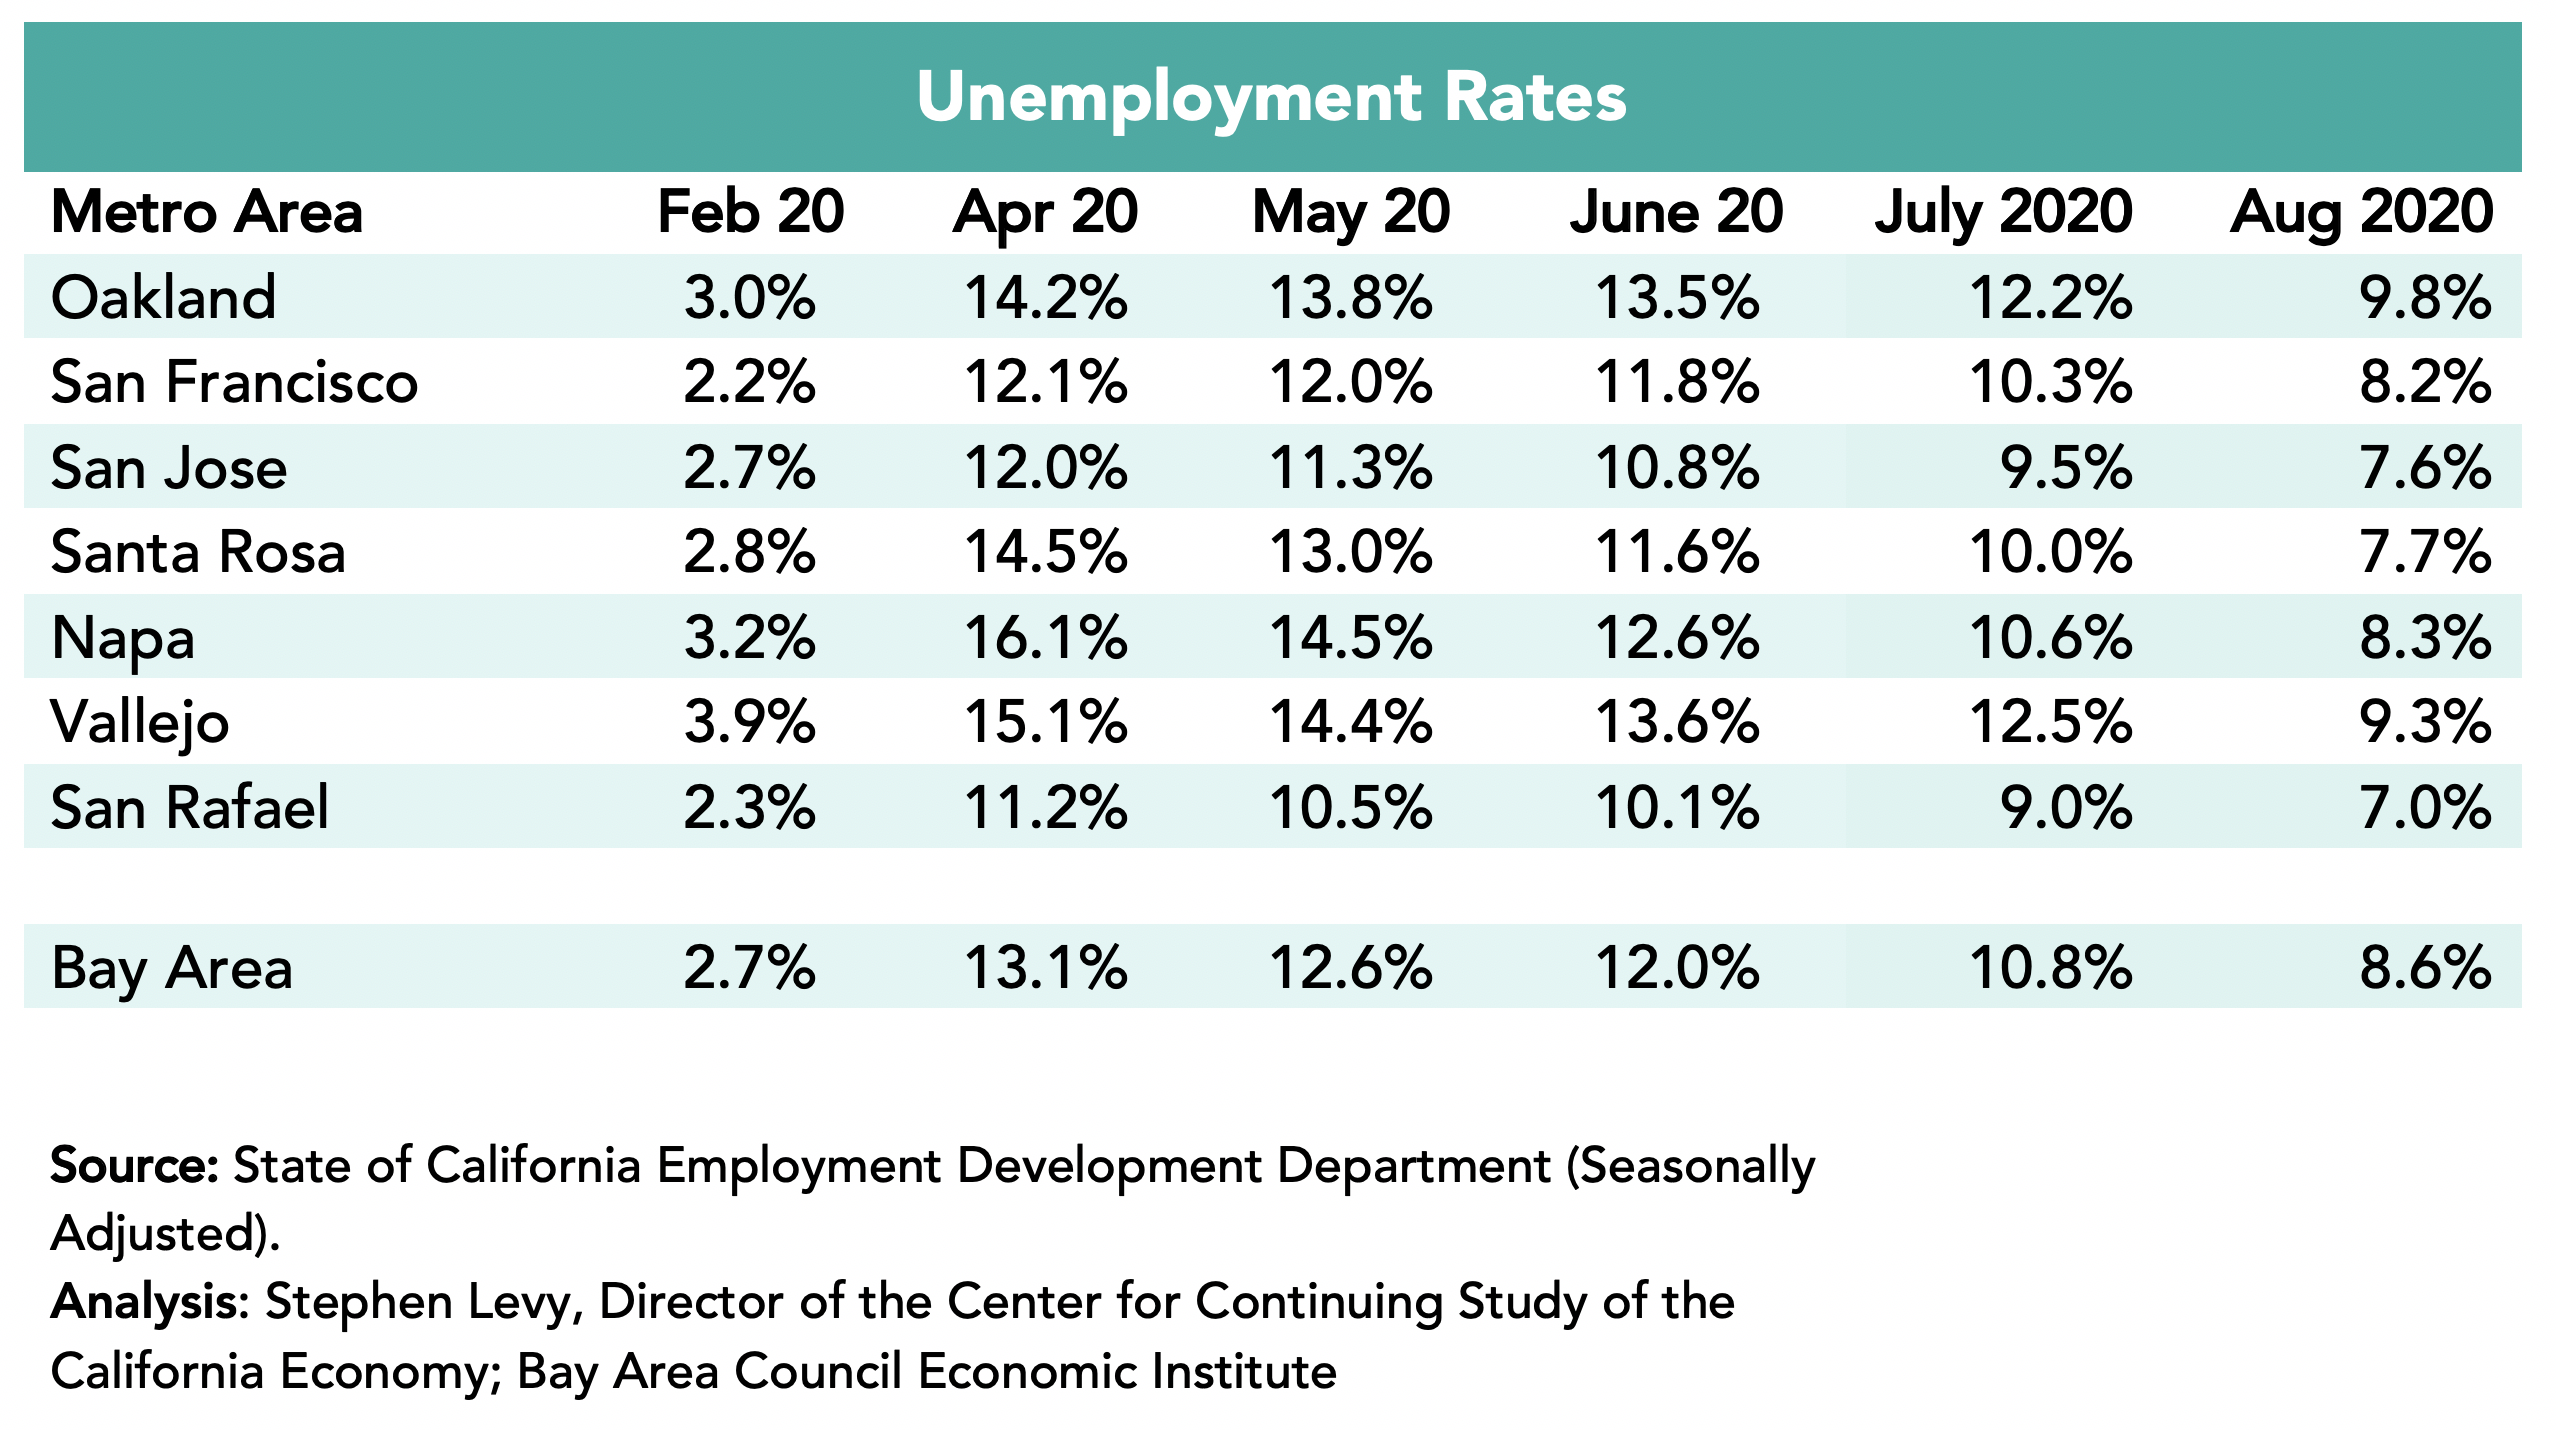
Unemployment Rates Fell to 5.5% in the Region in August 2021 from 6.6% in January 2021.
The lowest rates were in the San Rafael metro area (4.4%) followed by the San Francisco and San Jose metro areas (4.8%) in August 2021. Unemployment rates jump in the summer months and then fall in September normally. Bay area rates are well below the state 7.5% unemployment rate.
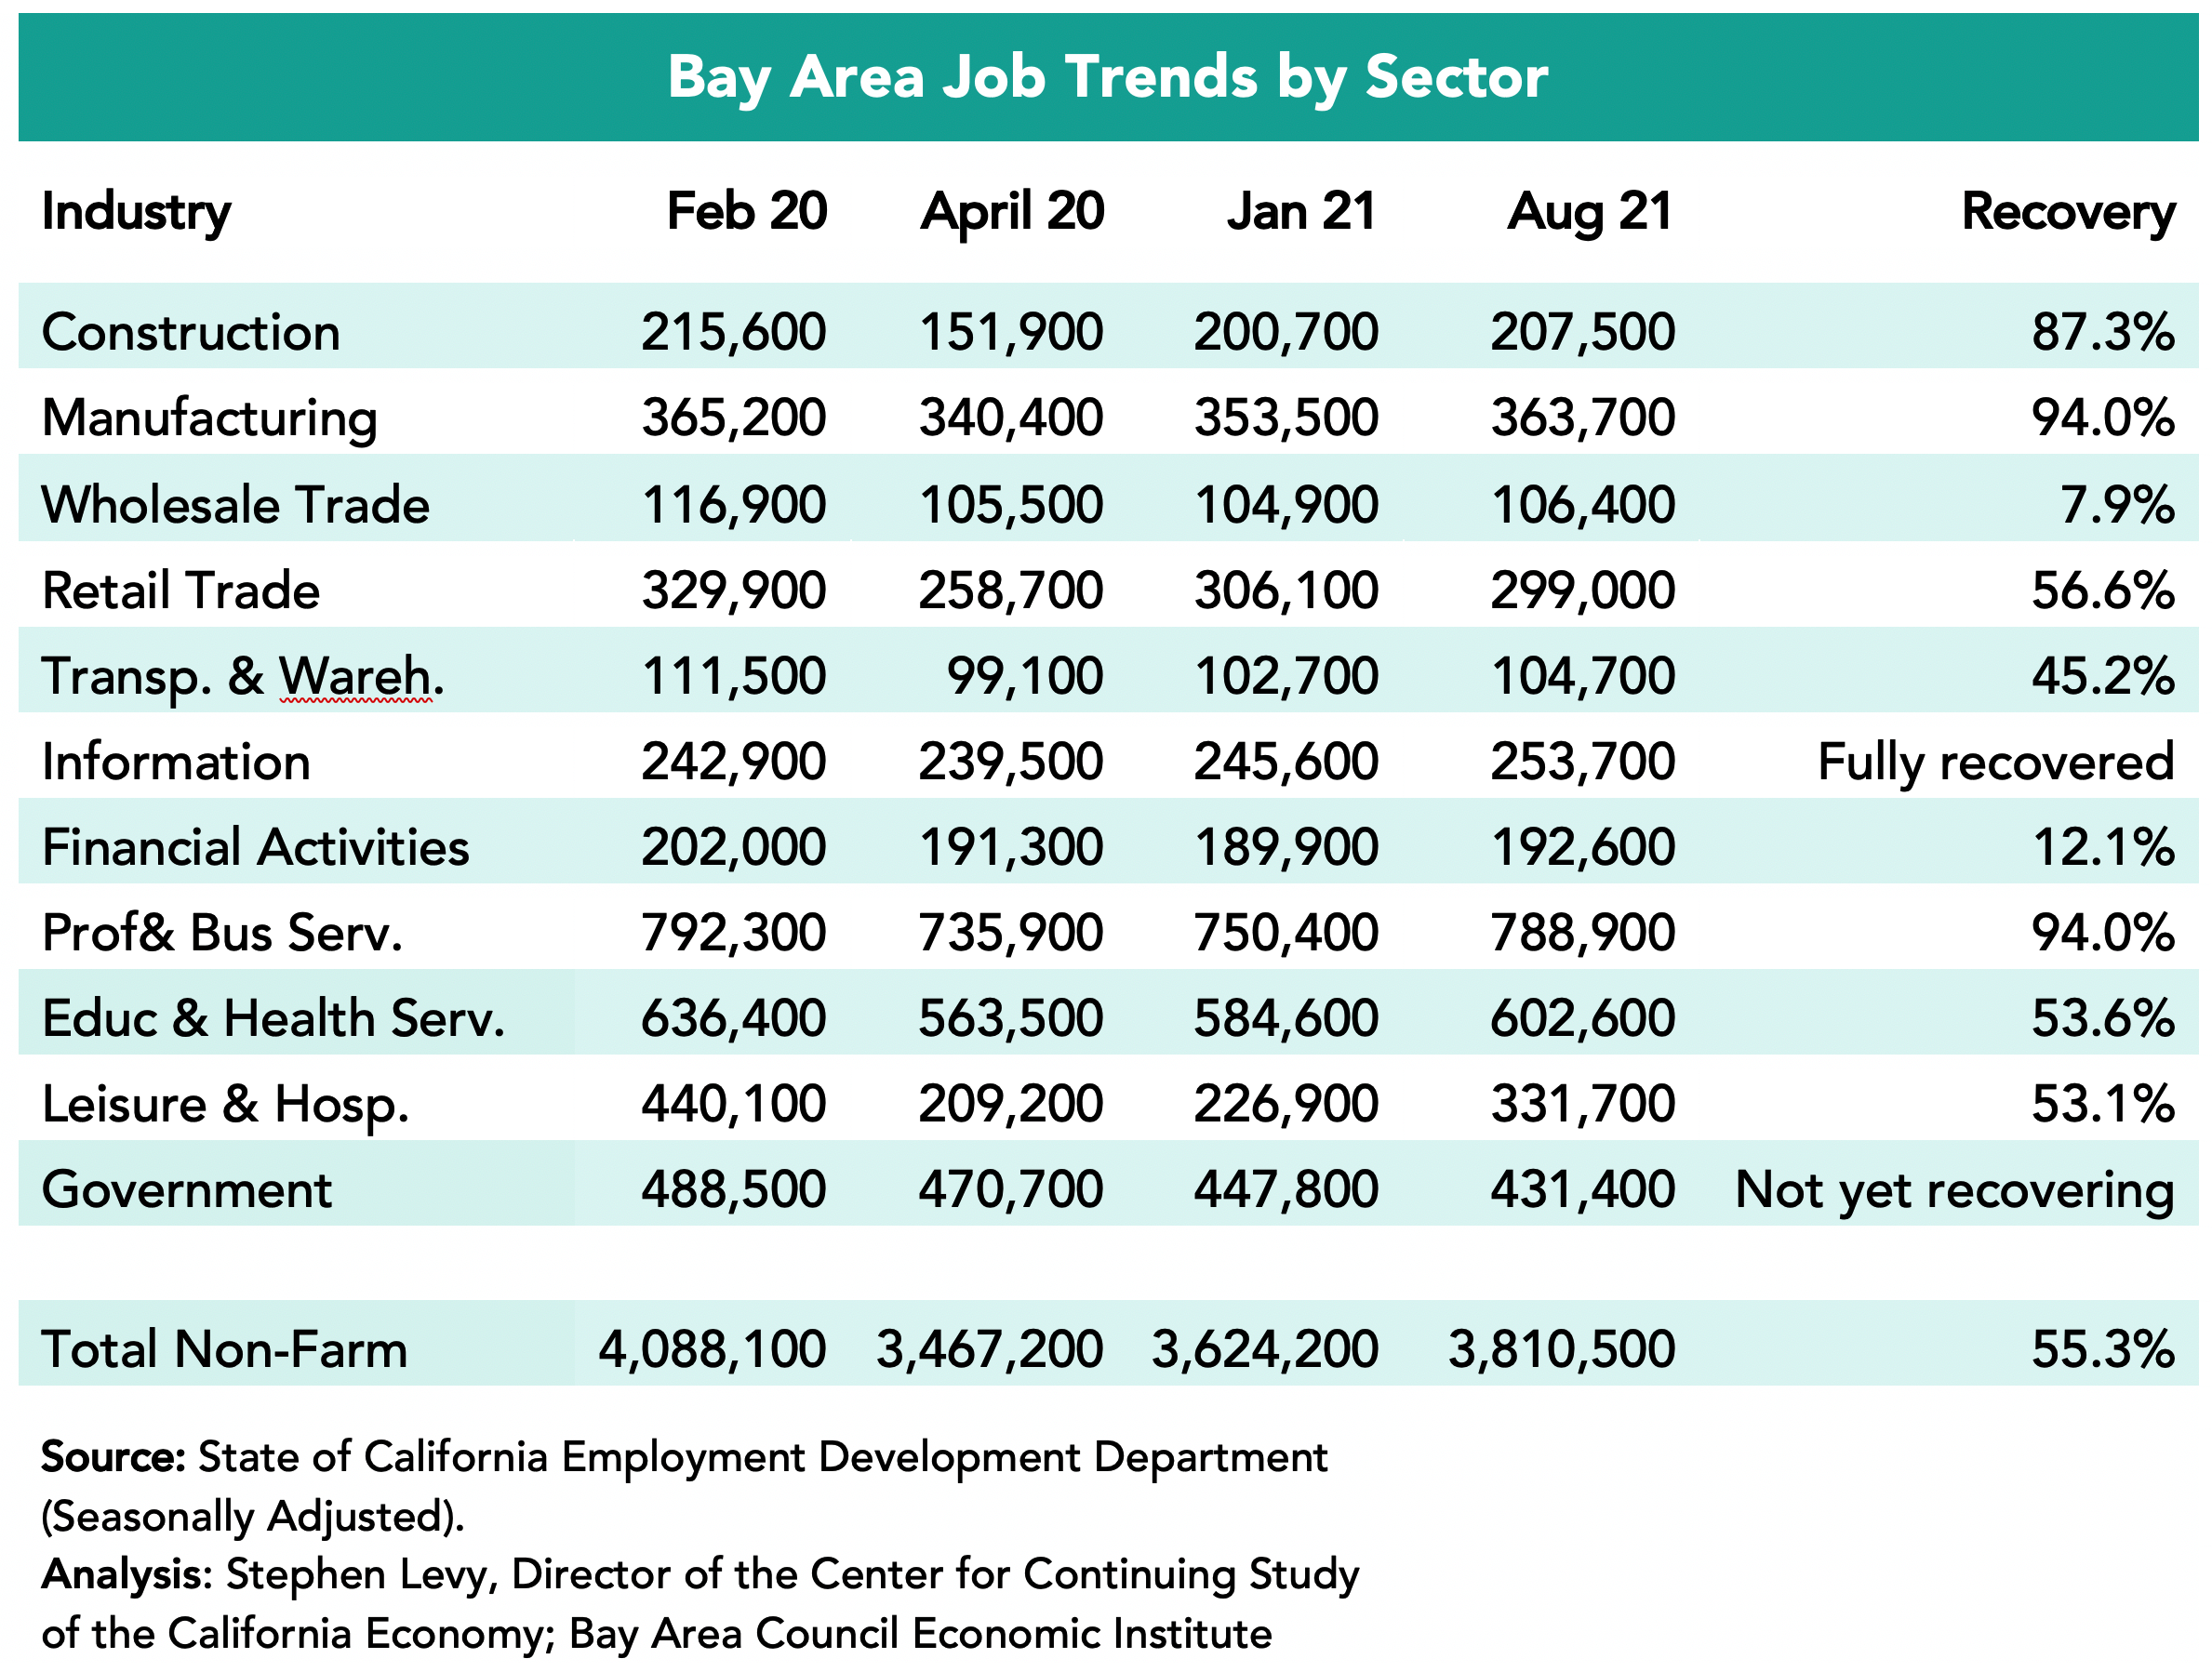
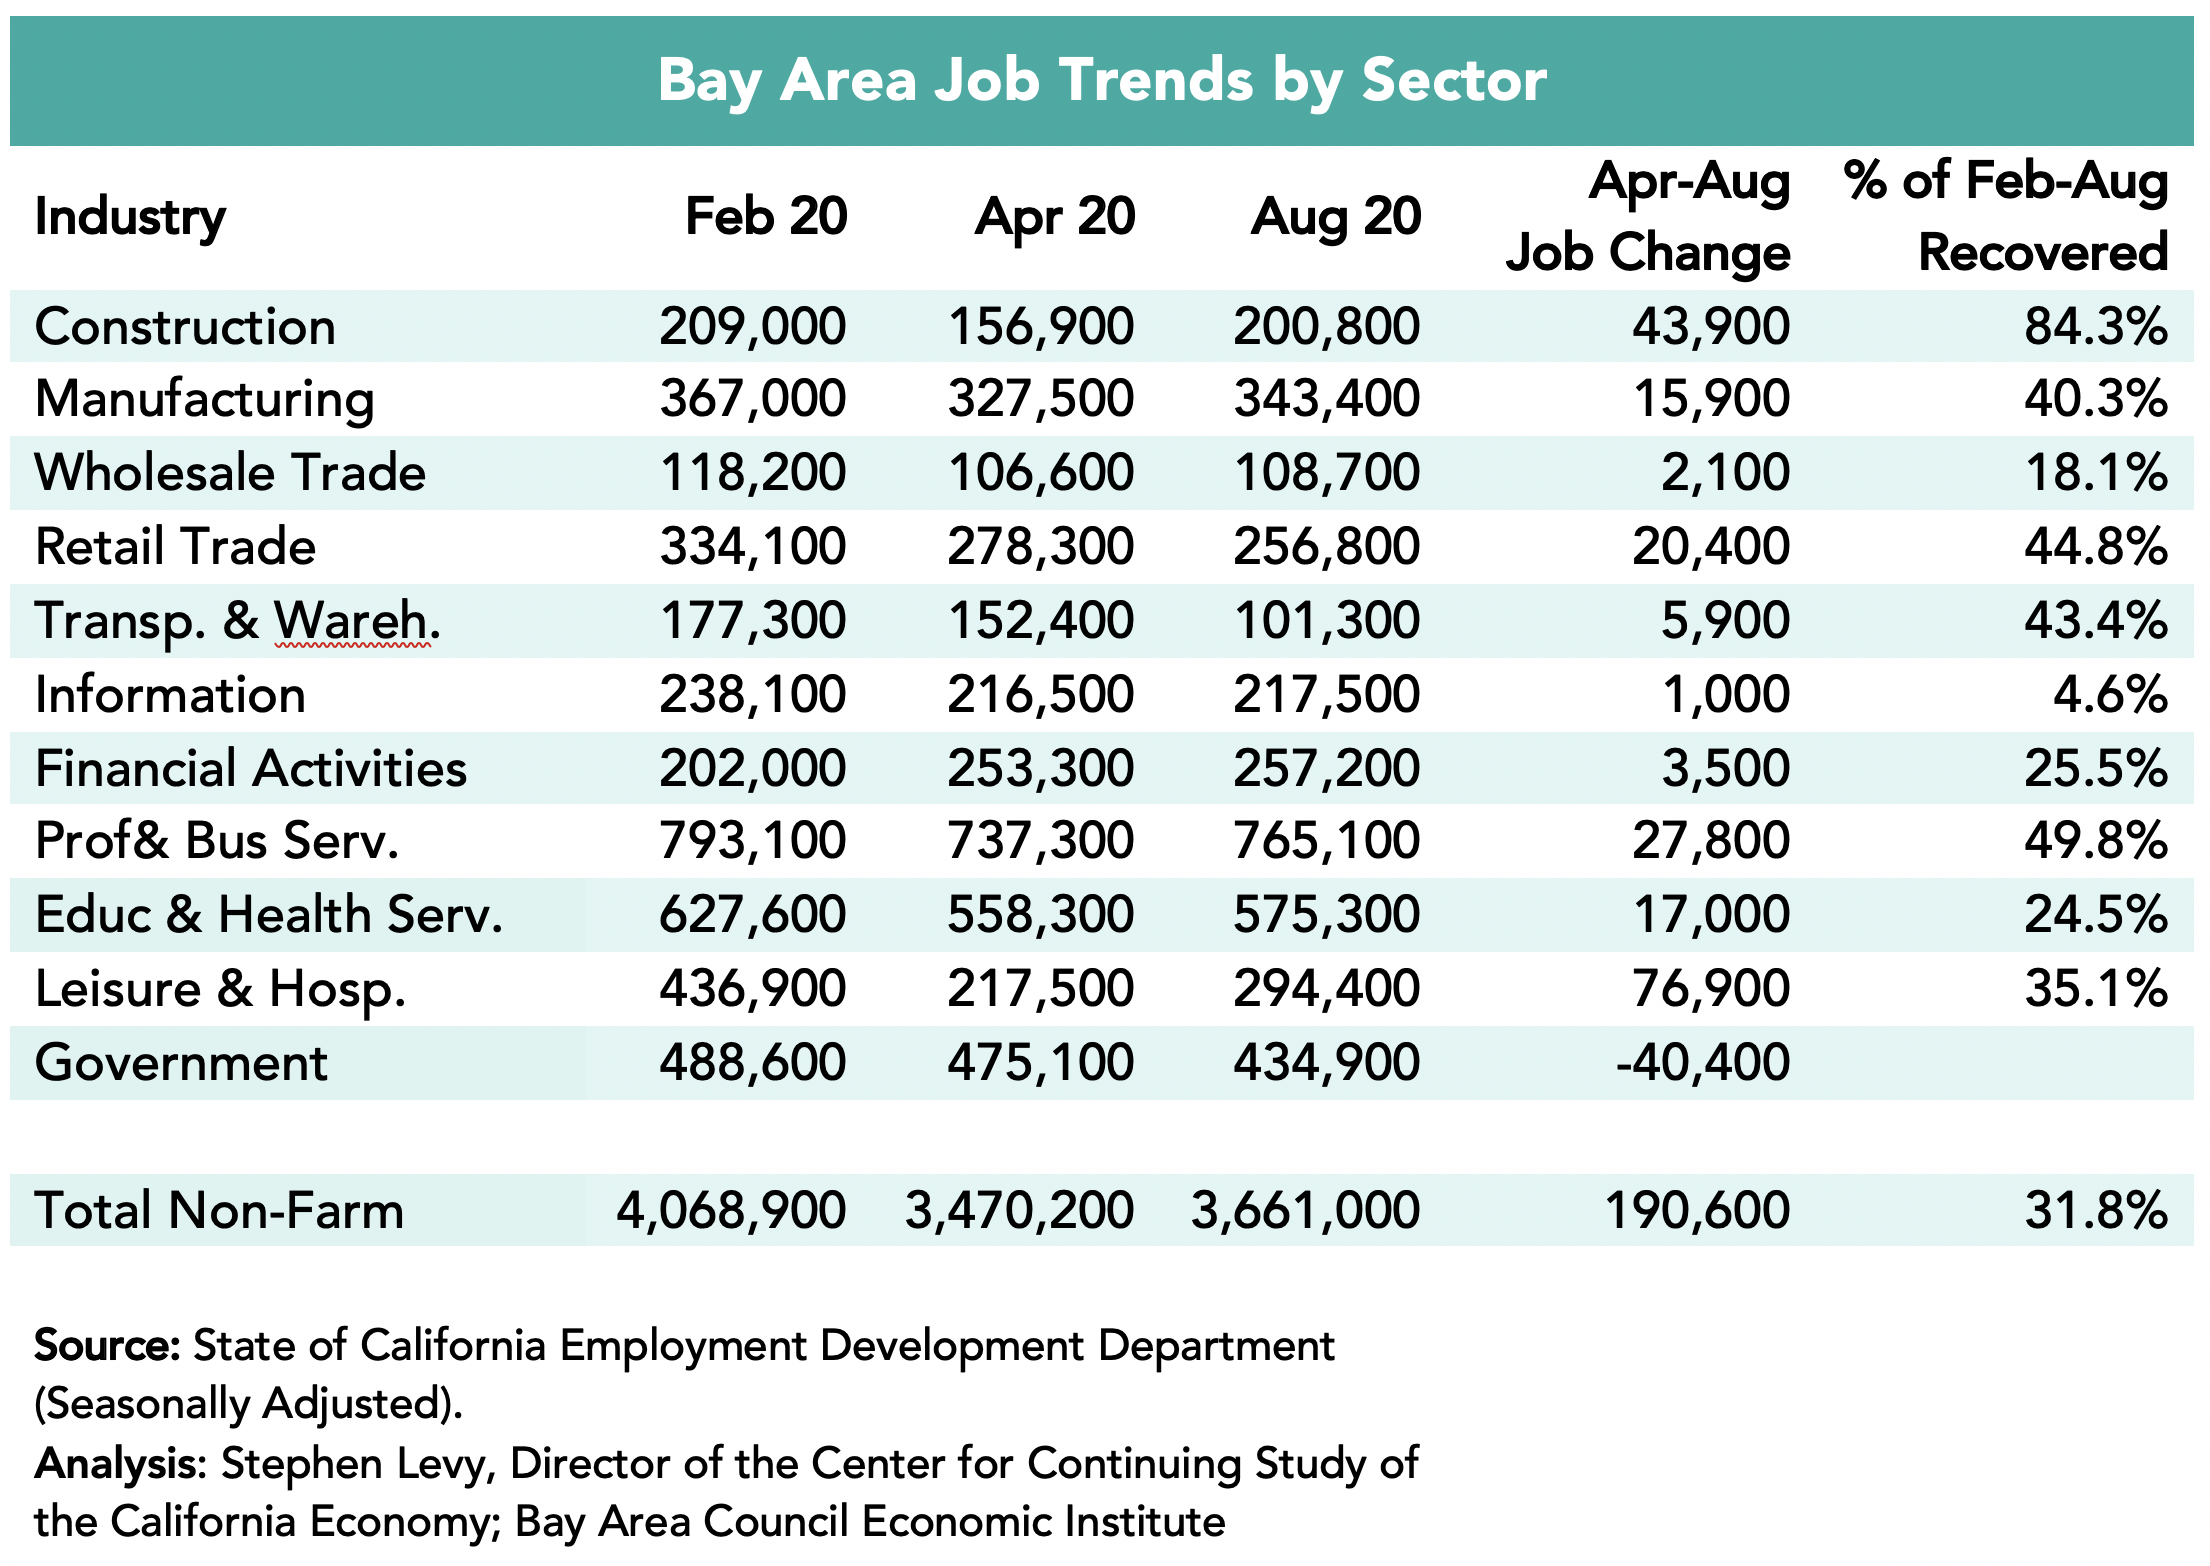
Industries Were Affected Differently
The Information sector actually added a small number of jobs compared to before the pandemic hit. And the Professional & Business Services sector has regained 94% of the lost jobs. On the other hand, the Leisure and Hospitality sector recovered only 53.1% of lost jobs by August 2021 though strong gains were posted these in the past six months. The Government sector has fewer jobs now than in April 2020 though many jobs may be returning as schools and colleges reopen. The Construction and Manufacturing sectors have recovered most of the jobs between February and April 2020.
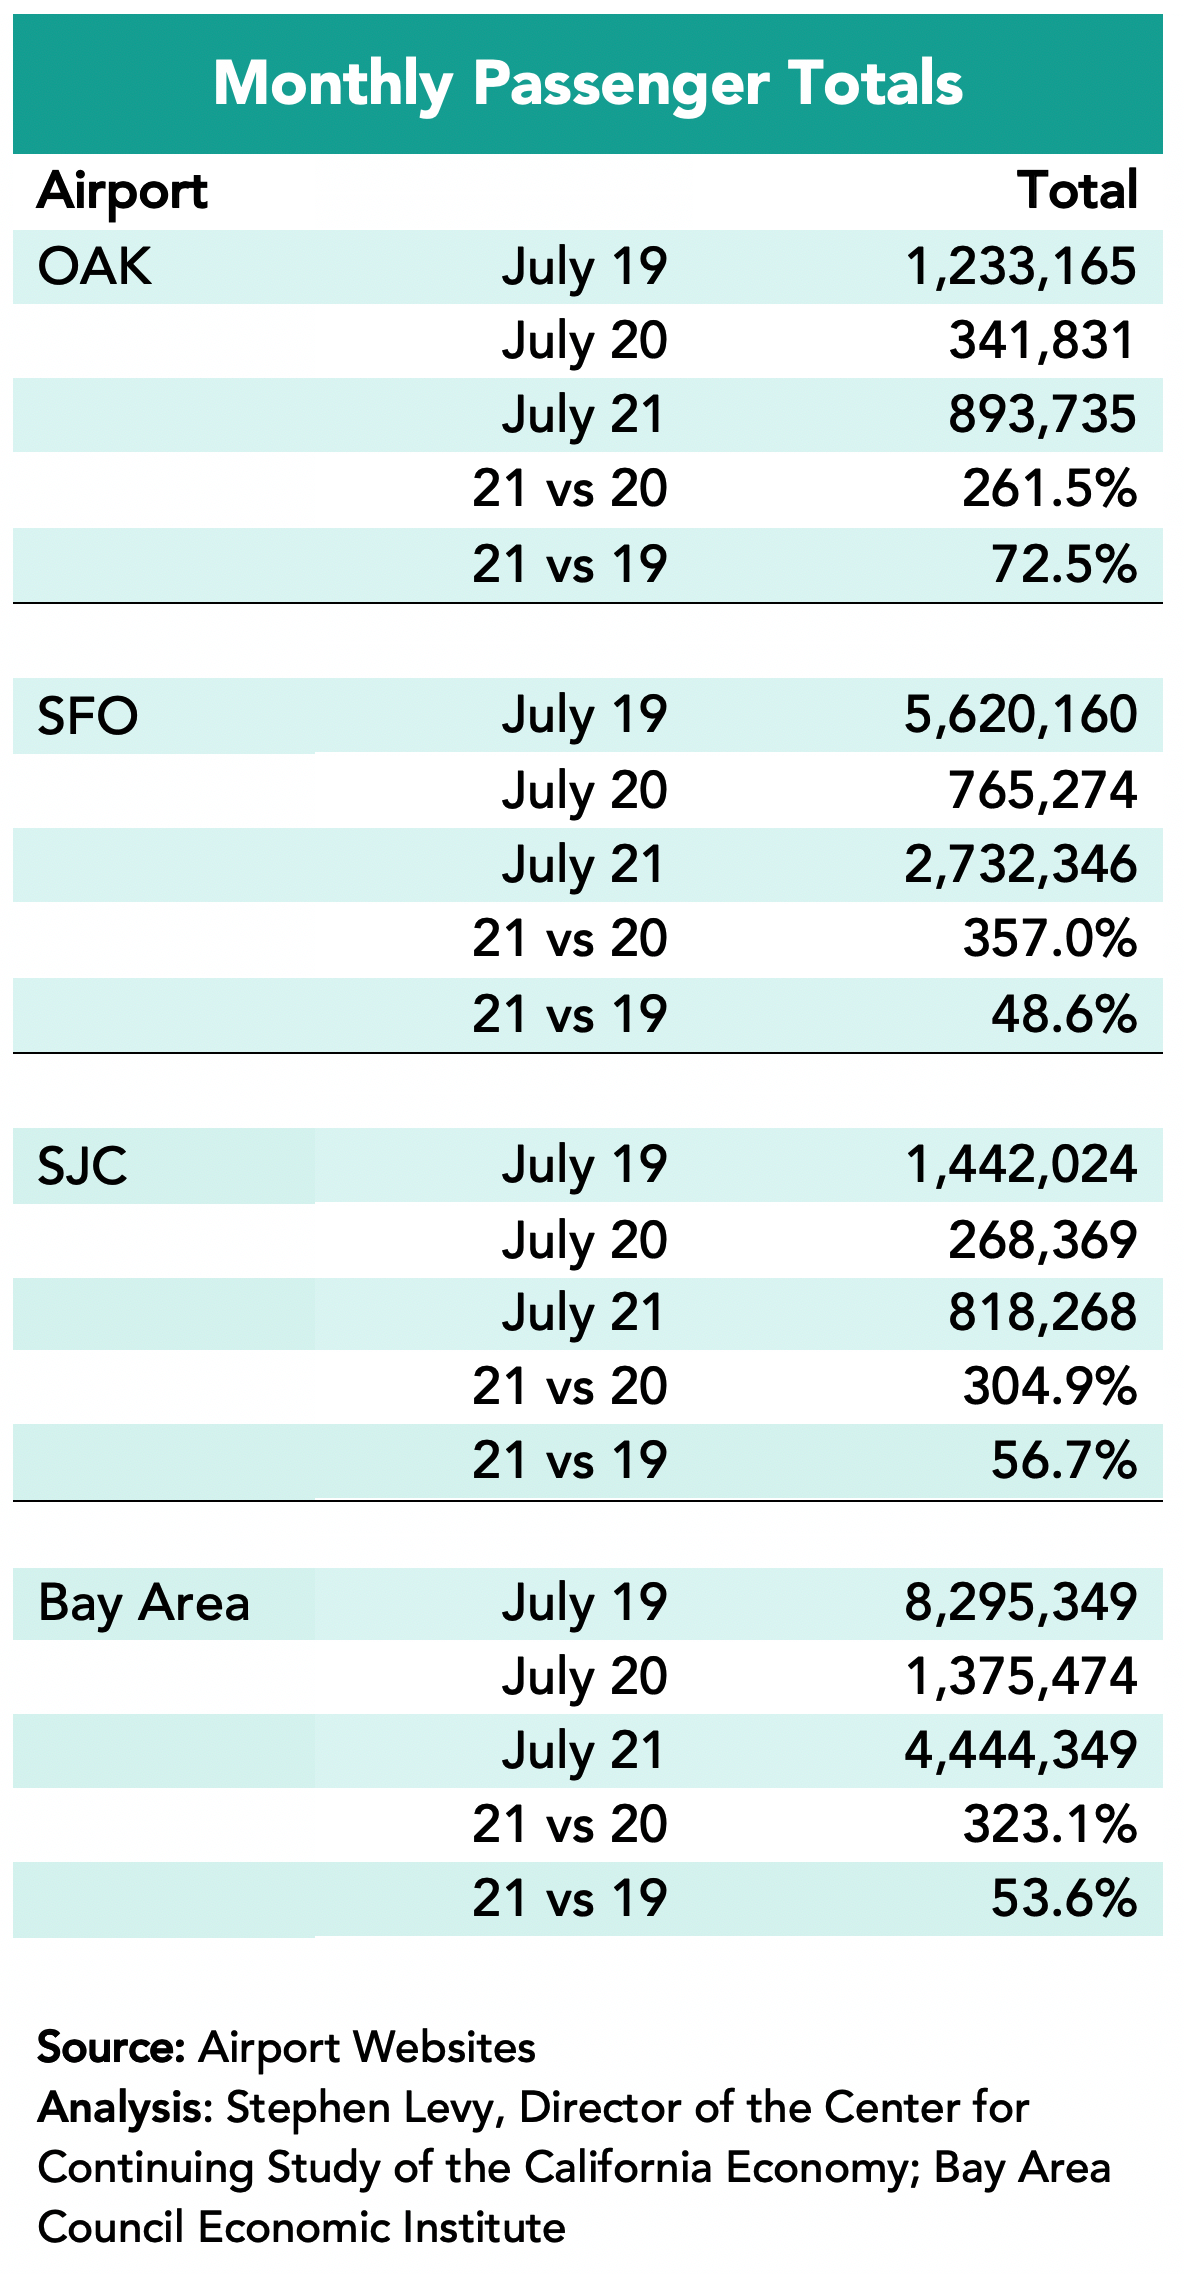
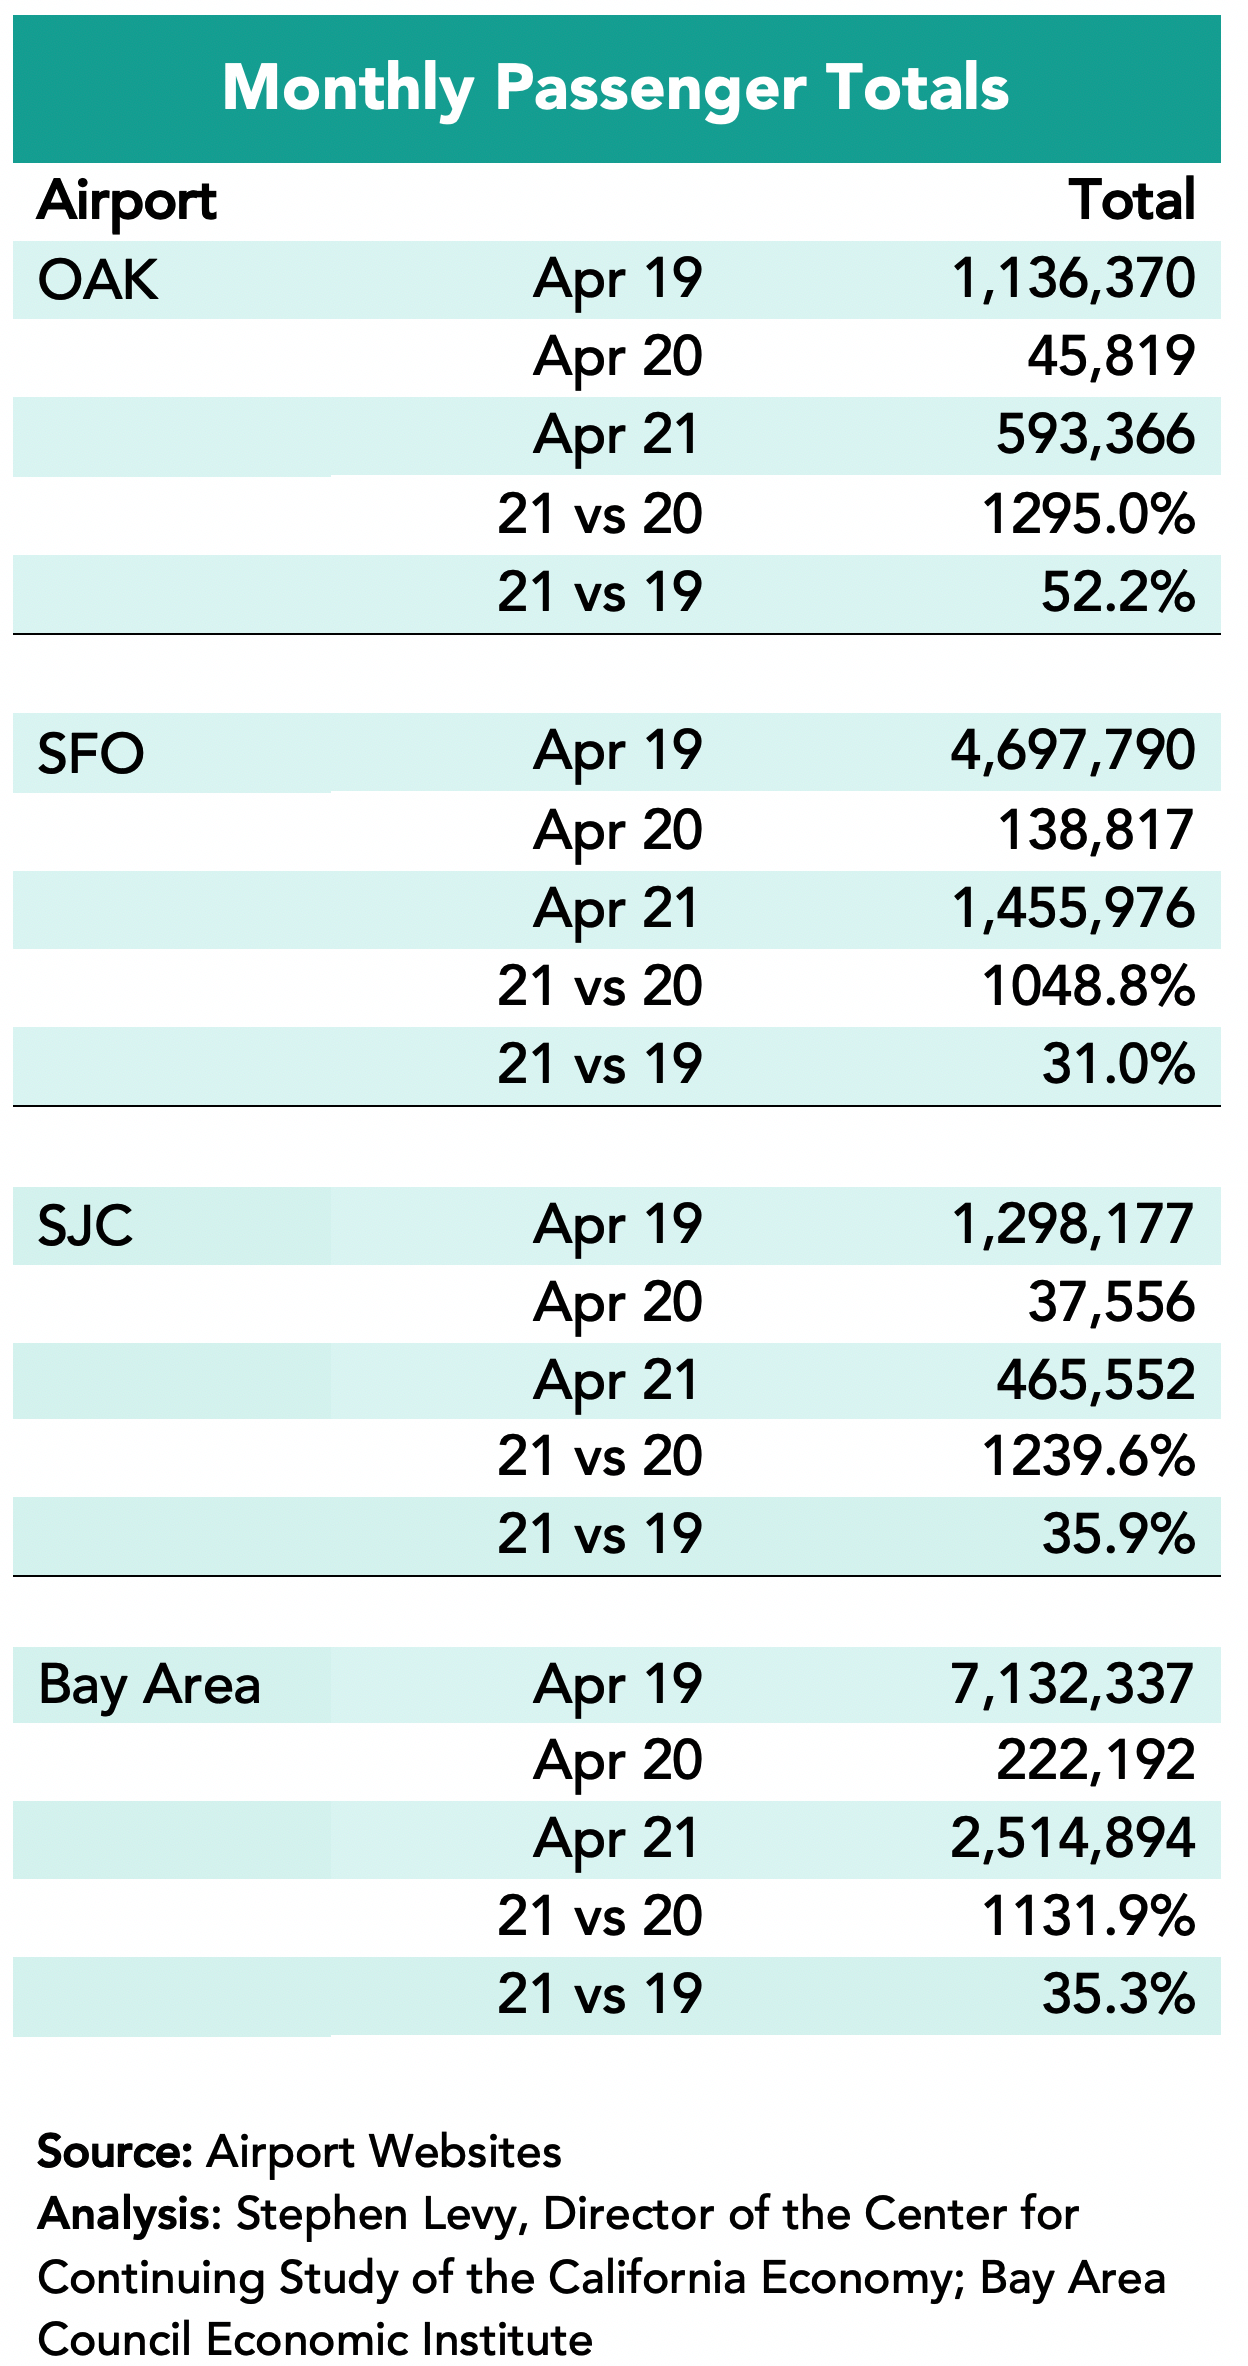
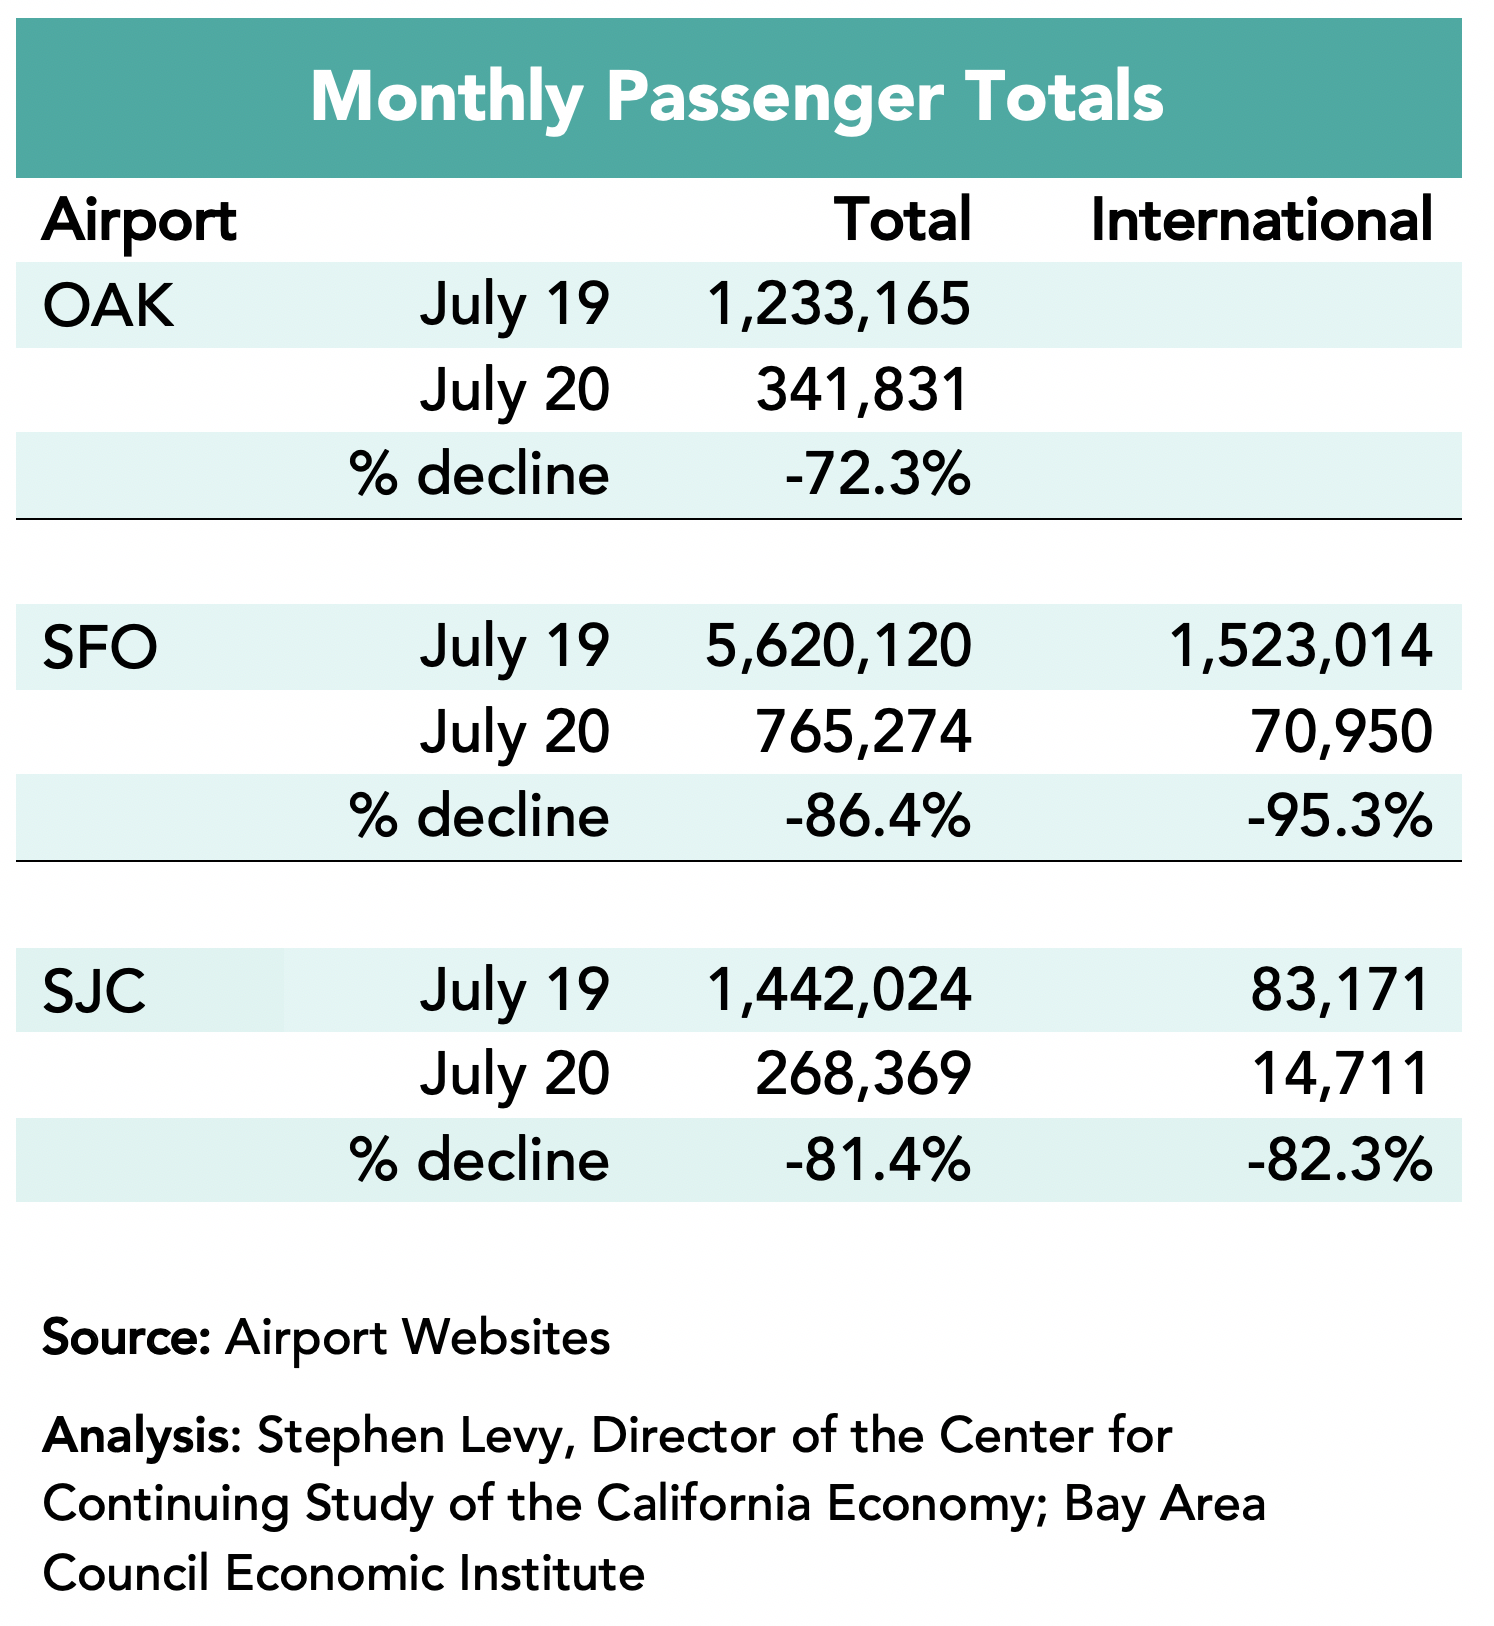
Airline Passenger Count Up, But Still Far Behind 2019 Levels
Airline passenger counts picked up in July at all Bay Area airports. However, Bay Area passenger counts in July 2021 were just over 1/2 of comparable month 2019 totals.
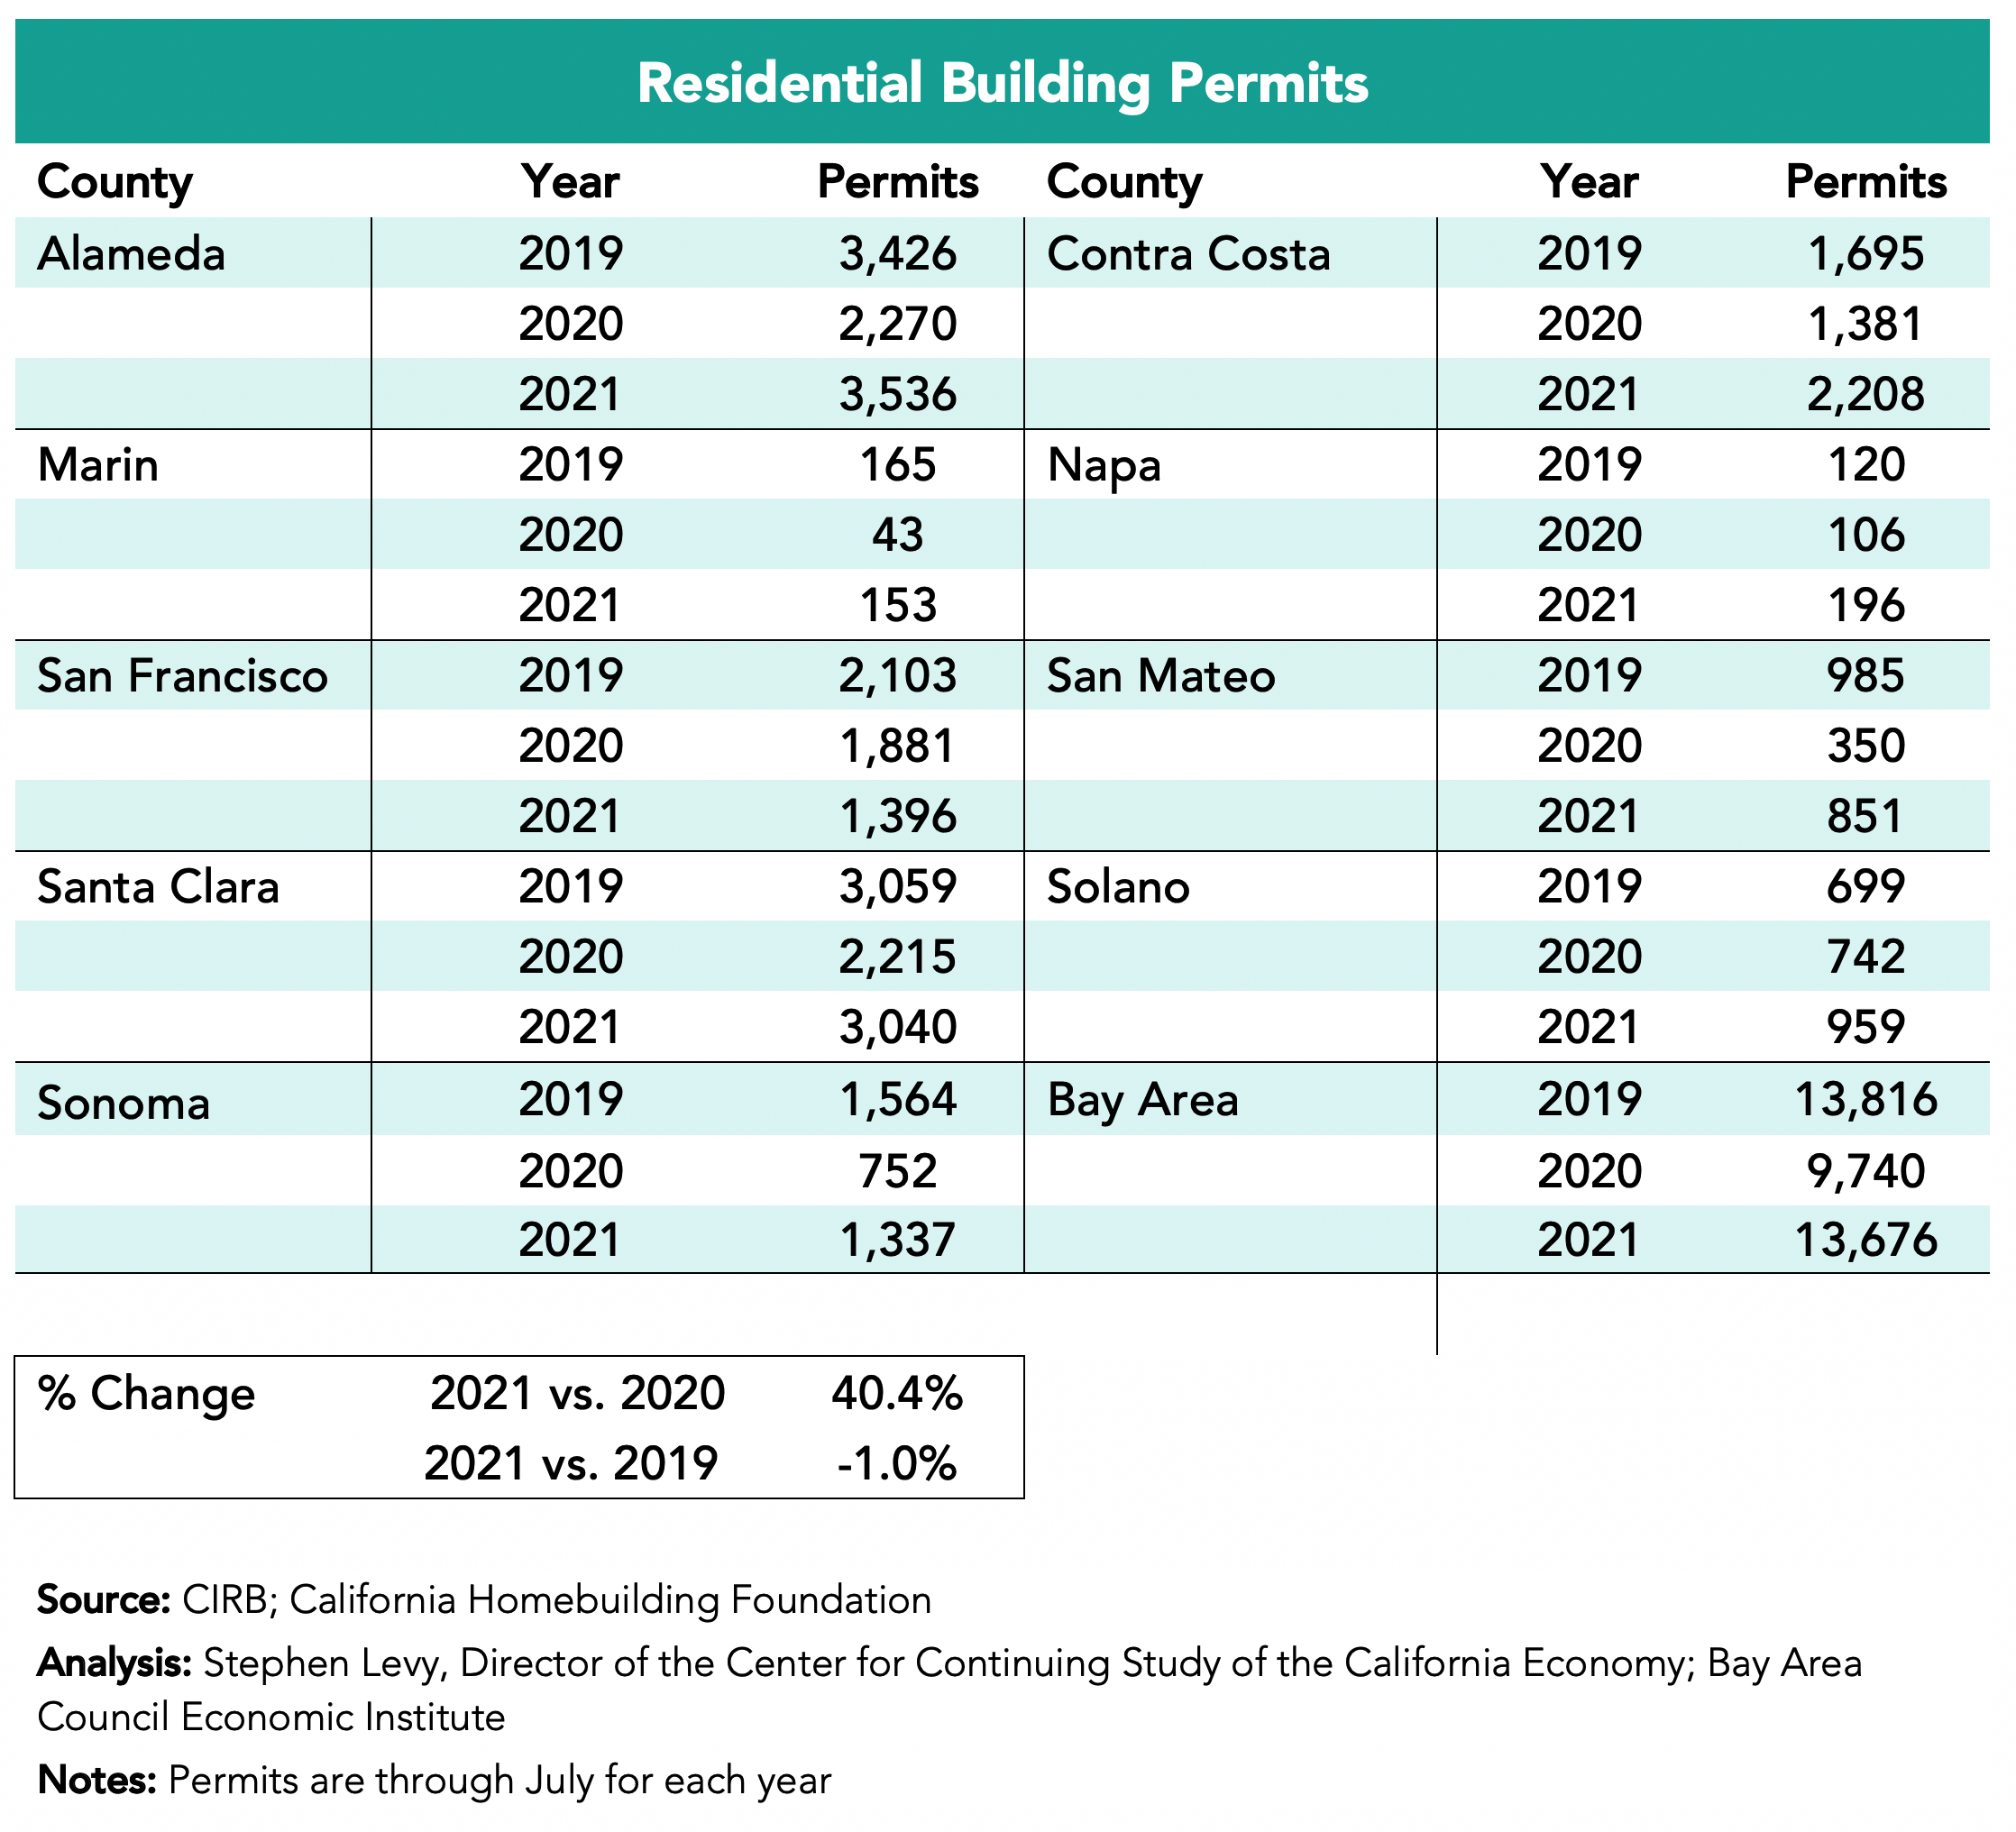
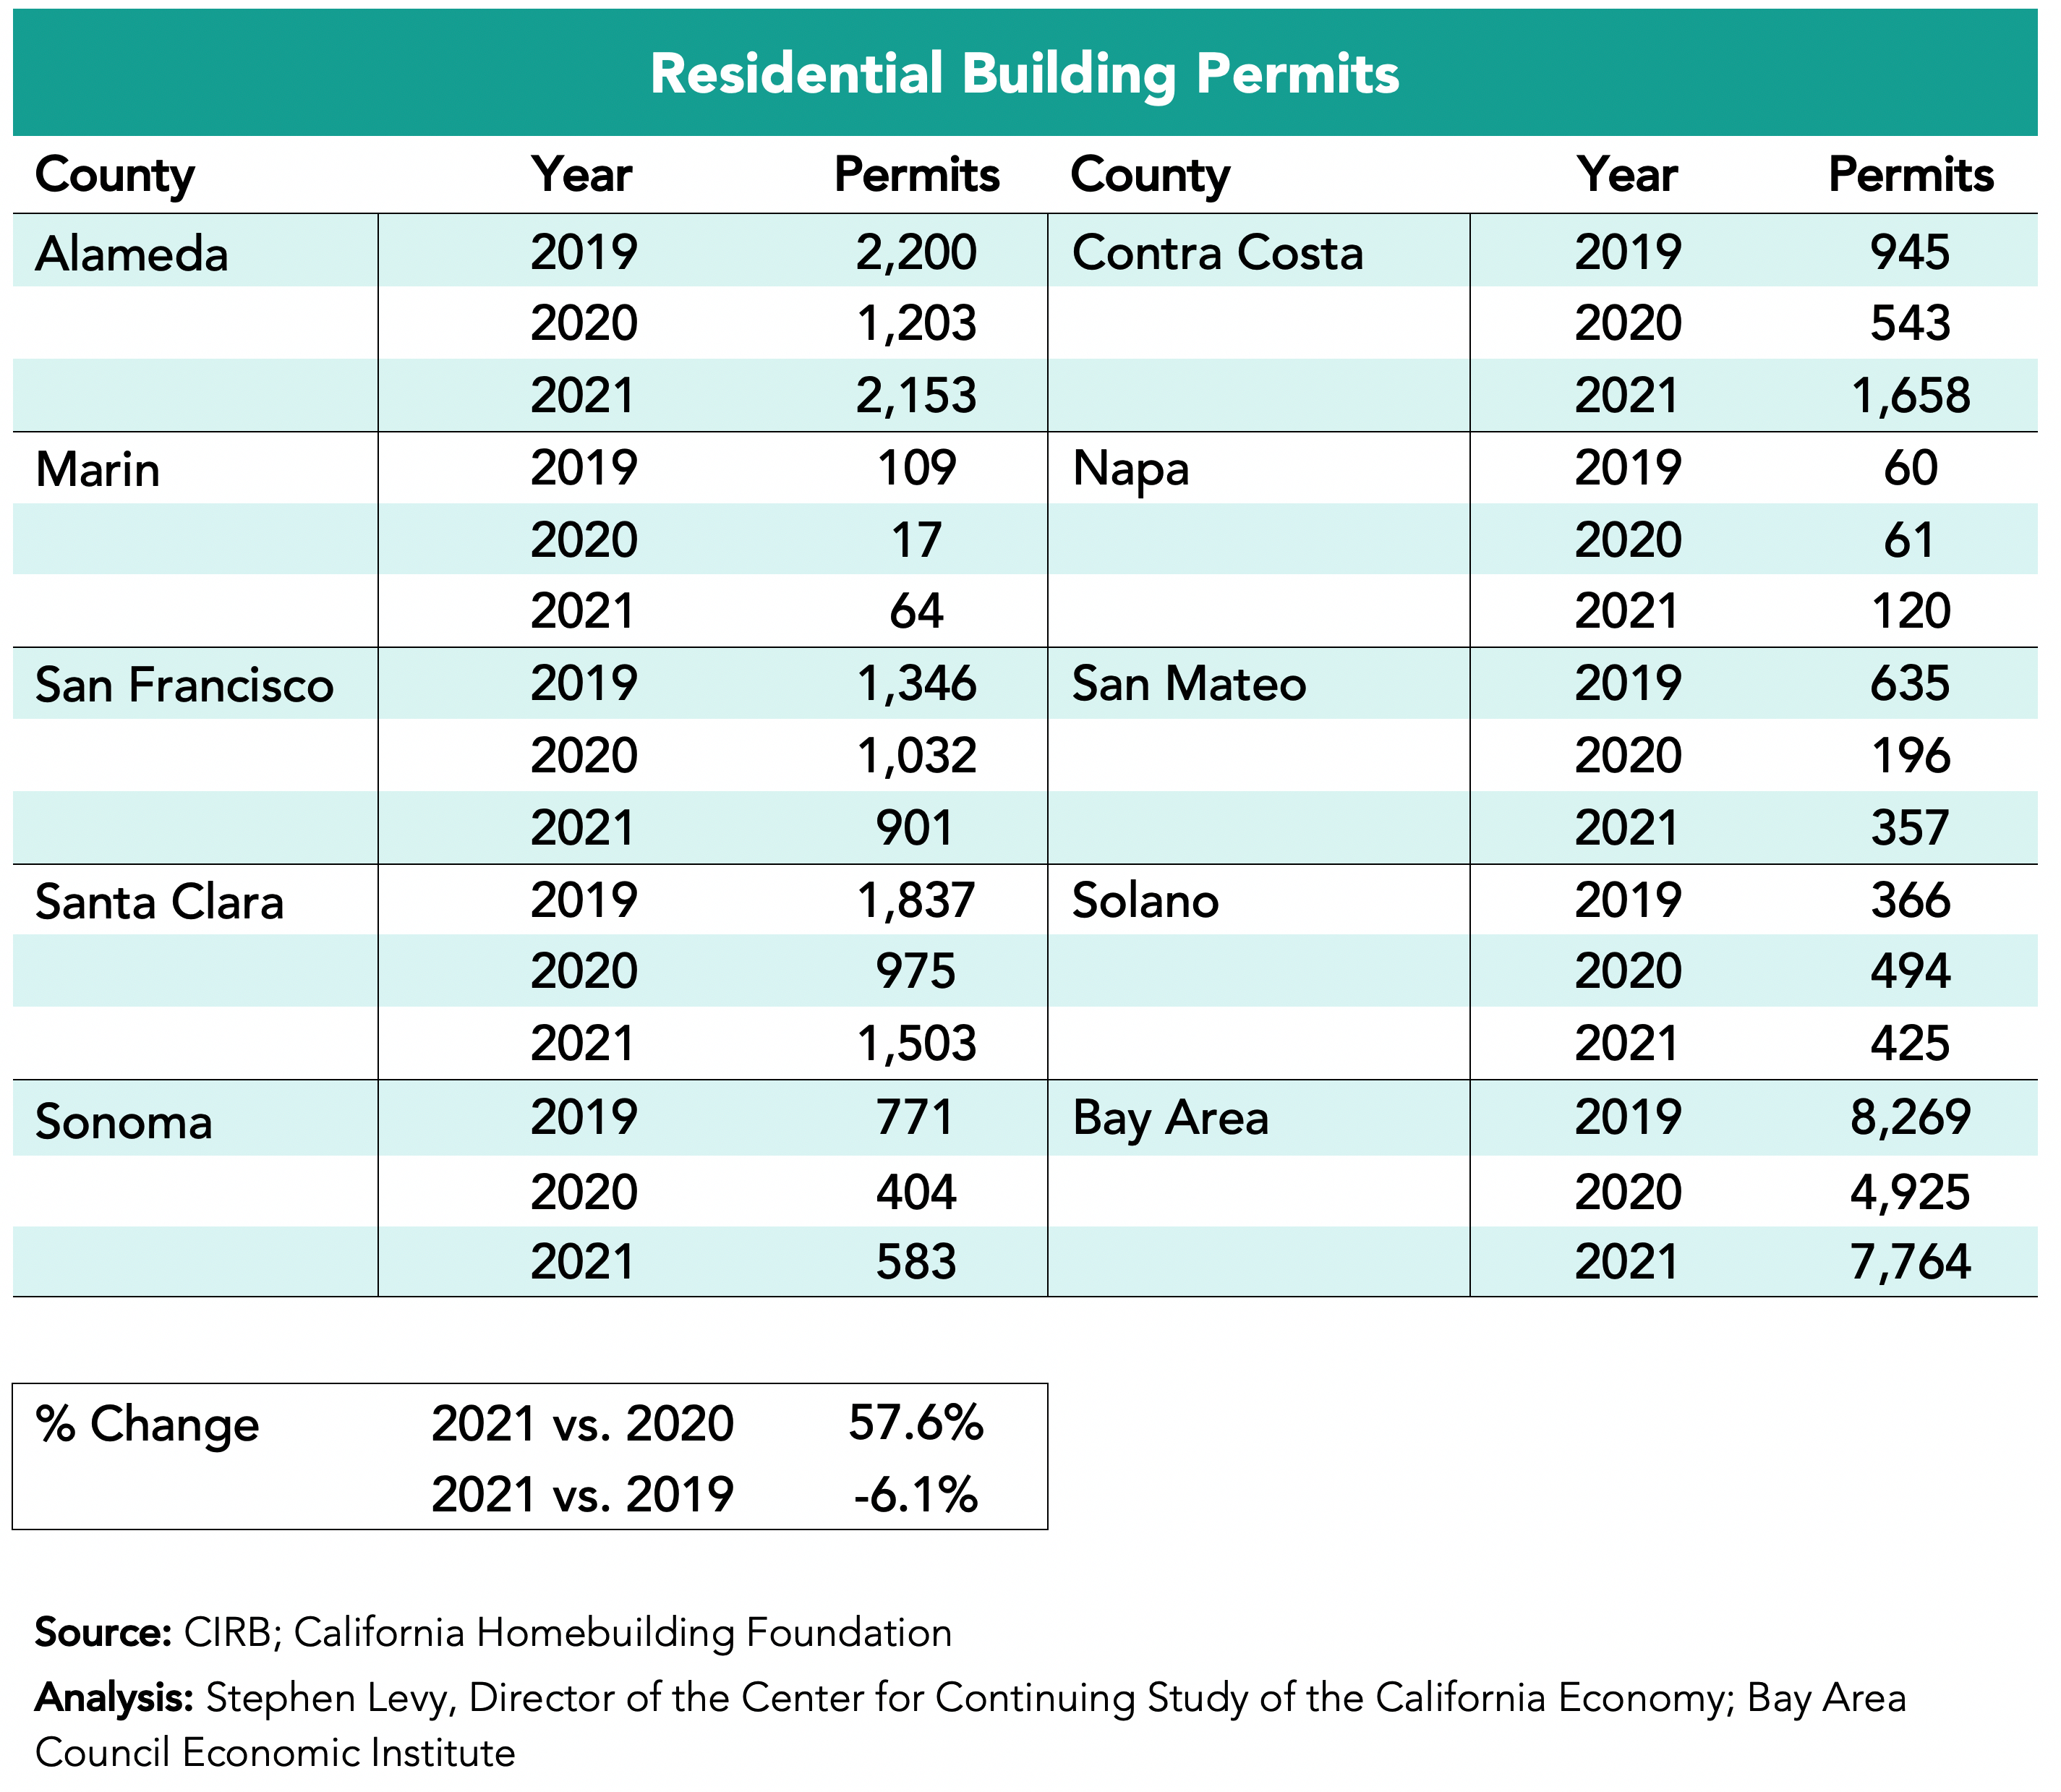
Housing Permits Up Over 2020 Levels, Trail 2019 Slightly
Housing permit levels are up over 2020 in the first seven months of 2021 but still slightly trail 2019 comparable months. But this month many new developments have been approved or proposed in places like Oakland and San Jose and in my neighborhood Menlo Park approved an 800-unit project and a developer proposed 500 units in Palo Alto this week.
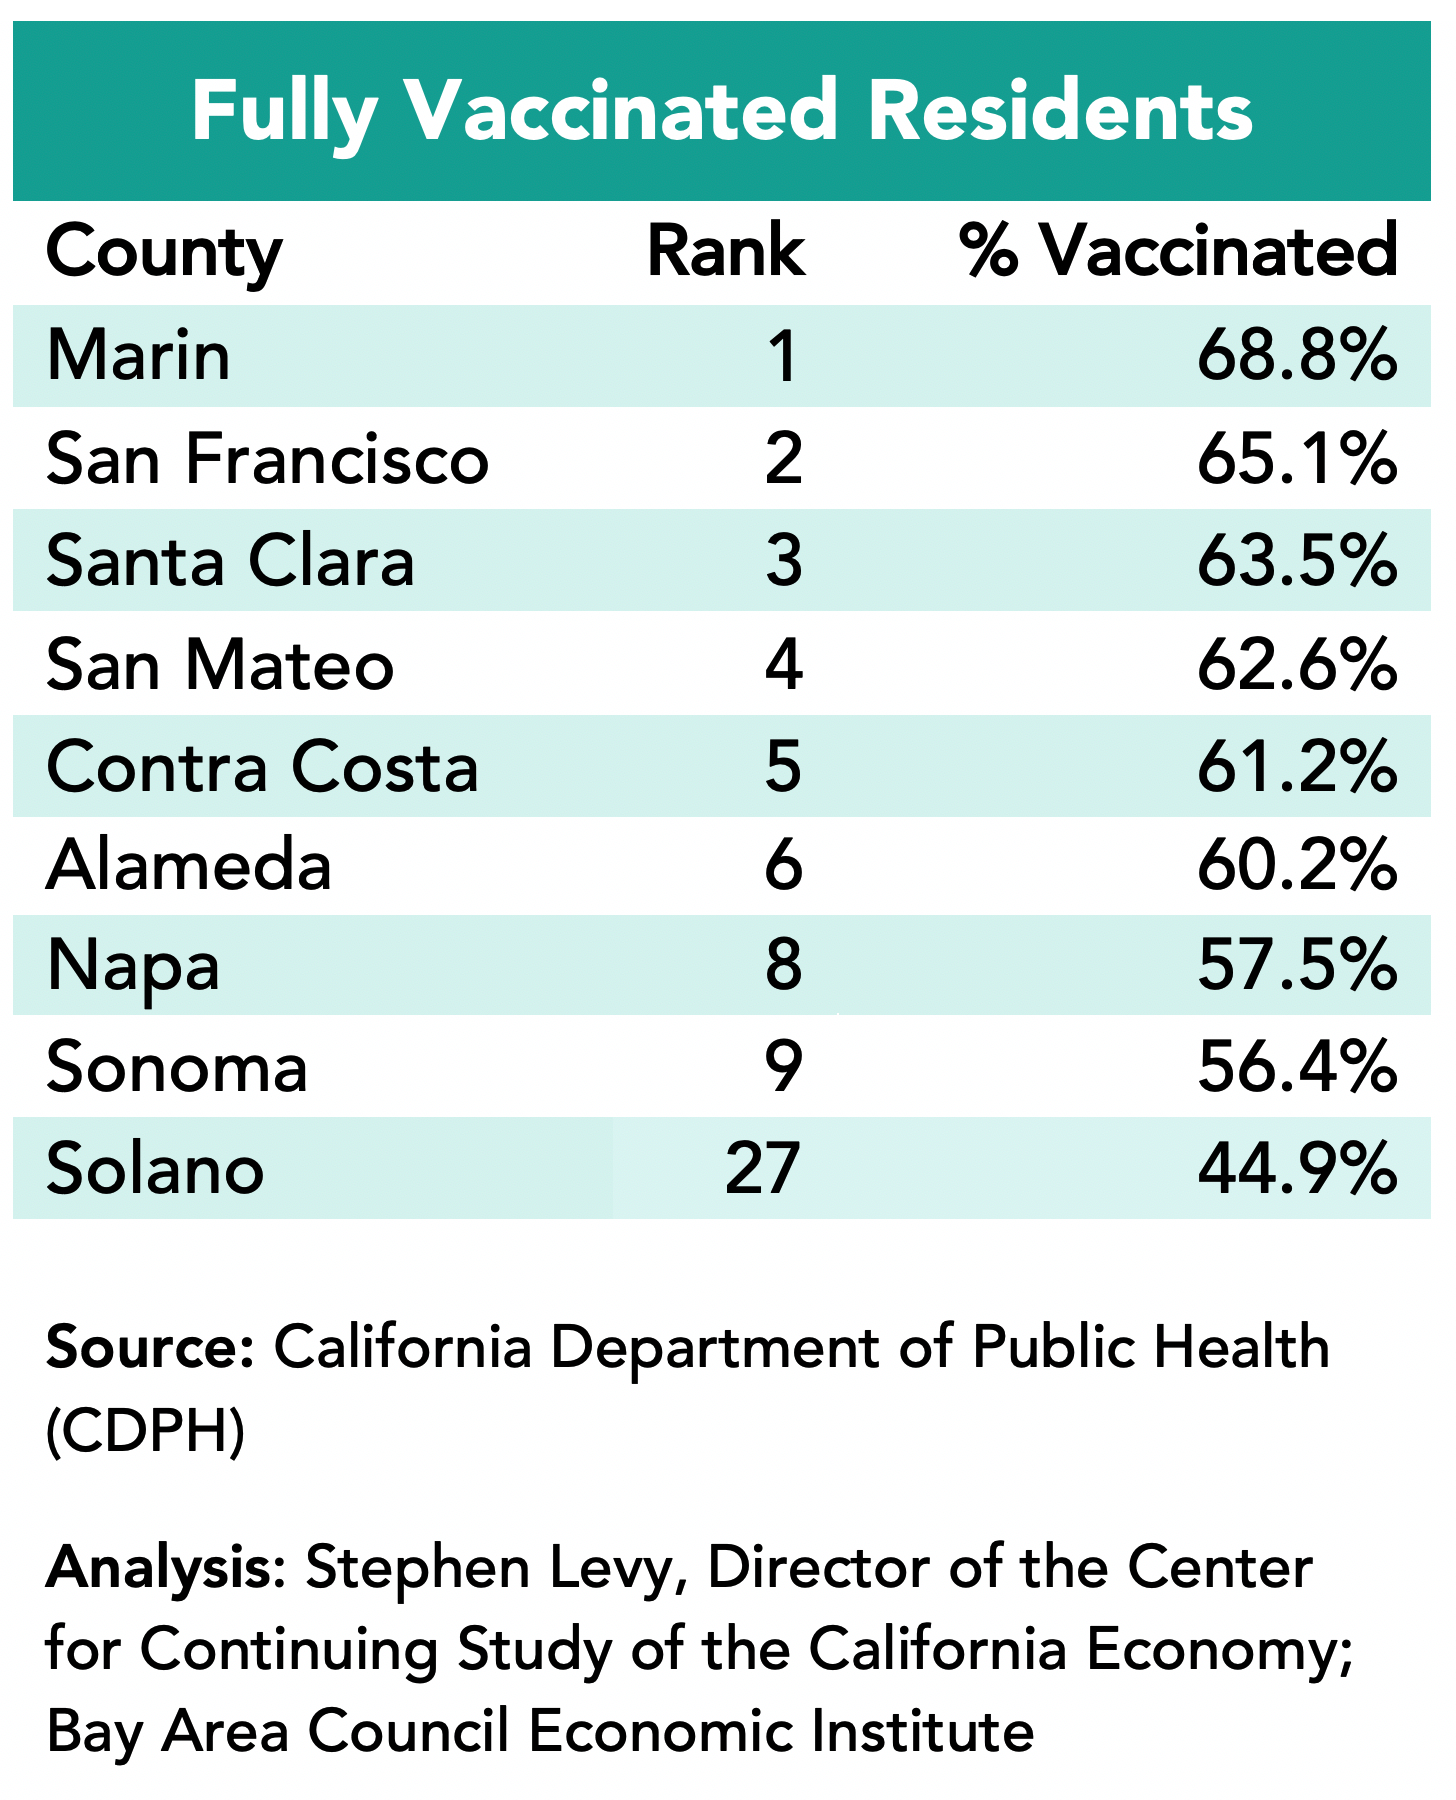
Bay Area COVID Stats
The top eight counties in terms of vaccination percentages (all but Solano) are from the Bay Area with all having more than 70% first doses and six having more than 70% fully vaccinated. The Bay Area has by far the lowest number of new cases per capita and 8 of the 12 counties with the lowest recent per capita cases are in the Bay Area.
Large Challenges Remain:
We have the paradox of continuing reports of headquarters’ relocations outside of the region at the same the region is capturing record VC funding levels and tech jobs are slightly above pre-pandemic levels. Yet, the Bay Area Council warnings about losing our competitiveness remain as housing and mobility challenges are far from solved—the major causes of recent movements of companies and residents.
The rebound from pandemic related economic losses will continue but new policies are needed to maintain and improve the long-term competitiveness of the Bay Area economy. There is now increased movement to integrate our many transportation systems and agencies and pursue fare integration in an effort both to improve but to maintain the solvency of our main public transit options.
These economic updates are authored by Stephen Levy, Director of the Center for Continuing Study of the California Economy, and a member of the Bay Area Council Economic Institute board.
On September 8, Bay Area Council Economic Institute Senior Director Sean Randolph presented the findings of the Institute’s new study on the China Greater Bay Area to an audience in the U.S. and China organized by the US-China Business Council. The forum was the first in a new series of USCBC programs that will focus on perspectives on China from U.S. states.
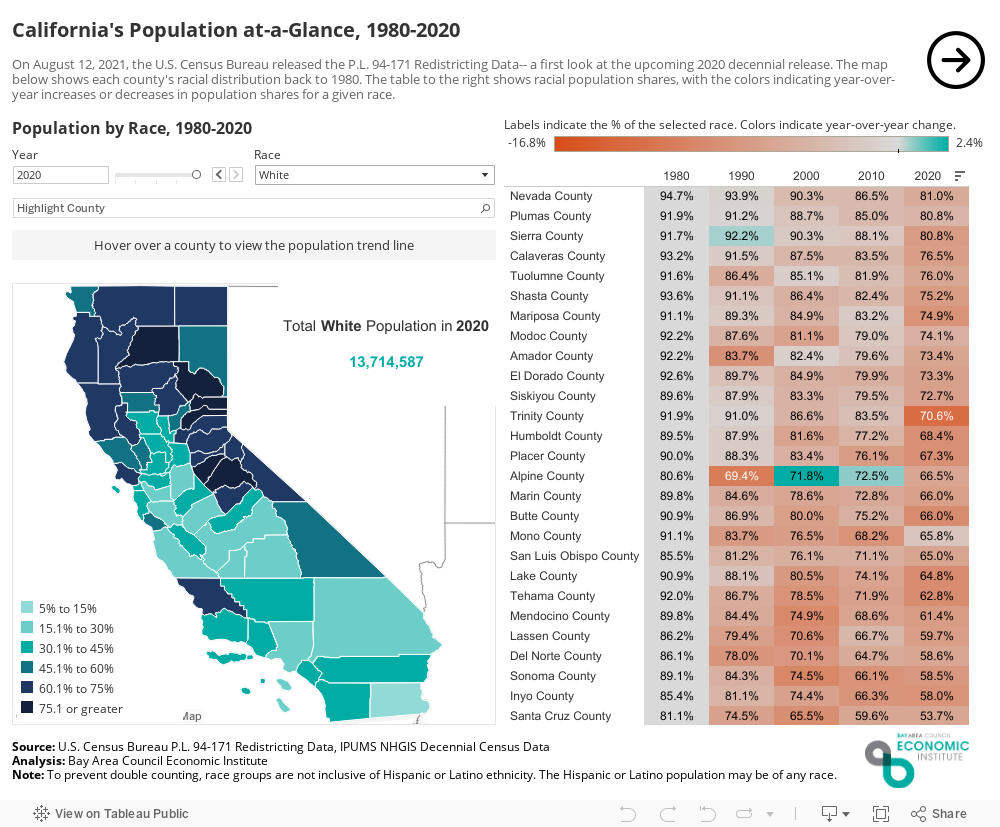
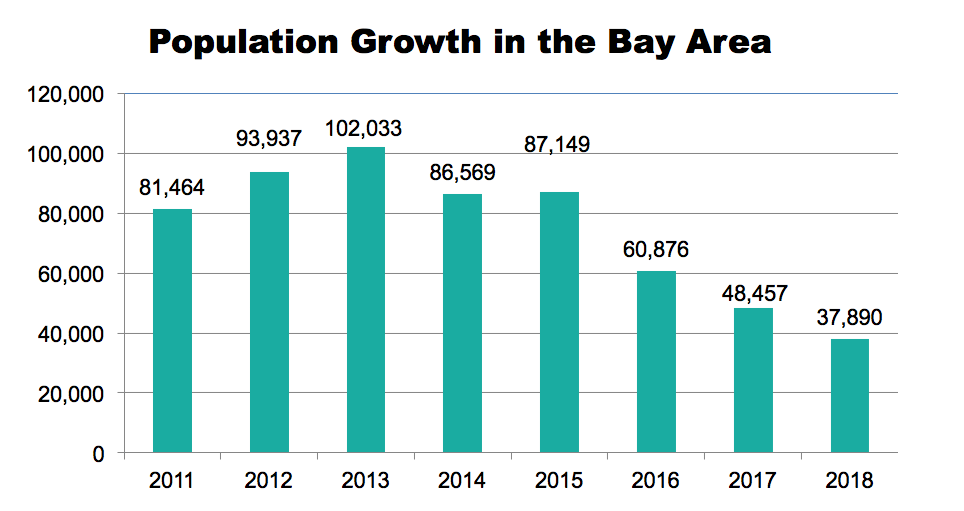
California’s population growth has been slowing, most recently leading to the loss of a congressional seat for the first time in the state’s history. This shift is nothing new, but rather part of a decades-long trend in decreasing birth rates, increasing death rates, and domestic out-migration. The state’s white population, which shrank by 8 percent from 2010 to 2020, lost 1 million people every decade since 1990. The Black population also declined slightly, largely due to decreases within the top six counties in terms of their Black population share.
Still, the state overall added 2.3 million people since 2010, mainly driven by an increase in the Hispanic or Latino population, which accounted for 69% of the state’s total population growth. In the Bay Area, only Solano and Contra Costa counties grew at a faster rate than the state (using 1980 as a baseline), due to a rise in both their Hispanic or Latino and Asian populations, and only a modest decrease in their white populations.
The visualization below illustrates demographic shifts in California from 1980 through the most recent 2020 Census. Explore by toggling buttons by race and year to reveal trends for individual counties, the Bay Area, or the state overall.
July 3rd, 2021
Tech interest is growing in Mexico. Led by investors, entrepreneurs and leaders in states and cities, Mexico is now on the radar for U.S. technology and innovation partners. In this transformation, Silicon Valley’s role looms large. In an article in the Mercury News, Sean Randolph, Senior Director of the Institute, details how the U.S. – Mexico connection has grown, and how the venture capital industry in Mexico is building its digital capacity and benefits from sheer size.
The Bay Area posted modest job gains in March, April and May. The outlook for stronger near-term economic gains is positive though long-term challenges remain. The U.S. economic outlook has improved with positive implications for our region. The Bay Area success in battling the pandemic with declining case and hospitalization levels and high rates of vaccination has led to many reopenings with more to come that will be reflected in this and July jobs reports.
The highlights:
• The Bay Area added 89,500 jobs between January and May 2021 and the regional unemployment rate fell from 6.6% to 5.4%. Job gains were led by the San Francisco and San Jose metro areas and a rebound in the restaurant and tourist sectors.
• The U.S, and Bay Area economic outlook has been upgraded by the $1.9 billion COVID relief package that has so far resulted in growth in retail sales and the ISM manufacturing and services indices.
• Bay Area growth should accelerate now with more businesses reopening including some in-person capacity at sports and tourist venues.
• The long-term Bay Area economic challenges remain with only slow progress on housing, transportation and economic competitiveness, challenges at the front of the Bay Area Council policy agenda.
Job Growth is Steady but Unspectacular
The Bay Area added 89,500 jobs in the past four months led by a gain of 33,500 in the San Francisco metro area though SF has recovered just 32.2% of the jobs lost between February and April 2020 as job gains are offset by companies moving jobs out of SF. The San Jose metro area added 25,300 jobs. but by May had recovered only 46.5% of the jobs lost between February and April 2020. The Napa and San Rafael metro areas had the largest % job recovery by May 2021.
The Bay Area Had Recovered Just 43.5% of Lost Jobs by May 2021
In May 2021 the Bay Area had recovered 43.5% of the jobs lost between February and April 2020 up from 29.4% in January. The state had recovered 51.8% up from 34.0% while the nation had recovered over half (65.8%) of lost jobs up from 55.4%. The cause of low job recovery in the region and state was the extent and duration of activity restrictions compared to elsewhere in the nation. In the past three months the Bay Area and California have begun to catch up and that should continue with the good vaccination news and continued reopenings.
Unemployment Rates Fell to 5.4% in the Region in May 2021
The lowest rates were in the San Rafael metro area (4.3%) followed by the San Francisco and San Jose metro areas in May 2021. Unemployment rates fell at the same time that some workers returned to the labor force, which is a positive sign. The number of unemployed residents is down 47,400 since January 2021 though the level is still nearly twice the pre-pandemic low.
Industries Were Affected Differently
The Information sector actually added a small number of jobs compared to before the pandemic hit. On the other hand, the Leisure and Hospitality sector recovered only 40.8% of lost jobs by May 2021 and much of these in the past four months. The Government sector has fewer jobs now than in April 2020. The Construction sector has recovered most of the jobs between February and April 2020.
The Leisure and Hospitality Sector Took the Biggest Hit but is Now Recovering
Restaurant job gains have fueled recent regional job growth and now tourist and sports activities are reopening, which should lead to further job recovery if enough workers can be found.
The Look from June 2021
Several factors point to a better economic outlook for the Bay Area. The UCLA June 2021 forecast has the state outpacing the nation in job growth for the next two years led by the Bay Area economy. The recently passed COVID relief package ($1.9 trillion), the new policies on immigration, trade and infrastructure all support the region and state economies.
Airline Passenger Count Up, But Still Far Behind 2019 Levels>
Airline passenger counts picked up in April at all Bay Area airports. However, Bay Area passenger counts in April 2021 were just over 1/3 of comparable month 2019 totals.
Housing Permits Up Over 2020 Levels, Trail 2019 Slightly
Housing permit levels are up over 2002 in the first four months of 2021 but still slightly trail 2019 comparables.
The Bay Area has the 2nd lowest case rate among California regions well below the state and national averages. The Bay Area had 16.6 cases per 100,000 residents in the most recent period and that is down substantially from the 52.5 cases per 100,000 residents in the last economic update report.
Bay Area counties rank high in fully vaccinated residents among the state’s 58 counties though vaccination rates have been rising more slowly in recent weeks as many residents are already fully vaccinated.
Large Challenges Remain:
Yet, the Bay Area Council warnings about losing our competitiveness remain as housing and mobility challenges are far from solved—the major causes of recent movements of companies and residents.
The rebound from pandemic related economic losses will continue but new policies are needed to maintain and improve the long-term competitiveness of the Bay Area economy.
These economic updates are authored by Stephen Levy, Director of the Center for Continuing Study of the California Economy, and a member of the Bay Area Council Economic Institute board.
The Recovery Strengthens
June 14, 2021
The Bay Area posted modest job gains in March and April. The outlook for stronger near-term economic gains is positive though long-term challenges remain. The U.S. economic outlook has improved with positive implications for our region. The Bay Area success in battling the pandemic with declining case and hospitalization levels and high rates of vaccination has led to many reopenings with more to come that will be reflected in the May, June and July jobs reports.
The highlights:
• The Bay Area added 50,100 jobs between January and March 2021 .and the regional unemployment rate fell from 6.6% to 5.9%. Job gains were led by the San Francisco and San Jose metro areas.
• The U.S, and Bay Area economic outlook has been upgraded by the $1.9 billion COVID relief package that has so far resulted in growth in retail sales and the ISM manufacturing and services indices.
• The downward revisions in the Bay Area were comparable in % terms to those statewide. However, the Bay Area and state have now recovered a much smaller share of jobs lost compared to the nation.
• Bay Area growth should accelerate now with more businesses reopening including some in-person capacity at sports and tourist venues.
• The long-term Bay Area economic challenges remain with only slow progress on housing, transportation and economic competitiveness, challenges at the front of the Bay Area Council policy agenda.
Job Growth is Continuing
The Bay Area added 72,700 jobs in the past three months led by a gain of 28,700 in the San Francisco metro area though SF has recovered just 29.6% of the jobs lost between February and April 2020. The San Jose metro area added 21,100 jobs. but by March had recovered only 22.9% of the jobs lost between February and April 2020. The Napa, Vallejo and San Rafael metro areas had the largest % job recovery by April 2021.
The Bay Area Had Recovered Just 41% of Lost Jobs by April 2021
In April 2021 the Bay Area had recovered 40.9 of the jobs lost between February and April 2020 up from 29.4% in January. The state had recovered 48.0% up from 34.0% while the nation had recovered over half (63.2%) of lost jobs up from 55.4%. The cause of low job recovery in the region and state was the extent and duration of activity restrictions compared to elsewhere in the nation. In the past two months the Bay Area and California have begun to catch up and that should continue with the good vaccination news and continued reopenings.
Unemployment Rates Fell to Below 6% in the Region
The lowest rates were in the San Rafael metro area (4.8%) followed by the San Francisco and San Jose metro areas in April 2021.
Industries Were Affected Differently
The Information sector actually added a small number of jobs compared to before the pandemic hit. On the other hand, the Leisure and Hospitality sector recovered only 30.6% of lost jobs by April 2021 and much of these in the past three months. The Government, Wholesale Trade and Financial Activities sectors have fewer jobs now than in April 2020.
The Look from June 2021
Several factors point to a better economic outlook for the Bay Area. The UCLA June 2021 forecast has the state outpacing the nation in job growth for the next two years led by the Bay Area economy. The recently passed COVID relief package ($1.9 trillion), the new policies on immigration, trade and infrastructure all support the region and state economies.
Airline Passenger Count Up, But Still Far Behind 2019 Levels>
Airline passenger counts picked up in April at all Bay Area airports. However, Bay Area passenger counts in April 2021 were just over 1/3 of comparable month 2019 totals.
Housing Permits Up Over 2020 Levels, Trail 2019 Slightly
Housing permit levels are up over 2002 in the first four months of 2021 but still slightly trail 2019 comparables.
The Bay Area has the 2nd lowest case rate among California regions well below the state and national averages. The Bay Area had 16.6 cases per 100,000 residents in the most recent period and that is down substantially from the 52.5 cases per 100,000 residents in the last economic update report.
Bay Area counties rank high in fully vaccinated residents among the state’s 58 counties and the vaccination share has been rising by 3% or more in recent weeks.
Large Challenges Remain:
Yet, the Bay Area Council warnings about losing our competitiveness remain as housing and mobility challenges are far from solved—the major causes of recent movements of companies and residents.
The rebound from pandemic related economic losses will continue but new policies are needed to maintain and improve the long-term competitiveness of the Bay Area economy.
These economic updates are authored by Stephen Levy, Director of the Center for Continuing Study of the California Economy, and a member of the Bay Area Council Economic Institute board.
June 4th, 2021
Intellectual property rights are at the root of biotechnology R&D and vital to the industry in the Bay Area. In an article on Medium.com, Sean Randolph of the Bay Area Council Economic Institute, explains why waiving the intellectual property rights of vaccine producers is not an effective near or long-term strategy.
Sean Randolph of the Bay Area Council Economic Institute says a year without arts has left San Francisco a poorer place. When the arts resume, the city, its businesses and its residents must step up. The arts will serve as an economic driver and will play a vital role in the economic and social recovery of the City of San Francisco and the Bay Area.
• The Bay Area added 50,100 jobs between January and March 2021 .and the regional unemployment rate fell from 6.6% to 5.9%. Job gains were led by the San Francisco and San Jose metro areas.
• The U.S, and Bay Area economic outlook has been upgraded by the $1.9 billion COVID relief package that has so far resulted in growth in retail sales and the ISM manufacturing and services indices.
• The downward revisions in the Bay Area were comparable in % terms to those statewide. However, the Bay Area and state have now recovered a much smaller share of jobs lost compared to the nation.
• Bay Area growth should accelerate now with more businesses reopening including some in-person capacity at sports and tourist venues.
• The long-term Bay Area economic challenges remain with only slow progress on housing, transportation and economic competitiveness, challenges at the front of the Bay Area Council policy agenda.
Job Growth Accelerated in February and March
The Bay Area added 50,100 jobs in the past two months led by a gain of 15,900 in the San Jose metro area. The San Francisco metro area added 16,200 jobs but by March had recovered only 22.9% of the jobs lost between February and April 2020. The napa, Vallejo and San Rafael metro areas had the largest % job recovery by March 2021.
The Bay Area Had Recovered Just 37% of Lost Jobs by March 2021
In March 2021 the Bay Area had recovered 37.3% of the jobs lost between February and April 2020 up from 29.4% in January. The state had recovered 43.7% up from 34.0% while the nation had recovered over half (62.4%) of lost jobs up from 55.4%. The cause of low job recovery in the region and state was the extent and duration of activity restrictions compared to elsewhere in the nation.
Unemployment Rates Fell to Below 6% in the Region
The lowest rates were in the San Rafael metro area (4.8%) followed by the San Francisco and San Jose metro areas (5.2%) in March 2021.
Labor Force Losses Were Added to the Poor Job Performance
The Bay Area labor force shrank by more than 200,000 between February 2020 and March 2021 as people dropped out of the labor force during the pandemic for a variety of reasons. It is possible some of these residents left the region either for remote work opportunities or as part of the growing trend of out migration to find less expensive housing but data shows that most movers stayed in the Bay Area. The people leaving the labor force are no longer counted as unemployed so the unemployment rates understate the damage done by the pandemic related activity restrictions.
Industries Were Affected Differently
The Information sector actually added a small number of jobs compared to before the pandemic hit. On the other hand, the Leisure and Hospitality sector recovered only 21.5% of lost jobs by March 2021 and much of these in the past two months. The Government and Wholesale Trade sectors have fewer jobs now than in April 2020.
The Look from April 2021
Several factors point to a better economic outlook for the Bay Area. The UCLA March 2021 forecast has the state outpacing the nation in job growth for the next three years led by the Bay Area economy. The recently passed COVID relief package ($1.9 trillion), the new policies on immigration, trade and infrastructure all support the region and state economies.
The Bay Area has the 2nd lowest case rate among California regions well below the state and national averages.
Bay Area counties rank high in fully vaccinated residents among the state’s 58 counties and the vaccination share has been rising by 3% or more in recent weeks.
Large Challenges Remain:
Yet, the Bay Area Council warnings about losing our competitiveness remain as housing and mobility challenges are far from solved—the major causes of recent movements of companies and residents.
These economic updates are authored by Stephen Levy, Director of the Center for Continuing Study of the California Economy, and a member of the Bay Area Council Economic Institute board.
Dissecting the Downward Revision to Bay Area Job Estimates
March 18, 2021
The highlights:
• The downward revisions occurred after May 2021.In that month the revisions raised, now lowered, the Bay Area job total.
• The downward revisions were largest in the Leisure and Hospitality sector that includes hotels, restaurants, and amusement parks. Tech sector jobs were revised up.
• The downward revisions in the Bay Area were comparable in % terms to those statewide. However, the Bay Area and state have now recovered a much smaller share of jobs lost compared to the nation.
• The number of people in the Bay Area labor force was revised downward. What might that mean?
• Now we are in March. How has the outlook changed?
The Downward Revisions Occurred After May 2020
In February 2020 prior to the virus spread, revisions raised job levels in the state and Bay Area. In May 2020 the Bay Area accounted for nearly all the state upward revisions. The downward revisions occurred later in 2020.
In December 2020, the last month of the revisions, the Bay Area accounted for just under 25% of the state revisions, which is in line with the region’s share of state jobs.
Largest Downward Revisions were in Leisure and Hospitality While Tech Jobs were Revised Up Slightly
The Leisure and Hospitality sector was revised downward by 53,000 jobs for December 2020 accounting for all the region’s downward revisions. The activity restrictions were still in full force for this sector through the end of 2020. It should be noted that the later months of 2020 may be revised again when full data is available. Job levels in some sectors were revised upward including +28,800 in the Information sector that includes internet related services. Manufacturing jobs were also revised upward so tech broadly defined including the downward revisions to Professional and Business Services jobs, gained in the revisions.
The Leisure and Hospitality sector was the hardest hit by the pandemic activity restrictions and the slowest to recover. Job levels in January 2021 were barely about the April 2020 lows as air travel restrictions and convention cancellations hit the tourist sector and restaurant sales were significantly depressed.
The Bay Area Had Recovered Just 29% of Lost Jobs by January 2021
In January 2021 the Bay Area had recovered 29.4% of the jobs lost between February and April 2020. The state had recovered 34.0% while the nation had recovered over half (55.8%) of lost jobs. The probable cause of low job recovery in the region and state was the extent and duration of activity restrictions compared to elsewhere in the nation. Looking at large metro areas in California the recovery share was SF (13.3%), East Bay (39.7%), San Jose (30.7%), LA (25.9%), Orange (27.4%), Riverside-San Bernardino (53.5%) and San Diego (37.5%).
Labor Force Losses Were Added to the Poor Job Performance
The Bay Area labor force was revised down by 24,900 in December 2020 and another 25,700 residents left the labor force in January. It is possible some of these residents left the region either for remote work opportunities or as part of the growing trend of out migration to find less expensive housing.
The extent of out migration related to the pandemic and the future of remote work is unclear at this time. Recent evidence is that most recent movers from the Bay Area sites stayed within the region or moved relatively close by while a smaller share left the state.
The Look from March 2021
All Bay Area counties have moved into the red tier and on March 16th San Mateo County moved into the Orange tier with other counties poised to follow.
The Bay Area has the lowest case rate among California regions.
Bay Area counties rank high in vaccinations per 100,000 residents among the state’s 58 counties.
Several additional factors point to a better economic outlook for the Bay Area. The UCLA March 2021 forecast has the state outpacing the nation in job growth for the next three years led by the Bay Area economy. The recently passed COVID relief package ($1.9 trillion), the new policies on immigration, trade and infrastructure all support the region and state economies.
Yet, the Bay Area Council warnings about losing our competitiveness remain as housing and mobility challenges are far from solved—the major causes of recent movements of companies and residents.
And, finally this alert from a recent BAC email.
Stemming the Tide of Jobs, Investment Leaving California:
With jobs and investment continuing to flee California, identifying the key issues and solutions to the state’s worsening business climate is imperative. Bay Area Council CEO Jim Wunderman today joined a virtual town hall hosted by Chapman University and including a panel of many of the state’s leading business and academic leaders to discuss the disastrous consequences of failing to take seriously the threat to California’s economy. The discussion comes as the Council launches a new statewide initiative focused on reversing the exodus of talent, companies and investment over concerns about high taxes, onerous regulations and the multiple threats of a historic housing crisis, growing homelessness and escalating impacts—wildfires, drought, extreme weather—of climate change. As well, how COVID is dramatically altering the considerations of businesses in deciding where they need to locate.
The Council will circulate a link to watch the recorded town hall next week. To learn more about the Council’s Repair California initiative and how you can participate and support the work, please contact Chief Operating Officer John Grubb.
These economic updates are authored by Stephen Levy, Director of the Center for Continuing Study of the California Economy, and a member of the Bay Area Council Economic Institute board.
February 4th, 2021
Under the Biden administration, there has been a significant push for a broad based immigration reform. These policies include H1-B visas, which are used by tech companies to fill high-skilled workforce gaps. In particular in the Bay Area, where 45% of tech companies are created from foreign born H1-B visa holders. While this will be an intense political debate moving forward, this article by Sean Randolph, Senior Director of the Institute, in the San Francisco Business Times, details how the access for U.S. businesses to the skilled and educated immigrants will allow for these companies to remain globally competitive.
• The past two months have brought discouraging economic news for the near-term as a result of the virus spread and resulting restrictions on activity in the Bay Area. The region lost 20,900 jobs in Leisure and Hospitality (hotels and restaurants), saw an increase in unemployment of 34,300 with the regional unemployment rate jumping from 5.9% in November to 6.8% in December.
• The Bay Area recorded added 17,300 jobs in November down from 32,900 in October. The activity restrictions should limit job growth while they last.
• The Bay Area lost 14,300 jobs (seasonally adjusted) in December as other sectors mostly posted small job gains.
• Between April and December, the Bay Area recovered 39.5% of the jobs lost between February and April trailing the state and nation.
• At the same time, news of vaccine approval and distribution, a possible stimulus package and the Biden administration focus on immigration, infrastructure and job growth point to a better outlook by mid-year 2021. The usual caveats about housing supply and affordability and maintaining a competitive economic environment remain.
The Pandemic Led to Activity Restrictions and a Hit to Leisure and Hospitality in December
California and the Bay Area Lagged the Nation in Job Recovery in December as Pandemic Restrictions Caused Shutdowns and Slowdowns
The state and Bay Area recovered a smaller share of the jobs lost by December compared to the nation. This is the result of our more cautious reopening pace and the more than 80% decline in business and visitor travel and resulting loss of spending and jobs.
The share of jobs recovered by December varies somewhat among the metro areas with the lowest shares recovered in the Oakland and San Francisco metro areas. Most of the job losses in December were in the San Jose and San Francisco metro areas.
Unemployment rates rose sharply between February and April throughout the region. December data showed large increases in unemployment rates across the region. The regional unemployment rate declined from 13.1% in April to 5.9% in November before jumping again in December.
The number of unemployed residents rose in December to 279,200 from 241,900 in November. There are still more than twice as many residents unemployed compared to February before the pandemic spread. And the people who left the labor force are not counted as unemployed.
The largest job losses were in Leisure and Hospitality where half the jobs went away between February and April. Financial Activities (121.0%) showed the biggest recovery by November while the Wholesale Trade sector had a relatively small recovery rate so far along with Manufacturing, Leisure and Hospitality, Government and Information. Construction and Business and Professional Services recovered over 80% of the lost jobs.
Airport data is late in being posted. San Jose reports a 76.4% decline in November compared to last year despite a surge at Thanksgiving. Oakland reports a 67.5% decline for the same period.
And, finally this alert from a recent BAC email.
Stemming the Tide of Jobs, Investment Leaving California:
With jobs and investment continuing to flee California, identifying the key issues and solutions to the state’s worsening business climate is imperative. Bay Area Council CEO Jim Wunderman today joined a virtual town hall hosted by Chapman University and including a panel of many of the state’s leading business and academic leaders to discuss the disastrous consequences of failing to take seriously the threat to California’s economy. The discussion comes as the Council launches a new statewide initiative focused on reversing the exodus of talent, companies and investment over concerns about high taxes, onerous regulations and the multiple threats of a historic housing crisis, growing homelessness and escalating impacts—wildfires, drought, extreme weather—of climate change. As well, how COVID is dramatically altering the considerations of businesses in deciding where they need to locate.
The Council will circulate a link to watch the recorded town hall next week. To learn more about the Council’s Repair California initiative and how you can participate and support the work, please contact Chief Operating Officer John Grubb.
These economic updates are authored by Stephen Levy, Director of the Center for Continuing Study of the California Economy, and a member of the Bay Area Council Economic Institute board.
Pace of Recovery
December 24, 2020
The highlights:
• The past four weeks have brought discouraging economic news for the near-term as a result of the virus spread and resulting restrictions on activity in the Bay Area. At the same time, news of vaccine approval and distribution, a possible stimulus package and the Biden focus on immigration, infrastructure and job growth point to a better outlook by mid-year 2021. The usual caveats about housing supply and affordability and maintaining a competitive economic environment remain.
• The Bay Area recorded added 17,300 jobs in November down from 32,900 in October. The activity restrictions should limit job growth while they last.
• Between April and November, the Bay Area recovered 42.5% of the jobs lost between February and April trailing the state and nation.
• The regional unemployment rate was 2.7% in February, 13.1% in April and 5.9% in November. However, 79,000 residents left the workforce in November though these numbers fluctuate month to month.
• This update also looks at just released population estimates showing very small growth in 2020 as out migration surged.
California and the Bay Area Lagged the Nation in Job Recovery in October Despite Strong Job Gains
The state and Bay Area recovered a smaller share of the jobs lost by November compared to the nation. This is the result of our more cautious reopening pace and the more than 80% decline in business and visitor travel and resulting loss of spending and jobs.
The share of jobs recovered by November varies somewhat among the metro areas with the largest share recovered in the San Jose metro area (50.5%) and the smallest share in the Napa metro area (34.2%).
Unemployment rates rose sharply between February and April throughout the region. November data showed large declines in unemployment rates across the region. The regional unemployment rate declined from 13.1% in April to 6.7% in October and 5.9% in November. All metro areas had rates below 8%.
The number of unemployed residents fell quite a bit in November to 242,200 from 278,100 in October. But there are still more than twice as many residents unemployed compared to February before the pandemic spread. And the people who left the labor force are not counted as unemployed.
The largest job losses were in Leisure and Hospitality where half the jobs went away between February and April. Financial Activities (121.0%) showed the biggest recovery by November while the Wholesale Trade sector had a relatively small recovery rate so far along with Education and Health Services and Leisure and Hospitality. Government and Information are the only sectors to lose jobs after April.
On December 17 the California Department of Finance (DOF) released new population estimates through mid-year 2020. Annual growth slowed to just 1,755 in the July 1, 2019 to June 30, 2020 year.
Domestic out migration (residents leaving the Bay Area for elsewhere in the U.S. has increased steadily in recent years to over 60,000 in the 2019-2020 year and is the major cause of the population growth slowdown. There also been a decline in the number of foreign immigrants in recent years as well as declining numbers of births.
Some of these declines may be temporary but they do point to continuing concerns about housing affordability and our economic competitiveness.
County population trends are shown below.
These economic updates are authored by Stephen Levy, Director of the Center for Continuing Study of the California Economy, and a member of the Bay Area Council Economic Institute board.
December 4, 2020
Last month, fifteen nations signed the Regional Comprehensive Economic Partnership (RCEP), the U.S. however, did not sign. This article by Sean Randolph, Senior Director of the Institute, on Medium.com, details how this will impact current and future trade relations with the U.S. and Asia.
• The Bay Area recorded substantial (32,800) job growth in October as many counties relaxed restrictions on reopening. • Between April and October, the Bay Area recovered 39.6% of the jobs lost between February and April trailing the state and nation. The pace of Bay Area recovery accelerated in October. However, the recent restrictions imposed should cause a temporary slowing in job growth. • Longer term prospects have improved with the Biden election. The Bay Area will benefit from a more welcoming immigration policy, a more collaborative approach to foreign trade and the new administration’s proposals if they can be implemented. • The regional unemployment rate was 2.7% in February, 13.1% in April and 6.9% in October. For the first time in many months, a large number of residents rejoined the workforce. • This update also looks at industry sector trends, air travel data, and the Bay Area Regional Housing Needs Assessment (RHNA)
California and the Bay Area Lagged the Nation in Job Recovery in October Despite Strong Job Gains
The state and Bay Area recovered a smaller share of the jobs lost by October compared to the nation. This is the result of our more cautious reopening pace and the more than 80% decline in business and visitor travel and resulting loss of spending and jobs. The Bay Area did see more reopenings in October and an increase in the % of jobs recovered.
The share of jobs recovered by October varies somewhat among the metro areas with the largest share recovered in the San Jose metro area (49.6%) and the smallest share in the Napa metro area (25.8%).
Unemployment rates rose sharply between February and April throughout the region. October data showed large declines in unemployment rates across the region. The regional unemployment rate declined from 13.1% in April to 8.0% in September and 6.9% in October. All metro areas had rates below 9%.
The number of unemployed residents fell quite a bit in October to 287,800 from 325,200 in September. But there are still more than twice as many residents unemployed compared to February before the pandemic spread.
The largest job losses were in Leisure and Hospitality where half the jobs went away between February and April. Financial Activities (109.7%) and Construction showed the biggest recovery by October (94.8%) while the Wholesale Trade sector had a relatively small recovery rate so far. Government and Information are the only sectors to lose jobs after April. The overall job losses and recovery are affected by the continuing decline in Information and Government jobs.
Air travel plummeted after February with losses of 90% or more. There was a small rebound since August but air travel remains deeply depressed.
Oakland airport reported a 68% decline in October while SFO reported an 80% decline in September close to the 81% decline reported by SJC. Airlines are reporting holiday cancellations after the stay at home guidance from health officials.
The ABAG RHNA allocation methodology committee made their final recommendation on Friday. The regional allocation from HCD is described first and then the decision on local area allocation afterwards.
The California Department of Housing and Community Development (HCD) just released the Regional Housing Needs Determination (RHNA) for the Bay Area for the period from June 2022 through December 2030. The HCD letter can be seen at https://hcd.ca.gov/community-development/housing-element/docs/ABAGRHNA-Final060920(r).pdf. The Bay Area target is 135% higher than the current target and includes 441,176 units distributed among four income groups – very low (for residents up to 50% of area median income (AMI)), low (50% to 80% of AMI), moderate (80% to 120% of AMI) and above moderate. A majority of the units needed are in the very low to moderate income groups.
HCD used a new methodology to develop the needs assessment. Recent state legislation required HCD to include housing units to reduce the number of households that are overcrowded and cost-burdened. HCD compared the Bay Area to shares in comparable regions. HCD has always included units to return the region to a normal vacancy rate and to replace demolished housing.
The final determinant is allowance for units to accommodate the region’s expected growth. HCD used new population projections from the state Department of Finance (DOF) instead of the regional growth forecast developed by ABAG that projected 400,000 more residents than DOF in 2030.
Only half of the Bay Area housing needs according to this analysis come from growth. The rest come as a result of correcting existing shortages.
The ABAG RHNA allocation methodology committee recommended an approach that allocates an above average share of the regional RHNA to cities that are considered high opportunity areas and cities that have good auto and transit proximity to jobs. The result is that the largest % increases in housing went to communities along the peninsula.
The details and city by city allocations are found in the meeting materials that can be found here.
The recommended allocation is alternative 8A that allocates 70% of the low and very low-income units based on high opportunity areas and 15% each to proximity to jobs for transit and autos. For moderate and above moderate income units the allocation was based 40% on high opportunity areas and 60% on auto proximity to jobs.
These economic updates are authored by Stephen Levy, Director of the Center for Continuing Study of the California Economy, and a member of the Bay Area Council Economic Institute board.
November 20, 2020
Joe Biden’s election as President of the United States will bring major changes in US foreign policy. In places such as India, the U.S. seeks to deepen connections and economic ties. This article by Sean Randolph, Senior Director of the Institute, on Medium.com, details how Biden will be pragmatic and look for areas such as climate change and global health where both countries can cooperate, but even with a reset US-China relations are likely to remain strained.
San Francisco Bay Area universities, research institutes, and companies were pivotal in launching the modern computer industry and remain at the heart of the global technological revolution. The next great advance is at the Bay Area’s doorstep: quantum computing. This article by Sean Randolph, Senior Director of the Institute, and Jeffrey Welser, Vice President in IBM Research, on Medium.com, details why it is imperative that the U.S. leads in this global race.
US policy towards China will be less confrontational and the trade war may be dialled down, Biden will keep up the pressure on scrutiny of Chinese investments in the US, market access for American firms in China, human rights and Hong Kong.This article by Sean Randolph, Senior Director of the Institute, in South China Morning Post details how U.S.-China relations will look during the Biden administration.
• Between April and September, the Bay Area recovered just over 3370% of the jobs lost between February and April trailing the state and nation. The pace of Bay Area recovery slowed in September. October and November should be better months as reopening is more widespread. • The regional unemployment rate was 2.7% in February, 13.1% in April and 8.1% in September. Unemployment rates and numbers declined substantially in August, far more than is consistent with the modest job growth. • This update also looks at industry sector trends, air travel data, 2019 ACS data and the Bay Area Regional Housing Needs Assessment (RHNA)
California and the Bay Area Lagged the Nation in Job Recovery in September
The state and Bay Area recovered a smaller share of the jobs lost by September compared to the nation. This is the result of our more cautious reopening pace and the more than 80% decline in business and visitor travel and resulting loss of spending and jobs. The Bay Area is now reopening more businesses (Santa Clara, Napa and Alameda counties are now in the orange tier this month and SF has achieved the yellow tier) but the impact will not be seen until the November jobs report.
The Bay Area added 18,900 jobs in September down from 30,600 in August.
The share of jobs recovered by September varies somewhat among the metro areas with the largest share recovered in the San Rafael metro area (40.7%) and the smallest share in the Oakland metro area (26.6). The San Jose, Santa Rosa and Vallejo metro areas beat the regional recovery average.
Unemployment rates rose sharply between February and April throughout the region. September data showed small declines in unemployment rates across the region. The regional unemployment rate declined from 13.1% in April to 8.1% in September. All metro areas had rates below 10%. However, part of the drop may be the result of unemployed workers leaving the labor force.
The number of unemployed residents fell quite a bit in September to 330,100 from 527,300 in April. This estimate is hard to explain given the much smaller reported job gains and the decline of more than 50,000 in the number of workers in the labor force in August.
The largest job losses were in Leisure and Hospitality where half the jobs went away between February and April. Construction showed the biggest recovery by September (89.1%) while the Wholesale Trade sector had a relatively small recovery rate so far. Government is the only sector to lose jobs after April. The overall job losses and recovery are affected by the continuing decline in Information and Government jobs. November should bring stronger recovery as some counties are now allowed to broaden the reopening process.
Air travel plummeted after February with losses of 90% or more. There was a small rebound in August but air travel remains deeply depressed.
Bay Area poverty rates declined in 2019 and median household income increased as reported last week in the 2019 American Community Survey (ACS) data release.
Bay Area poverty rates (not adjusted for housing costs were all below 10% in 2019, below the state and national rates and well below poverty rates in 2010 and 2016. The Census Bureau publishes a supplemental poverty rate for states adjusted mainly for housing costs. In 2019 California’s supplemental poverty rate was 17.2% compared to the official rate of 11.8%
Median household income increased in most Bay Area counties in 2019. I checked the Marin County result and that is what the website shows though it seems odd. These gains adjusted for inflation far outpaced the Bay Area increase in consumer prices.
The ABAG RHNA allocation methodology committee made their final recommendation on Friday. The regional allocation from HCD is described first and then the decision on local area allocation afterwards.
The California Department of Housing and Community Development (HCD) just released the Regional Housing Needs Determination (RHNA) for the Bay Area for the period from June 2022 through December 2030. The HCD letter can be seen at https://hcd.ca.gov/community-development/housing-element/docs/ABAGRHNA-Final060920(r).pdf. The Bay Area target is 135% higher than the current target and includes 441,176 units distributed among four income groups – very low (for residents up to 50% of area median income (AMI)), low (50% to 80% of AMI), moderate (80% to 120% of AMI) and above moderate. A majority of the units needed are in the very low to moderate income groups.
HCD used a new methodology to develop the needs assessment. Recent state legislation required HCD to include housing units to reduce the number of households that are overcrowded and cost-burdened. HCD compared the Bay Area to shares in comparable regions. HCD has always included units to return the region to a normal vacancy rate and to replace demolished housing.
The final determinant is allowance for units to accommodate the region’s expected growth. HCD used new population projections from the state Department of Finance (DOF) instead of the regional growth forecast developed by ABAG that projected 400,000 more residents than DOF in 2030.
Only half of the Bay Area housing needs according to this analysis come from growth. The rest come as a result of correcting existing shortages.
The next step is for ABAG to allocate the units to local areas, which will take place over the coming months. Current emphasis is on allocating units more to areas that have high amenities and to areas that have substantially more jobs than housing.
The ABAG RHNA allocation methodology committee recommended an approach that allocates an above average share of the regional RHNA to cities that are considered high opportunity areas and cities that have good auto and transit proximity to jobs. The result is that the largest % increases in housing went to communities along the peninsula.
The details and city by city allocations are found in the meeting materials that can be found on the ABAG website.
The recommended allocation is alternative 8A that allocates 70% of the low and very low-income units based on high opportunity areas and 15% each to proximity to jobs for transit and autos. For moderate and above moderate income units the allocation was based 40% on high opportunity areas and 60% on auto proximity to jobs.
These economic updates are authored by Stephen Levy, Director of the Center for Continuing Study of the California Economy, and a member of the Bay Area Council Economic Institute board.
Pace of Recovery
September 21, 2020
The highlights:
• Between April and August, the Bay Area recovered just over 30% of the jobs lost between February and April trailing the state and nation. • The regional unemployment rate was 2.7% in February, 13.1% in April and 8.6% in August. Unemployment rates and numbers declined substantially in August, far more than is consistent with the modest job growth. • This update also looks at industry sector trends, air travel data, 2019 ACS data and the Bay Area Regional Housing Needs Assessment (RHNA)
California and the Bay Area Lagged the Nation in Job Recovery in August
The state and Bay Area recovered a smaller share of the jobs lost by August compared to the nation. This is the result of our more cautious reopening pace and the more than 80% decline in business and visitor travel and resulting loss of spending and jobs. The Bay Area is now reopening more businesses but the impact will not be seen until the October jobs report.
The Bay Area added 29,700 jobs in August but the July estimate was revised downward by 15,000 leaving a net gain of 14,700 jobs. The state added 101,900 jobs but 66,100 were in government including 37,100 federal workers likely mostly temporary Census workers.
The share of jobs recovered by August varies somewhat among the metro areas with the largest share recovered in the Santa Rosa metro area (44.1%) and the smallest share in the Oakland metro area (24.3%).
Unemployment rates rose sharply between February and April throughout the region. August data showed large declines in unemployment rates across the region. The regional unemployment rate declined from 13.1% in April to 8.6% in August. All metro areas had rates below 10%. The decline in unemployment rates and the number of unemployed workers seems very large relative to the more modest job gains.
The number of unemployed residents fell quite a bit in August to 349,300 from 442,600 in July. This estimate is hard to explain given the much smaller reported job gains and the decline of more than 50,000 in the number of workers in the labor force in August.
The largest job losses were in Leisure and Hospitality where half the jobs went away between February and April. Construction showed the biggest recovery by August (84.3%) while the Information and Wholesale Trade sectors had relatively small recovery rates so far. Government is the only sector to lose jobs after April. The overall job losses and recovery are affected by the continuing decline in government jobs. Most of the improvement in August was a rebound in Government jobs and growth in Professional Services.
Air travel plummeted after February with losses of 90% or more. There was a small rebound in August but air travel remains deeply depressed. There is no data for August yet.
Bay Area poverty rates declined in 2019 and median household income increased as reported last week in the 2019 American Community Survey (ACS) data release.
Bay Area poverty rates (not adjusted for housing costs) were all below 10% in 2019, below the state and national rates and well below poverty rates in 2010 and 2016. The Census Bureau publishes a supplemental poverty rate for states adjusted mainly for housing costs. In 2019 California’s supplemental poverty rate was 17.2% compared to the official rate of 11.8%
Median household income increased in most Bay Area counties in 2019. These gains adjusted for inflation far outpaced the Bay Area increase in consumer prices.
The ABAG RHNA allocation methodology committee made their final recommendation on Friday. The regional allocation from HCD is described first and then the decision on local area allocation afterwards.
The California Department of Housing and Community Development (HCD) just released the Regional Housing Needs Determination (RHNA) for the Bay Area for the period from June 2022 through December 2030. The HCD letter can be seen at https://hcd.ca.gov/community-development/housing-element/docs/ABAGRHNA-Final060920(r).pdf. The Bay Area target is 135% higher than the current target and includes 441,176 units distributed among four income groups – very low (for residents up to 50% of area median income (AMI)), low (50% to 80% of AMI), moderate (80% to 120% of AMI) and above moderate. A majority of the units needed are in the very low to moderate income groups.
HCD used a new methodology to develop the needs assessment. Recent state legislation required HCD to include housing units to reduce the number of households that are overcrowded and cost-burdened. HCD compared the Bay Area to shares in comparable regions. HCD has always included units to return the region to a normal vacancy rate and to replace demolished housing.
The final determinant is allowance for units to accommodate the region’s expected growth. HCD used new population projections from the state Department of Finance (DOF) instead of the regional growth forecast developed by ABAG that projected 400,000 more residents than DOF in 2030.
Only half of the Bay Area housing needs according to this analysis come from growth. The rest come as a result of correcting existing shortages.
The next step is for ABAG to allocate the units to local areas, which will take place over the coming months. Current emphasis is on allocating units more to areas that have high amenities and to areas that have substantially more jobs than housing.
The ABAG RHNA allocation methodology committee recommended an approach that allocates an above average share of the regional RHNA to cities that are considered high opportunity areas and cities that have good auto and transit proximity to jobs. The result is that the largest % increases in housing went to communities along the peninsula.
The details and city by city allocations are found in the meeting materials that can be found on the ABAG website.
The recommended allocation is alternative 8A that allocates 70% of the low and very low-income units based on high opportunity areas and 15% each to proximity to jobs for transit and autos. For moderate and above moderate income units the allocation was based 40% on high opportunity areas and 60% on auto proximity to jobs.
These economic updates are authored by Stephen Levy, Director of the Center for Continuing Study of the California Economy, and a member of the Bay Area Council Economic Institute board.
August 26, 2020
China’s recent actions are fueling the fire for a further divide with the United States. With China’s leadership overstepping, other countries have taken notice and are beginning to push back . This article by Sean Randolph in The Times of India details how China’s actions will have repercussions on a global scale.
• Between April and July, the Bay Area recovered just over one quarter of the jobs lost between February and April trailing the state and nation. • The Santa Rosa, San Rafael and San Jose metro areas recovered the highest % of jobs lost. • The regional unemployment rate was 2.7% in February, 13.1% in April and 10.6% in July. Unemployment rates declined only slightly in the three large metro areas. Total unemployment declined only slightly from 527,300 in April to 436,700 in July. • This update also looks at industry sector trends, air travel data and the Bay Area Regional Housing Needs Assessment (RHNA)
California and the Bay Area Lagged the Nation in Job Recovery in June
The state and Bay Area recovered just over one quarter of the jobs lost by July compared to 1/3 for the nation. This is most likely the result of our more cautious reopening pace. The July data shows the impact of restrictions in states like Florida, Texas and Arizona as well as the recent restrictions in California and the Bay Area.
The share or jobs recovered by July varies among the metro areas with larger gains in the smaller metro areas except for the relatively strong performance in the San Jose metro area.
Unemployment rates rose sharply between February and April throughout the region. The regional unemployment rate declined from 13.1% in April to 10.6% in July. As of July, three of the seven metro areas finally returned to single digit unemployment rates.
The number of unemployed residents fell very slightly as some people reentered the workforce in the past two months. The largest decline was in the San Jose metro area but that was only a decline of 10,100. 436,700 residents were unemployed in July up from 116,000 in February.
The largest job losses were in Leisure and Hospitality where half the jobs went away between February and April. Construction showed the biggest recovery by July (81.0%) while the Information and Wholesale Trade sectors had relatively small recovery rates so far. Government is the only sector to lose jobs after April. The overall job losses and recovery are affected by the continuing decline in government jobs. Most of the improvement in July was a rebound in Retail and Hospitality and growth in Professional Services.
Air travel plummeted after February with losses of 90% or more. SFO has reported June data and there was a small recovery in June. Sill, SFO had a decline of 89.9% in June only slightly better than the 94.3% loss in May. International travel fell even more. San Jose airport did slightly better in June with an 86.3% decline. There was a pickup in July. So far only Oakland airport has reported and travel rebound so the July loss was just 72.3%, still very large.
The California Department of Housing and Community Development (HCD) just released the Regional Housing Needs Determination (RHNA) for the Bay Area for the period from June 2022 through December 2030. The HCD letter can be seen at https://hcd.ca.gov/community-development/housing-element/docs/ABAGRHNA-Final060920(r).pdf. The Bay Area target is 135% higher than the current target and includes 441,176 units distributed among four income groups – very low (for residents up to 50% of area median income (AMI), low (50% to 80% of AMI, moderate (80% to 120% of AMI and above moderate. A majority of the units needed are in the very low to moderate income groups.
HCD used a new methodology to develop the needs assessment. Recent state legislation required HCD to include housing units to reduce the number of households that are overcrowded and cost-burdened. HCD compared the Bay Area to shares in comparable regions. HCD has always included units to return the region to a normal vacancy rate and to replace demolished housing.
The final determinant is allowance for units to accommodate the region’s expected growth. HCD used new population projections from the state Department of Finance (DOF) instead of the regional growth forecast developed by ABAG that projected 400,000 more residents than DOF in 2030.
Only half of the Bay Area housing needs according to this analysis come from growth. The rest come as a result of correcting existing shortages.
The next step is for ABAG to allocate the units to local areas, which will take place over the coming months. Current emphasis is on allocating units more to areas that have high amenities and to areas that have substantially more jobs than housing.
These economic updates are authored by Stephen Levy, Director of the Center for Continuing Study of the California Economy, and a member of the Bay Area Council Economic Institute board.
August 6, 2020
The United States’ relationship with China is under growing pressure as bilateral differences sharpen. Politics and economics are both in play on issues ranging from trade and investment to Huawei, security and technological leadership. With this, U.S. companies that want to grow their China business – and Chinese companies wanting to do business here – must navigate an increasingly complex landscape. This week, Sean Randolph, Senior Director at the Bay Area Council Economic Institute, discussed the outlook for U.S. – China relations in our weekly webinar series with Robert Atkinson, President, Information Technology and Innovation Foundation (ITIF); Lyric Hughes Hale, Editor-in-Chief, EconVue; and Andy Rothman, Investment Strategist, Matthews Asia.
July 30, 2020
With US-China relations at a low point and political pressure to decouple the two economies growing, companies in Silicon Valley are starting to look for alternative countries to engage with to expand investment and trade. With India-U.S. relations growing stronger, Silicon Valley is starting to place their bets on India. This article by Sean Randolph in The Times of India details why India has become the interest of Silicon Valley.
• Between April and June, the Bay Area recovered just over one quarter of the jobs lost between February and April. • The Napa, Santa Rosa, San Rafael and San Jose metro areas recovered the highest % of jobs lost. • The regional unemployment rate was 2.7% in February, 13.1% in April and 12.1% in June. Unemployment rates declined only slightly in the three large metro areas. Total unemployment declined only slightly from 527,300 in April to 497,500 in June. • This update also looks at industry sector trends, air travel data and the Bay Area Regional Housing Needs Assessment (RHNA)
California and the Bay Area Lagged the Nation in Job Recovery in June
The state and Bay Area recovered just over one quarter of the jobs lost by June compared to 1/3 for the nation. This is most likely the result of our more cautious reopening pace. The July data next month will show the impact of restrictions in states like Florida, Texas and Arizona as well as the recent restrictions in California and the Bay Area.
The share or jobs recovered by June varies among the metro areas with larger gains in the smaller metro areas except for the relatively strong performance in the San Jose metro area.
Unemployment rates rose sharply between February and April throughout the region. The regional unemployment rate declined from 13.1% in April to 12.1% in June. All metro areas had rates over 10%.
The number of unemployed residents fell very slightly as some people reentered the workforce in the past two months. The largest decline was in the San Jose metro area but that was only a decline of 10,100. Nearly 500,000 residents were unemployed in June up from 116,000 in February.
The largest job losses were in Leisure and Hospitality where half the jobs went away between February and April. Construction showed the biggest recovery by June (84.5%) while the Information and Professional and Business Services sector had relatively small recovery rates so far. Government is the only sector to lose jobs after April.
Air travel plummeted after February with losses of 90% or more. SFO has reported both May and June data and there was a small recovery in June. Sill, SFO had a decline of 89.9% in June only slightly better than the 94.3% loss in May. International travel fell even more.
The California Department of Housing and Community Development (HCD) just released the Regional Housing Needs Determination (RHNA) for the Bay Area for the period from June 2022 through December 2030. The HCD letter can be seen athttps://hcd.ca.gov/community-development/housing-element/docs/ABAGRHNA-Final060920(r).pdf. The Bay Area target is 135% higher than the current target and includes 441,176 units distributed among four income groups – very low (for residents up to 50% of area median income (AMI), low (50% to 80% of AMI, moderate (80% to 120% of AMI and above moderate. A majority of the units needed are in the very low to moderate income groups.
HCD used a new methodology to develop the needs assessment. Recent state legislation required HCD to include housing units to reduce the number of households that are overcrowded and cost-burdened. HCD compared the Bay Area to shares in comparable regions. HCD has always included units to return the region to a normal vacancy rate and to replace demolished housing.
The final determinant is allowance for units to accommodate the region’s expected growth. HCD used new population projections from the state Department of Finance (DOF) instead of the regional growth forecast developed by ABAG that projected 400,000 more residents than DOF in 2030.
Only half of the Bay Area housing needs according to this analysis come from growth. The rest come as a result of correcting existing shortages.
The next step is for ABAG to allocate the units to local areas, which will take place over the coming months. Current emphasis is on allocating units more to areas that have high amenities and to areas that have substantially more jobs than housing.
These economic updates are authored by Stephen Levy, Director of the Center for Continuing Study of the California Economy, and a member of the Bay Area Council Economic Institute board.
July 8, 2020
With US-China relations at a low point and political pressure to decouple the two economies growing, it is important that the “Phase 1” trade deal signed in January be made to work. This column from the South China Morning Post by the Institute’s Senior Director Sean Randolph discusses where things stand.
The Trump administration’s plan to suspend the issuance of H-1B and other temporary visas through the end of 2020 is a direct challenge to the business model that has made Silicon Valley and other U.S. technology centers successful. It is also a model that underpins the Bay Areas economic and technological leadership. The ability to attract the best trained and most creative people is a large part of the explanation for why its economy has excelled. While the short-term impacts of this new policy will be limited (the executive order does not apply to visa holders already in the country), restricting flows of talent to the U.S. will come at significant long-term cost to competitiveness and to Americans whether or not they work in tech. Sean Randolph, the Institute’s Senior Director wrote an article for Medium.com outlining the implications from this plan.
Crises can bring people together, united by a common purpose, or it can drive them apart. So far, the Covid-19 crisis is driving the United States and China even farther apart. Sean Randolph, the Institute’s Senior Director wrote an article for the San Francisco Business Times outlining the relations between these powerhouses as tensions rise.
Find out where these relations stand by reading the article below:
Article by Sean Randolph on Medium.com, June 19 2020
Crises can bring countries together, united by a common purpose, or it can drive them apart. So far, the COVID-19 crisis is driving the United States and China farther apart. Here’s where things stand:
On the U.S. side President Trump has suggested, without evidence, that the virus escaped from a government lab in Wuhan. This comes as Chinese investment in the U.S. is subjected to greater scrutiny by the Committee on Foreign Investment in the US (CFIUS)and the Commerce Department’s review of U.S. technology exports with potential “military end use” has tightened; a new proposed rule would give Commerce broad powers to unwind deals impacting internet and communications technology supply chains. Huawei remains a target, with a new proposal in May to bar overseas semiconductor manufacturers that use US equipment or software from selling to Huawei without government approval. Other nations are being pressed by the administration to enact similar restrictions, an argument it appears to be losing.Congress is weighing in with sanctions reacting to China’s treatment of Uighurs and its extension of security law to Hong Kong. Through all this US government officials are increasingly depicting China as an adversary, as assertion that without more nuance could prove self-fulfilling.
China for its part, has reacted defensively and aggressively to questions regarding the origin of the virus, attacking governments that have suggested it be explored. Inside China, scientists researching the topic are now required to submit their work for government review before it can be published. Attempts like this to control the narrative undermine trust and discourage cooperation. At a broader level, China is asserting influence across a broad international front, often with a hard edge. The decision of the National People’s Congress to apply China’s national security law in Hong Kong is increasing tensions further.
All this is happening in the middle of the worst economic crisis since the Great Depression. Tensions are reflected in falling investment in both directions: according to the Rhodium Group Chinese venture investment in the US has fallen off a cliff and direct Chinese investment in the US is at its lowest level in a decade; US venture investment in China, though healthy,is slowing and direct investment is flat.
Global health crises call for leadership and cooperation. During the global financial crisis of 2008-09 US and Chinese leaders consulted closely on measures to revive the global economy. Not so today.
But there’s also a counter-narrative. Most U.S. companies operating in China are positive about the relationship and want and expect business to continue. As just one example, Tesla’s entry into the electric vehicle market is proving an enormous success. And U.S. and Chinese companies and their scientists are working closely together to address the COVID-19 challenge. So despite diverging paths at the national level,private and sub-national cooperation remains strong.
The other piece of good news is that the Phase 1 trade agreement signed in January is working–up to a point.The deal itself is a modest step that paused the escalation of tariffs. China agreed to increase purchases of US agriculture and manufactured products by $200 billion over two years, address technology transfer and intellectual property concerns, and open markets to financial services such as insurance, banking, payments services and securities. The hardest issues –relating to China’s industrial policies –were left to a Phase II negotiation and most of the tariffs imposed during the trade war remain in place. These deep and possibly intractable issues threaten future conflicts.
But let’s work with what we have. Key parts of the Phase 1 agreement are being implemented in good faith by China. Financial services markets have opened and U.S. companies are stepping in. Technology transfer concerns were already addressed through a new Foreign Investment Law. The opening in financial services was already underway. A road map for how China will continue intellectual property reform has been released. Longstanding regulatory barriers in agriculture are also being addressed, in fields such as agricultural biotechnology and phytosanitary standards. Implementation is a concern, but key regulatory commitments are being met.
Meeting quantitative targets for the purchase of US goods and agriculture is proving more difficult. Most observers believe the targets were unrealistic to begin with,but with COVID-19 slowing China’s economy and the world’s economy in recession,hitting those mark swill be even harder. Contrary to expectations, US manufactured exports to China are falling, not growing, and agricultural exports have barely moved. The fact that the targets are based on government-led purchases more than on private market conditions raises further questions about its sustainability as a vehicle for growing trade.
What to do? The agreement includes a force majeure clause and if both countries agree its terms can be changed. If another downward spiral in relations is to be prevented the Phase 1 agreement must be made to work. China should be expected to deliver on its commitments, but on terms that are practical in today’s conditions. A successful Phase 1, modified or repackaged, can demonstrate the willingness of both countries to work together. An abrogation by either side would be seriously destabilizing.
A decoupling of the two economies is already happening by both governments, starting with technology and supply chains. The scope of separation, however, should be limited. These are the world’s two largest economies, and a complete decoupling is neither desirable nor possible. To find a new floor, both governments should come to an agreement on areas where interests will diverge, where cooperation should continue, and areas where both could lead. That process of pragmatic realignment should start with the Phase 1 agreement, which at this moment is pivotal and must be made to work
June 23, 2020
BART ridership has fallen less significantly at stations located in neighborhoods with a higher percentage of Black and Latinx residents. An analysis of year-over-year change in BART entries by station in the months following the statewide shelter-in-place order shows that ridership was less impacted at stations located in predominately Black and Latinx zip codes.
Station entries across the whole BART system dropped 93% year-over-year in May, but the loss in ridership was not consistent across all stations. Ridership at Orinda Station, which is located in a zip code where 72% of the population is white, saw a 97% drop in year-over-year ridership. In comparison, Richmond Station, which is located in a zip code where 75% of the population is Black or Latinx, saw an 82% drop in year-over-year ridership. This trend holds true across the system: the higher the share of Black and Latinx residents, the less significant the decline in ridership.
A high unemployment rate, shifts to remote work for much of the workforce, and cutbacks in service and frequency have all impacted BART ridership levels. The potential health risks associated with riding transit during the pandemic are a significant public health concern, and agencies are taking steps to ensure physical distancing and to make the transit experience as safe as possible. This analysis reveals that Black and Latinx communities are more reliant on transit post COVID-19 than white communities, indicating higher exposure to potential health risks. Ensuring that transit services do not contribute to the continued spread of COVID-19 is not only an economic or health issue, it is also a racial equity issue.
June 19, 2020
The F50 Global Capital Summit® (Summit) is Silicon Valley’s largest international investor conference. The spread of the coronavirus has highlighted the imperative for new technologies and solutions in the health and medical area. 20+ leaders including leading physicians, investors, and influencers had joined the Global Committee which is the volunteering advising board and curation of the content for the summit. Innovators, leaders and influencers in the startup ecosystem are vital to accelerating progress worldwide. The video below features the Institute’s very own Senior Director, Sean Randolph, participating in a roundtable alongside Brenda Santoro, Silicon Valley Bank, Dr. Bechara Choucair, Kaiser Permanente, and Vish Mishra, Clearstone Venture Partners, as they discuss how to elevate healthtech innovation.
June 19, 2020
Sean Randolph, the Institute’s Senior Director, appeared on the latest episode of the Silicon Valley Podcast with Shawn Flynn.
This episode Sean Randolph and Shawn Flynn talk about: Which countries have the strongest ties and influence on Silicon Valley? How big of an economic influence does Silicon Valley really have on the state of California? How does trade policy affect startups? What role does the Bay Area Council play in Silicon Valley and the rest of the world? What laws are being discussed that will affect all of us in the coming years?
Find out the answers by listening to the podcast now! Listen now
June 11, 2020
The COVID Economy
As the Bay Area completes its 13th week since the original shelter-in-place order was put in place, the policy discussion has shifted from coordinating emergency response to COVID-19 toward questions about reopening and economic recovery. On Tuesday, May 26 Governor Newsom announced California would begin moving into Phase Three of the state’s four-step reopening program. Many Bay Area counties have been more cautious to reopen—some still not allowing restaurants with outdoor seating—as health experts fear opening quickly could cause a new wave of infections.
The economic damage wrought by almost three months of lockdown has been staggering. By May 14, California’s Employment Development Department had processed 4.94 million unemployment claims since mid-March. This amounts to an estimated 25 percent of the state’s pre-pandemic labor force. The state government also faces an untenable $53 billion budget deficit, and projections indicate US GDP may have fallen by up to 12.4 percent since the beginning of 2020.
Facing this daunting outlook, the central question remains whether there is a rapid rebound for the economy in store, or if high unemployment rates and slower economic growth will continue for some time. The difference between a rebound that takes only a few quarters versus many years is stark, and the economic trajectory that California and the U.S. follow will be heavily determined by the federal and state policy responses and future virus transmission rates.
While this crisis is unprecedented in human history in terms of the speed of economic destruction, this short analysis looks for insights on the path forward.
Looking to the Past
Among comparable economic downturns, the Great Depression bears the only real resemblance to the coronavirus fallout. Today’s unemployment estimates—ranging between 14 and 20 percent in most states for April 2020—are similar in scale to the 25 percent unemployment rate at the height of the Great Depression. It is instructive to note that the Depression economy was eventually stabilized by public works projects and government-sponsored employment in the New Deal.
More recently, the recessions of the last four decades have shown the increased power of monetary policy in driving economic change. The 1981 Recession was primarily a human-made contraction designed to curb inflation at the cost of jobs, though economic rebound was fast and job losses were mitigated relatively quickly. The 1990 Recession was much milder than its 1981 counterpart and resulted in a shallow divot in employment levels. However, though the recession ended in mid-1991, it would take an additional year for unemployment levels to begin falling.
The 2001 Recession is harder to attribute to any one factor. However, while it was relatively inconsequential from a GDP perspective, the recession caused a severe drop in employment that failed to fully recover through the early 2000s and peaked at 6.3 percent in June of 2003.
Policy intervention during the Great Recession closely mirrors the types of economic response implemented during the current pandemic. Then, as now, the Federal Reserve announced a series of interest rate reductions meant to keep the economy from free fall. The American Recovery and Reinvestment Act of 2009 also channeled money to affected businesses, predominantly banks, and individuals in the same way as the CARES Act aid package passed in March does. However, the 2009 policy response was largely meant to stimulate economic growth—in fact, the recession was technically over by June 2009—while the CARES Act of 2020 was largely a lifeline to small businesses and unemployed individuals meant to replace some lost revenues and wages. Notwithstanding the 2001 contraction, a general trend can be found in each of these examples that is supported by economic theory. Namely, a more severe decline in output tends to lead to a greater and more prolonged drop in employment levels.
Looking at Potential Shapes of Recovery
Most downturns have also been the results of several identifiable economic factors. However, the pandemic means consumer confidence, community health, and supply-chain stability will be intimately connected with economic recovery.
What will recovery look like then? Economic optimists—including those in the White House—hope for a “V-shaped” recovery. Proponents of a V-shaped recovery point primarily to fast public response in the form of stimulus and the temporary nature of shutdown as reasons to believe in a rebound. As the economy reopens, a V-shaped recovery depends on consumers returning to—and potentially exceeding—their pre-COVID buying patterns and businesses hiring back significant percentages of employees that have been furloughed or laid off. The stock market rally through April and May, with the S&P 500 erasing its yearly losses on June 7, combined with declining unemployment filings is positive evidence of a potential V-shaped recovery.
The question of the permanency of furloughs and lay-offs may be the most pivotal unknown that will determine the shape of the recovery. Today, many workers currently unemployed remain optimistic about their prospects of returning to work after the pandemic. A Washington Post-Ipsos poll conducted indicated 77 percent of furloughed workers expect to return to their previous jobs, but a University of Chicago study anticipates only 42 percent will find this expectation fulfilled. The uncertainty of employment, as well as of consumer and business demand, as economies reopen makes understanding the long-term scope of economic fallout difficult.
A longer recovery path points to a form of U-shaped recovery. U-shaped recovery models incorporate slow rehiring trends and future infection fears that reduce economic growth for multiple years. In a report on June 1, the Congressional Budget Office projected potential lost economic output from coronavirus to top $7.9 trillion, with the economy finally returning to potential output in 2029. Early indications of a U-recovery or some combination of U and V-shapes are visible in some post-lockdown countries, including China.
The case for slow recovery has some precedent. Historically, most recessions and downturns in the 20th and 21st century resulted in some form of U-shaped or “swoosh” recovery that endured low output and high unemployment levels for several quarters.
More concerning evidence for slow recovery points to pre-pandemic business weakness as a reason to believe in economic stagnation. A report from the World Economic Forum found that “40% of all US corporate debt was rated BBB, just above junk, going into the crisis” before coronavirus. Rates of business default and bankruptcy due to credit down-rating may therefore rise due to the pandemic. Corporate instability could slow the pace of rehiring even once the economy itself finds a footing. Small businesses have seen ever greater impacts, as their limited cash reserves and concentration in service industries have made them the front line for COVID-19-related permanent business closures.
Conclusion
The fluid nature of the COVID-19 pandemic makes predicting the trajectory of the US economy hypothetical at best. Placing the coronavirus crisis in the context of historical recessions provides some insight into government response to the current downturn. Predicting the post-COVID economy will also be reliant on understanding the virus’s progression—and responses to it—in the coming months. While a rebound recovery and “back to work” economic model may be achievable, a prolonged recovery increasingly appears to be America’s economic future. If a slow recovery becomes the economic reality, policymakers and businesses will need to both draw on the past and innovate for the future to develop effective responses to limit long-term economic damage.
The Global Trade and Innovation Policy Alliance (GTIPA), a body of leading trade, economic and innovation think tanks around the world that work together to support growth through innovation and open market policies issued a statement are calling for policy measures to assure the supply of essential medical goods and to support the innovation that will enable future COVID-19 vaccines and treatments. Issued on May 18 to mark the opening of the WHO’s World Health Assembly, it addresses tariffs, export bans, the cross-border flow of epidemiological and clinical data, and the protection of intellectual property rights, issues which if not addressed could slow the global health response to COVID-19 and inhibit future research.
The Coronavirus (COVID-19) Pandemic in the Bay Area.
The Bay Area Council Economic Institute is here to help as our region grapples with the fallout of a global pandemic. In order to help inform our partners, we are highlighting both the immediate vulnerabilities of various high-risk individuals, as well as the relative economic vulnerability that our state faces to natural disasters more generally.
Click on the button below to see our full report, with interactive maps.
Data released this week by the U.S. Department of Labor shows the first major impacts of the COVID-19 pandemic on the economy. While markets have been volatile for weeks—pricing in the possibility of broad spread of the virus and a possible recession—preliminary employment numbers for early March paint a picture of the actual economic contraction.
For the week ending March 14, 2020, new unemployment claims in the U.S. totaled 250,892, an increase from 200,375 in the week prior (25% growth). In California, new claims grew to 58,208 from 43,385 the week prior (34% growth). The Golden State accounted for nearly 30% of all new national unemployment claims for the week of March 14. For comparison, California accounted for approximately 20% in the week prior and accounts for a little less than 12% of national employment.
Washington State, another area hard hit by COVID-19’s initial outbreak, and Nevada, a state heavily dependent on tourism, also topped the list for new claims.
While the data through the middle part of March paints a picture of a relatively slow increase in unemployment in California, recent statements from the governor’s office portray a much more alarming level of job loss in the current week:
• According to estimates compiled by the New York Times, new unemployment claims in California in the week ending March 21, 2020 have already topped 190,000.
• New unemployment claims at this level would be the highest since record keeping began in 1987.
• New claims have topped 100,000 in the state only twice—during the 1992 recession (at 104,000) and in the middle of the Great Recession in 2010 (at 115,000).
The pace of job loss is what will make this crisis especially unique; as such, it is not yet possible to know the industries that have been impacted most. However, the decline in travel and shelter-in-place orders across Northern California are already taking a toll on airlines, hotels, restaurants, and other businesses connected to leisure and hospitality:
• According to Smith Travel Research, hotel occupancy in San Francisco fell to 39% in the week ending March 14, 2020, compared to 80% occupancy in the same week of 2019.
• According to Foursquare, foot traffic in the Bay Area’s three major airports on March 13, 2020 was 25% lower than in mid-February.
• The shelter-in-place order has also pushed restaurants to offer only delivery or carryout options, and it is likely that consumers have shifted their food purchases to grocery stores as concerns over the spread of the virus grow. Downloads of Instacart, Walmart’s grocery app, and Shipt increased 218%, 160%, and 124%, respectively, last week compared with a year prior, according to Nielsen data.
In the coming weeks, the Economic Institute will continue to aggregate and analyze pertinent economic data points as they are released. The team is also trying to understand the broader economic shifts that will remain after this crisis passes. How do companies think about global supply chain risk management post-COVID-19? Do work from home policies become ubiquitous? Does the automation of certain jobs in the service sector slow recovery? Using the Bay Area Council’s corporate membership and the Economic Institute’s thought partners, we will be releasing a series of short papers over the next month that explore these issues, and more.
According to the 2019 California Tax Credit Allocation Committee staff reports, there were 23 new construction projects of below market housing, with a total of 1,912 units, across six counties of the nine-county Bay Area. Below market rate housing, or “affordable housing”, refers to housing units developed in whole or in part with public subsidies and are reserved for low-income residents. Each project in California requested federal and/or state tax credits to finance the new construction of housing units with rents affordable to households earning 30-60% of area median income (AMI). The project costs consist of land and acquisition, construction costs, construction contingency, architectural/engineering, construction interest, permanent financing, legal fees, reserves, other costs, developer fees, and commercial costs. Project costs are analyzed to determine the reasonableness of all fees within TCAC’s underwriting guidelines and TCAC limitations.
In 2019, the average construction cost of new below market rate housing in the Bay Area was $664,455 per unit. In comparison, other projects across California (excluding the Bay Area), on average cost $385,185 per unit of below market rate housing. At $737,417 per unit, San Francisco County had the highest per unit cost of construction in the Bay Area. San Francisco is often regarded to as the most expensive place to build housing, and this holds true in 2019. Projects in Santa Clara County and Sonoma County were below the Bay Area average, with average values of $621,517, and $497,360, respectively.
These numbers reflect the region’s housing crisis as it has come increasingly more expensive to construct new housing units within the Bay Area. In particular, counties such as Alameda, San Francisco, San Mateo, and Napa have higher average per unit costs than the Bay Area as a whole, and are significantly higher than the rest of the state.
According to newly released American Community Survey data, the nine-county Bay Area experienced a negative net domestic migration of 50,766 residents in 2018. This includes individuals relocating to and from all states across the U.S., and the surrounding 49 counties in California. The data shows a clear economic divide in the types of households moving in versus those that are moving out. The median household income for residents leaving the Bay Area was $73,000, whereas the median household income for residents who moved to the Bay Area was $105,000. Residents earning a total household income less than $25,000 annually experienced the largest negative net domestic migration with 20,506 residents moving out of the Bay Area. On the other end of the spectrum, residents earning a total household income greater than $200,000 annually experienced the only positive net migration.
These numbers simultaneously reflect the region’s housing crisis and its strong job market that continues to attract high-income households to the region. The combination of low-wage workers leaving, and high-skilled, highly compensated talent relocating to the nine-county region has contributed to the income inequality present within the region today.
The largest net inflows are younger than age 35 with household incomes over $200,000. It is important to note, however, that only 21% of these new residents to the Bay Area—ages 18-35, with a total household income greater than $200,000—were the head of their households.
Job Growth Slows Again But Continues to Outpace the State and Nation
The highlights:
• The Bay Area added 2,900 jobs in December (seasonally adjusted), following a gain of 4,200 jobs in November and 91,500 in the past 12 months. Average monthly gains in the past six months were well below the average for the previous six months. Is this a warning sign?
• The job growth in for the past year was primarily accounted for by gains in the San Francisco and San Jose metro areas.
• The regional unemployment rate was 2.2% in November down from 2/3% in November and down from 2.5% a year ago.
• Population growth slowed in 2019. Is this another warning sign? A separate update next week will look at population estimates and projections.
The Bay Area Continues to Outpace the State and Nation in Job Growth
Year over year job growth of 2.2% (down from 2.4% last month) far outpaced the 1.4% growth for the nation and 1.8% gain in the state. The state once again is outpacing the nation.
Job growth has slowed in recent months with most of the 2019 gains coming by June. Has slow population growth and a shortage of housing supply and affordability finally begun to affect job growth. There are strong indications that companies want to expand here despite some exodus but can we find the needed workers and develop policies to make this happen?.
The San Jose metro area led the region in job growth over the past year followed by the San Francisco metro area. The Santa Rosa and San Rafael metro areas also posted strong growth.
Unemployment rates (2.2% for the region) in December 2019 and at levels not seen in almost 20 years at the height of the dot.com boom. But they are unlikely to fall further raising the question of where new workers to support job growth and replace retiring workers will come from.
Regional labor force growth in December was up 0.5% (23,100) from the year earlier levels. This is positive growth but not nearly enough to sustain job growth even with increasing in commuting from adjacent counties.
Year over year job growth has remained in a narrow range since early in 2017. This occurred despite slowing population growth and rising outmigration in the face of high housing costs. In December 2019 year over year job gains declined by over 6,000 jobs from last month’s report.
Housing permit levels declined in the first eleven months of 2019 though the past two months showed year over year gains. The probable causes are increasing construction costs and a shortage of labor. In most cases fees are due when the permit is approved giving another reason to delay taking out the permit even though the project is already approved. On the other hand there has been a recent surge in new housing approvals and projects previously approved being completed.
There is some evidence that the surge in resale home prices has peaked though that is a separate market from the rental market and even more separate from funding and approval for BMR units. Median resale prices rose in December after six months of declines. But that increase could be from a change in the mix. The Case Shiller price index, which matches comparable homes, has the Bay Area index down 0.4% for the year ending October 2019.
The next round of the state-mandated Regional Housing Needs Assessment (RHNA) is approaching for the Bay Area. State law has added two new categories of need: 1) reducing overcrowding and 2) reducing the number of cost-burdened households. This will increase the new regional housing target substantially and tilt it more towards building housing for low and moderate income residents. Stay tuned for updates as the process unfolds.
All of these recent trends underscore the importance of Bay Area Council initiatives on housing and improving mobility options to reduce long commutes, help residents and employers and contribute to the environment.
These economic updates are authored by Stephen Levy, Director of the Center for Continuing Study of the California Economy, and a member of the Bay Area Council Economic Institute board.
Job Growth Slows But Continues to Outpace the State and Nation
The highlights:
• The Bay Area added 3,900 jobs in November seasonally adjusted), following a gain of 4,900 jobs in October and 97,100 in the past 12 months. Average monthly gains in the past six months were well below the average for the previous six months.
• The job growth in for the past year was primarily accounted for by gains in the San Francisco and San Jose metro areas.
• The regional unemployment rate was 2.3% in November the same as October down from 2.5% a year ago.
• There was strong growth in real GDP throughout the region in 2018.
The Bay Area Continues to Outpace the State and Nation in Job Growth
Year over year job growth of 2.4% (down from 2.6% last month) far outpaced the 1.5% growth for the nation and 1.8% gain in the state. The state once again is outpacing the nation.
The San Francisco metro area led the region in job growth over the past year followed by the San Jose metro area. The Oakland, Santa Rosa and San Rafael metro areas also posted strong growth.
Unemployment rates (2.3% for the region) in November 2019 and at levels not seen in almost 20 years at the height of the dot.com boom. But they were the same as in October suggesting that rates may not be likely to decline further.
Regional labor force growth in November was up 0.6% (25,000) from the year earlier levels. In October year over year growth was 0.9%.
Year over year job growth has remained in a narrow range since early in 2017. This occurred despite slowing population growth and rising outmigration in the face of high housing costs. In November 2019 year over year job gains declined a bit from last month’s report.
Monthly job gains have fluctuated in recent months with smaller gains in the past three months. Is this the beginning of a slowdown tied to slowing U.S. and world growth and labor shortages? Future months will clarify if this is the beginning of a trend. Job growth over the full past 12 months remains strong.
The Bay Area posted a 6.8% real GDP growth in 2018, more than double the national growth rate of 2.9%. The Bay Area was led by the San Jose metro area gain of 10.1%. The state GDP growth in 2018 was 4.3%.
Housing permit levels declined in the first ten months of 2019 though the past two months showed year over year gains. The probable causes are increasing construction costs and a shortage of labor. In most cases fees are due when the permit is approved giving another reason to delay taking out the permit even though the project is already approved. On the other hand there has been a recent surge in new housing approvals and projects previously approved being completed.
There is some evidence that the surge in resale home prices has peaked though that is a separate market from the rental market and even more separate from funding and approval for BMR units. Median resale prices rose a bit in November after six months of declines. The Case Shiller price index, which matches comparable homes, has the Bay Area index down 0.7% for the year ending September 2019.
The next round of the state-mandated Regional Housing Needs Assessment (RHNA) is approaching for the Bay Area. State law has added two new categories of need: 1) reducing overcrowding and 2) reducing the number of cost-burdened households. This will increase the new regional housing target substantially and tilt it more towards building housing for low and moderate income residents. Stay tuned for updates as the process unfolds.
These economic updates are authored by Stephen Levy, Director of the Center for Continuing Study of the California Economy, and a member of the Bay Area Council Economic Institute board.
Job Growth Continues, Unemployment Continues to Decline
The highlights:
• The Bay Area added 5,900 jobs in October seasonally adjusted), following a loss of 800 jobs in September (revised down and 104,000 in the past 12 months. State job growth has rebounded in recent months and CA job growth now well outpaces the nation.
•The job growth in for the past year was primarily accounted for by gains in the Oakland, San Francisco and San Jose metro areas.
• The regional unemployment rate was 2.3% in October down from 2.6% a year ago.
• There was strong growth in total and per capita income throughout the region in 2018.
The Bay Area Continues to Outpace the State and Nation in Job Growth
Year over year job growth of 2.6% (up from 2.5% last month) far outpaced the 1.4% growth for the nation and 1.8% gain in the state. The state once again is outpacing the nation.
The San Francisco metro area led the region in job growth over the past year followed by the San Jose metro area. The Oakland and San Rafael metro areas also posted strong growth.
Unemployment rates (2.3% for the region) in October 2019 were well below year earlier rates and at levels not seen in almost 20 years at the height of the dot.com boom.
Regional labor force growth continued in October up 0.9% (37,500) from the year earlier levels.
Year over year job growth has remained in a narrow range since early in 2017. This occurred despite slowing population growth and rising outmigration in the face of high housing costs. In October 2019 year over year job gains were at the top of the recent range.
Monthly job gains have fluctuated in recent months. Is this the beginning of a slowdown tied to slowing U.S. and world growth and labor shortages? Future months will clarify if this is the beginning of a trend. Job growth over the full past 12 months remains strong.
Per capita income grew by 7.4% in the Bay Area in 2018 far outpacing the national gain of 4.9%. Per capita income is above the national average in all counties except Solano in 2018.
Housing permit levels declined in the first nine months of 2019. The probable causes are increasing construction costs and a shortage of labor. In most cases fees are due when the permit is approved giving another reason to delay taking out the permit even though the project is already approved. On the other hand there has been a recent surge in new housing approvals and projects previously approved being completed.
There is some evidence that the surge in resale home prices has peaked though that is a separate market from the rental market and even more separate from funding and approval for BMR units. Median resale prices continue to be slightly below year earlier levels. The Case Shiller price index, which matches comparable homes, has the Bay Area index down 0.1% for the year ending August 2019.
The next round of the state-mandated Regional Housing Needs Assessment (RHNA) is approaching for the Bay Area. State law has added two new categories of need: 1) reducing overcrowding and 2) reducing the number of cost-burdened households. This will increase the new regional housing target substantially and tilt it more towards building housing for low and moderate income residents. Stay tuned for updates as the process unfolds.
These economic updates are authored by Stephen Levy, Director of the Center for Continuing Study of the California Economy, and a member of the Bay Area Council Economic Institute board.
Labor Force Growth Returns, Unemployment Continues to Decline
The highlights:
• The Bay Area added 800 jobs in following August (seasonally adjusted), following gains of 8,100 jobs in August (revised up) and 101,700 in the past 12 months. State job growth has rebounded in recent months and CA job growth now outpaces the nation.
• The job growth in for the past year was primarily accounted for by gains in the Oakland, San Francisco and San Jose metro areas.
• The regional unemployment rate was 2.2% in August down from 2.6% a year ago and the lowest since the dot.com boom. Unemployment fell to 95,000.
• Labor force growth picked up after several slow months partially answering the question of where the workers came from.
The Bay Area Continues to Outpace the State and Nation in Job Growth
Year over year job growth of 2.5% (up from 2.3% last month) far outpaced the 1.5% growth for the nation and 1.9% gain in the state. The state once again is outpacing the nation.
The San Francisco metro area led the region in job growth over the past year followed by the San Jose metro area with slower growth in other metro areas.
Unemployment rates (2.2% for the region) in September 2019 were well below year earlier rates and at levels not seen in almost 20 years at the height of the dot.com boom.
Regional labor force growth surged in September up 1.2% (51,900) from the year earlier levels.
Year over year job growth has remained in a narrow range since early in 2017. This occurred despite slowing population growth and rising outmigration in the face of high housing costs. In September 2019 year over year job gains were at the top of the recent range.
Monthly job gains declined in September. Is this the beginning of a slowdown tied to slowing U.S. and world growth and labor shortages? Future months will clarify if this is the beginning of a trend.
Bay Area job growth is far higher than population growth but the September data explains more of the job gains than in recent months’ data.
Labor force growth and declining unemployment account for 55,600 added jobs. The others could be accounted for by commuting or an increase in workers taking a second or third job. It is difficult to see future labor force gains unless the region can attract new workers with housing a key factor and unemployment is already near record lows. Immigration and housing policies are key to supporting future job growth.
Housing permit levels declined in the first eight months of 2019. The probable causes are increasing construction costs and a shortage of labor. In most cases fees are due when the permit is approved giving another reason to delay taking out the permit even though the project is already approved. On the other hand there seem to be a large number of projects openings and new projects in the pipeline but far yet from seeking permits.
There is some evidence that the surge in resale home prices has peaked though that is a separate market from the rental market and even more separate from funding and approval for BMR units. Median resale prices continue to be slightly below year earlier levels. The Case Shiller price index, which matches comparable homes, has the Bay Area index up 0.2% for the year ending July 2019.
These economic updates are authored by Stephen Levy, Director of the Center for Continuing Study of the California Economy, and a member of the Bay Area Council Economic Institute board.
These are the installments of a series of two-pager papers that will be released by the Economic Institute which analyze the connection of the Central Valley and Silicon Valley. The #Valley2Valley connection is key to California’s economic future. The focus areas of the two pagers are as follows: People and Places, Economic Transformation Potential, and Policy and Partnerships.
People & Places:
In recent years, the Central Valley has produced its own economic success stories, as households and companies have been attracted to an affordable quality of life that is increasingly unavailable on the state’s coasts. Given this confluence of momentum and opportunity, the Central Valley—and particularly, Fresno—is ripe for an economic transformation.
The Valley to Valley connection via high-speed rail can be the push that moves Fresno beyond its economic tipping point—where it becomes a key part of company re-location conversations, lands on lists of top destinations for new companies, and drives new investment into its downtown and surrounding areas. High-speed rail can unlock all of these possibilities by shrinking the physical distance between the Central Valley and Silicon Valley.
Promoting economic success in Fresno will benefit California tremendously.
With growth slowing in the large coastal metros, the Central Valley is perhaps the region of California most primed for growth. With each household or company that leaves for a lower-cost location – Nevada, Oregon, Texas or Arizona – California loses a potential future innovator or entrepreneur. Fresno provides important strengths to the state that should not be overlooked. Its large and growing population, lower costs of doing business, affordable housing, and untapped opportunities for innovation can be the building blocks of a dynamic economy if targeted infrastructure investments and policy innovations encourage the region’s growth
From an outsider’s perspective, the Central Valley is the state’s agricultural hub and a gateway to many of the national parks that make California the most visited state in the nation. However, a deeper look at the data paints an economic story that is much more varied and nuanced.
Fresno’s economy shows a great deal of promise, and its employment has increased steadily in recent years. The Valley to Valley connection can help it to cultivate a resilient set of industries that can both create strong economic growth and weather a downturn.
The Central Valley is one of the few remaining places in California where it is still possible to envision and plan for significant growth.
With thoughtful planning and a proactive economic development strategy, Fresno has the potential to become California’s next rapidly-growing economic hub. Without a proper strategy, the Valley to Valley connection will only serve to shuttle workers out of the Central Valley every day to their jobs in Silicon Valley, with little change to the mix of industries represented in Fresno. The new proximity to the Bay Area that high-speed rail creates will make it easier for Silicon Valley executives to visit satellite locations, for venture capitalists to explore new opportunities, and for workers to commute in multiple directions—to the benefit of not just Fresno, but California as a whole.
While Fresno’s economy has its own unique strengths, policy and partnerships across government, businesses, universities, and other groups are needed to take full advantage of the high-speed rail connection that will bring immense opportunities to the Central Valley and the Northern California Megaregion. Many of the pieces of this strategy have already been put in place by local organizations, institutions, and leaders, but more can be done to build on this work and spur increased growth and economic transformation. In this two-pager, we identify 4 key recommendations and the policy or programmatic actions that can drive them toward implementation.
Another Solid Month, Is Job Growth Finally Slowing?
The highlights:
• The Bay Area added 5,100 jobs in August (seasonally adjusted), following gains of 5,600 jobs in July and 12,100 in June. State job growth has rebounded in recent months and CA job growth now outpaces the nation.
• The job growth in August was accounted for by gains in the Oakland, San Francisco and San Jose metro areas with no overall growth in the other metro areas.
• The regional unemployment rate was 2.7% in August down from 2.8% a year ago.
• With job growth far outpacing population and labor force growth, where are the workers coming from and can it continue?
The Bay Area Continues to Outpace the State and Nation in Job Growth
Year over year job growth of 2.3% (down from 2.4% last month) far outpaced the 1.4% growth for the nation and 1.8% gain in the state. The state once again is outpacing the nation.
The San Francisco metro area led the region in job growth over the past year followed by the San Jose metro area with slower growth in other metro areas.
Unemployment rates in August 2019 were slightly below year earlier rates indicating that the decline in rates may be nearing an end. Unemployment rates in summer months are higher than in other months so the year over year trend is important.
Regional labor force growth returned in August up 0.7% from the year earlier and is far below the 2.3% regional job growth.
Year over year job growth has remained in a narrow range since early in 2017. This occurred despite slowing population growth and rising outmigration in the face of high housing costs. In August 2019 year over year job gains remained near the top of the recent range.
Monthly job gains declined in July and August. Is this the beginning of a slowdown tied to slowing U.S. and world growth and labor shortages?
Bay Area job growth is far higher than population and labor force growth and the year over year decline in unemployment was small. For the state, August data showed increasing job growth even as the labor force shrank over the past year
If these numbers are real, the implication is a large increase in commuting into the region and/or a large increase with workers holding multiple jobs. Currently data does not exist to confirm or refute this possibility. Future months and possible data revisions will shed more light on where the workers came from to support the large regional job growth. It is an important question to answer.
The state numbers are harder to understand as commuting is not a factor at the state level.
Housing permit levels declined in the first seven months of 2019. The probable causes are increasing construction costs and a shortage of labor. In most cases fees are due when the permit is approved giving another reason to delay taking out the permit even though the project is already approved. On the other hand there seem to be a large number of projects openings and new projects in the pipeline but far yet from seeking permits.
There is some evidence that the surge in resale home prices has peaked though that is a separate market from the rental market and even more separate from funding and approval for BMR units. Median resale prices continue to be slightly below year earlier levels. The Case Shiller price index, which matches comparable homes, has the Bay Area index up 0.7% for the year ending June 2019.
These economic updates are authored by Stephen Levy, Director of the Center for Continuing Study of the California Economy, and a member of the Bay Area Council Economic Institute board.
Another Strong Month, Where Are We Finding the Workers?
The highlights:
• The Bay Area added 4,900 jobs in July (seasonally adjusted), continuing the gains of recent months. State job growth rebounded in May, June and July and CA job growth now slightly outpaces the nation.
• The job growth in July was accounted for by gains in the San Jose metro area with no overall growth in the other metro areas.
• The regional unemployment rate was 3.0% in July the same as a year ago.
• With job growth far outpacing population and labor force growth, where are the workers coming from and can it continue? It did in July.
The Bay Area Continues to Outpace the State and Nation in Job Growth
Year over year job growth of 2.4% far outpaced the 1.6% growth for the nation and 1.8% gain in the state. The state once again is outpacing the nation.
The San Francisco metro area led the region in job growth over the past year followed by the San Jose metro area with slower growth in other metro areas.
Unemployment rates in July 2019 were similar to year earlier rates indicating that the decline in rates may be nearing an end. Unemployment rates in summer months are higher than in other months so the year over year trend is important.
Regional labor force growth in July was up 0.2% from the year earlier and is far below the 2.4% regional job growth.
Year over year job growth has remained in a narrow range since early in 2017. This occurred despite slowing population growth and rising outmigration in the face of high housing costs. In July 2019 year over year job gains remained near the top of the recent range.
The job growth is far higher than population and labor force growth and the year over year decline in unemployment was small.
If these numbers are real, the implication is a large increase in commuting into the region and/or a large increase with workers holding multiple jobs. Currently data does not exist to confirm or refute this possibility. Future months and possible data revisions will shed more light on where the workers came from to support the large regional job growth. It is an important question to answer.
Housing permit levels declined in the first six months of 2019. The probable causes are increasing construction costs and a shortage of labor. In most cases fees are due when the permit is approved giving another reason to delay taking out the permit even though the project is already approved.
There is some evidence that the surge in resale home prices has peaked though that is a separate market from the rental market and even more separate from funding and approval for BMR units. Median resale prices continue to be slightly below year earlier levels.
So the region will continue to struggle to find new workers as increasingly they will come from people moving to the region, which has become difficult given the housing shortage and high housing costs. The struggle to attract and house new workers will happen as 1 million Bay Area residents retire by 2030. Below is a link to the blog on this topic I wrote for SPUR.
The region has reached the point where future labor force growth will need to come mainly from new residents and new housing. Higher levels of labor demand based immigration will be needed and transportation links from adjacent counties including a Central Valley to San Jose link would help.
The next needed steps involve lowering the cost of building new housing, changing zoning to allow more and less expensive housing to be built and, hopefully, state funding to offset some costs of housing. Perhaps the hardest challenge to overcome is the lack of affordable housing for middle income residents who are not eligible for subsidized housing even if it were available in sufficient quantity.
The bottom line, which should be understandable to Bay Area Council members, is that it is really hard if not impossible under current rules to build housing that is affordable to middle income residents yet pencils out for developers.
Readers can follow the ongoing local, regional (CASA) and state (SB 50 and other housing bills) efforts as the need for action becomes clearer each week.
These economic updates are authored by Stephen Levy, Director of the Center for Continuing Study of the California Economy, and a member of the Bay Area Council Economic Institute board.
Another Strong Month, Where Are We Finding the Workers?
The highlights:
• The Bay Area added 12,900 jobs in June (seasonally adjusted), continuing the gains of recent months. State job growth rebounded in May and June and CA job growth now slightly outpaces the nation.
• The job growth in June was led by gains in the San Francisco and San Jose metro areas but other metro areas also showed gains.
• The regional unemployment rate rises in June every year but the unemployment rate in the region fell to 2.8% from 3.0% a year ago.
• With job growth far outpacing population and labor force growth, where are the workers coming from and can it continue?
The Bay Area Continues to Outpace the State and Nation in Job Growth
Year over year job growth of 2.3% far outpaced the 1.6% growth for the nation and 1.7% gain in the state.
The San Francisco metro area led the region in job growth over the past 12 months followed by the San Jose metro area.
Unemployment rates fell to 2.8% in June 2019 compared to 2.8% in June 2018 with year over year declines in all metro areas. Unemployment rates in summer months are higher than in other months so the year over year trend is important
Regional labor force growth stopped June and at 0.0% is far below the 2.3% regional job growth. Note that monthly labor force estimates are volatile.
Year over year job growth has remained in a narrow range since early in 2017. This occurred despite slowing population growth and rising outmigration in the face of high housing costs. In May year over year job gains hit the top of the recent range.
The job growth is far higher than population and labor force growth and the year over year decline in unemployment was small.
If these numbers are real, the implication is a large increase in commuting into the region. Currently data does not exist to confirm or refute this possibility. The increase in in-commuting is very large and future months and possible data revisions will shed more light on where the workers came from to support the large regional job growth. It is an important question to answer.
Housing permit levels declined in the first five months of 2019. Permit levels in 2018 were revised slightly upward.
There is some evidence that the surge in resale home prices has slowed though that is a separate market from the rental market and even more separate from funding and approval for BMR units.
So the region will continue to struggle to find new workers as increasingly they will come from people moving to the region, which has become difficult given the housing shortage and high housing costs. The struggle to attract and house new workers will happen as 1 million Bay Area residents retire by 2030. Below is a link to the blog on this topic I wrote for SPUR.
The region has reached the point where future labor force growth will need to come mainly from new residents and new housing. Higher levels of labor demand based immigration will be needed and transportation links from adjacent counties including a Central Valley to San Jose link would help.
The next needed steps involve lowering the cost of building new housing, changing zoning to allow more and less expensive housing to be built and, hopefully, state funding to offset some costs of housing. Perhaps the hardest challenge to overcome is the lack of affordable housing for middle income residents who are not eligible for subsidized housing even if it were available in sufficient quantity.
The bottom line, which should be understandable to Bay Area Council members, is that it is really hard if not impossible under current rules to build housing that is affordable to middle income residents yet pencils out for developers.
Readers can follow the ongoing local, regional (CASA) and state (SB 50 and other housing bills) efforts as the need for action becomes clearer each week.
These economic updates are authored by Stephen Levy, Director of the Center for Continuing Study of the California Economy, and a member of the Bay Area Council Economic Institute board.
The highlights:
• The Bay Area added 10,000 jobs in May (seasonally adjusted), 100,000 jobs over the past year and accounted for 36% of statewide job growth.
• The job growth in May was led by gains in the San Francisco and San Jose metro areas.
• The regional unemployment rate fell to 2.3% and the number of unemployed workers fell to the lowest level since the recovery began.
• With job growth far outpacing population and labor force growth, where are the workers coming from and can it continue?
The Bay Area Continues to Outpace the State and Nation in Job Growth
Year over year job growth of 2.4% far outpaced the 1.6% growth for the nation and state.
The San Francisco metro area led the region in job growth over the past 12 months followed by the San Jose metro area.
Unemployment rates fell to 2.3% in May 2019 compared to 2.4% in May 2018 with year over year declines in most metro areas. It is hard to see these rates falling much further, which combined with the slowing labor force growth raises the questions of where the workers for future job growth will come from.
Regional labor force growth slowed in May and at 0.5% is far below the 2.4% regional job growth. Note that monthly labor force estimates are volatile.
Year over year job growth has remained in a narrow range since early in 2017. This occurred despite slowing population growth and rising outmigration in the face of high housing costs. In May year over year job gains hit the top of the recent range.
The job growth is far higher than population and labor force growth and the year over year decline in unemployment was small.
If these numbers are real, the implication is a large increase in commuting into the region. Currently data does not exist to confirm or refute this possibility. The increase in in-commuting is very large and future months and possible data revisions will shed more light on where the workers came from to support the large regional job growth. It is an important question to answer.
Housing permit levels declined in the first five months of 2019 after an upward trend in 2018 though most of those gains came in the first six months of the year and in Sonoma County, site of the fire damage.
There is some evidence that the surge in resale home prices has slowed though that is a separate market from the rental market and even more separate from funding and approval for BMR units.
So the region will continue to struggle to find new workers as increasingly they will come from people moving to the region, which has become difficult given the housing shortage and high housing costs. The struggle to attract and house new workers will happen as 1 million Bay Area residents retire by 2030. Below is a link to the blog on this topic I wrote for SPUR.
The region has reached the point where future labor force growth will need to come mainly from new residents and new housing. Higher levels of labor demand based immigration will be needed and transportation links from adjacent counties including a Central Valley to San Jose link would help.
The next needed steps involve lowering the cost of building new housing, changing zoning to allow more and less expensive housing to be built and, hopefully, state funding to offset some costs of housing. Perhaps the hardest challenge to overcome is the lack of affordable housing for middle income residents who are not eligible for subsidized housing even if it were available in sufficient quantity.
The bottom line, which should be understandable to Bay Area Council members, is that it is really hard if not impossible under current rules to build housing that is affordable to middle income residents yet pencils out for developers.
Readers can follow the ongoing local, regional (CASA) and state (SB 50 and other housing bills) efforts as the need for action becomes clearer each week.
These economic updates are authored by Stephen Levy, Director of the Center for Continuing Study of the California Economy, and a member of the Bay Area Council Economic Institute board.
The highlights:
• Bay Area job growth surged again in March led by gains in information and professional services in the San Francisco and San Jose metro areas.
• Strong labor force growth supported the job gains as more residents returned to the workforce and found jobs.
• The unemployment data gave a contradictory signal as unemployment levels and rates (though still very low) increased in March throughout the region. The next months will show whether this is a new trend or a blip.
The Bay Area Continues to Outpace the State and Nation in Job Growth
Year over year job growth rose to 2.4% and the region far outpaced the 1.7% growth for the nation and 1.4% state job growth.
The San Francisco metro area led the region in job growth over the past 12 months followed by the San Jose metro area.
Unemployment rates rose in March 2019 throughout the region contradicting the trends seen in job growth though this may be a one month blip. Still, it is hard to see unemployment rates falling much if any further.
The labor force growth continued though at a slower pace than in February and is good news for people who left the workforce and can now return. It reflects two trends—1) the strong job growth and need to find workers and 2) the decision by employers to look at potential employees they did not previously consider.
Year over year job growth has remained in a narrow range since early in 2017 supported by existing residents rejoining the workforce. This occurred despite slowing population growth and rising outmigration in the face of high housing costs. In March year over year job gains moved toward the top of the range.
Housing permit levels declined slightly in the first two months of 2019 after an upward trend in 2018 though most of the gains came in the first six months of the year and in Sonoma County, site of the fire damage.
While labor force participation rates could rise further, at the same time the aging of baby boomers will move many into the 55+ age groups, which have much lower rates compared to residents aged 25-54.
So the region will continue to struggle to find new workers as increasingly they will come from people moving to the region, which has become difficult given the housing shortage and high housing costs. The struggle to attract and house new workers will happen as 1 million Bay Area residents retire by 2030. Below is a link to the blog on this topic I wrote for SPUR.
The region has reached the point where future labor force growth will need to come mainly from new residents and new housing. Higher levels of labor demand based immigration will be needed and transportation links from adjacent counties including a Central Valley to San Jose link would help.
The next needed steps involve lowering the cost of building new housing, changing zoning to allow more and less expensive housing to be built and, hopefully, state funding to offset some costs of housing. Perhaps the hardest challenge to overcome is the lack of affordable housing for middle income residents who are not eligible for subsidized housing even if it were available in sufficient quantity.
The bottom line, which should be understandable to Bay Area Council members, is that it is really hard if not impossible under current rules to build housing that is affordable to middle income residents yet pencils out for developers.
Readers can follow the ongoing local, regional (CASA) and state (SB 50 and other housing bills) efforts as the need for action becomes clearer each week.
These economic updates are authored by Stephen Levy, Director of the Center for Continuing Study of the California Economy, and a member of the Bay Area Council Economic Institute board.
The highlights:
• Bay Area job growth continued in February led by gains in the San Francisco and San Jose metro areas.
• Strong labor force growth supported the job gains as more residents returned to the workforce and found jobs.
• However, job growth is beginning to slow as it becomes harder to find new workers. Continued growth requires housing, transportation and immigration policies that can attract new workers to the region.
The Bay Area Continues to Outpace the State and Nation in Job Growth
Year over year job growth declined to a still strong to 2.1% and the region outpaced the 1.7% growth for the nation and 1.3% state job growth.
The San Francisco metro area led the region in job growth over the past 12 months followed by the San Jose metro area.
Unemployment rates remained low in February 2019 throughout the region but there are signs that it will be hard to see further declines as the regional unemployment rate is already at a low 2.9%.
The labor force growth continued though at a slower pace than in January and is good news for people who left the workforce and can now return. It reflects two trends—1) the strong job growth and need to find workers and 2) the decision by employers to look at potential employees they did not previously consider.
Year over year job growth has remained in a narrow range since early in 2017 supported by existing residents rejoining the workforce. This occurred despite slowing population growth and rising outmigration in the face of high housing costs.
Housing permit levels continued an upward trend in 2018 though most of the gains came in the first six months of the year and in Sonoma County, site of the fire damage. Permit levels were up 14% in 2018 and were up strongly in January 2019.
While labor force participation rates could rise further, at the same time the aging of baby boomers will move many into the 55+ age groups, which have much lower rates compared to residents aged 25-54.
So the region will continue to struggle to find new workers as increasingly they will come from people moving to the region, which has become difficult given the housing shortage and high housing costs. The struggle to attract and house new workers will happen as 1 million Bay Area residents retire by 2030. Below is a link to the blog on this topic I wrote for SPUR.
The region has reached the point where future labor force growth will need to come mainly from new residents and new housing. Higher levels of labor demand based immigration will be needed and transportation links from adjacent counties including a Central Valley to San Jose link would help.
The next needed steps involve lowering the cost of building new housing, changing zoning to allow more and less expensive housing to be built and, hopefully, state funding to offset some costs of housing. Perhaps the hardest challenge to overcome is the lack of affordable housing for middle income residents who are not eligible for subsidized housing even if it were available in sufficient quantity.
The bottom line, which should be understandable to Bay Area Council members, is that it is really hard if not impossible under current rules to build housing that is affordable to middle income residents yet pencils out for developers.
Readers can follow the ongoing local, regional (CASA) and state (SB 50 and other housing bills) efforts as the need for action becomes clearer each week.
These economic updates are authored by Stephen Levy, Director of the Center for Continuing Study of the California Economy, and a member of the Bay Area Council Economic Institute board.
The highlights:
• Bay Area job growth surged in January led by tech and supported by strong labor force growth.
• The surge in labor force growth was the result of higher participation rates from existing residents while population growth slowed.
• Revisions to 2018 data showed 13,100 fewer jobs in December 2018 than previously estimated with declines in the San Jose and Oakland metro areas partially offset by an upward revision in the SF metro area.
The Bay Area Continues to Outpace the State and Nation in Job Growth
Year over year job growth rose to 2.4% and the region outpaced the 1.9% growth for the nation. The 1.4% growth for California will likely be revised upward.
The San Francisco metro area led the region in job growth over the past 12 months followed by the San Jose metro area.
Unemployment rates remained low in January 2019 throughout the region but ticked up on a year over year basis for the first time in many years. The labor force grew by 115,000 even more than the 93,900 year over year job gain.
The labor force growth is good news for people who left the workforce and can now return. It reflects two trends—1) the strong job growth and need to find workers and 2) the decision by employers to look at potential employees they did not previously consider.
Year over year job growth has remained in a narrow range since early in 2017 supported by existing residents rejoining the workforce. This occurred despite slowing population growth and rising outmigration in the face of high housing costs.
The job estimate for the San Jose metro area was revised downward by 15,100 for December 2018 though the area still posted strong job growth for the year. The SF metro estimate was revised up by 12,100 jobs while that for the Oakland metro was revised down by 9,800 jobs.
Housing permit levels continued an upward trend in 2018 though most of the gains came in the first six months of the year and in Sonoma County, site of the fire damage. Permit levels were up 14% in 2018 and were up strongly in January 2019.
While labor force participation rates could rise further, at the same time the aging of baby boomers will move many into the 55+ age groups, which have much lower rates compared to residents aged 25-54.
So the region will continue to struggle to find new workers as increasingly they will come from people moving to the region, which has become difficult given the housing shortage and high housing costs. The struggle to attract and house new workers will happen as 1 million Bay Area residents retire by 2030.
The region has reached the point where future labor force growth will need to come mainly from new residents and new housing. Higher levels of labor demand based immigration will be needed and transportation links from adjacent counties including a Central Valley to San Jose link would help.
The next needed steps involve lowering the cost of building new housing, changing zoning to allow more and less expensive housing to be built and, hopefully, state funding to offset some costs of housing. Perhaps the hardest challenge to overcome is the lack of affordable housing for middle income residents who are not eligible for subsidized housing even if it were available in sufficient quantity.
The bottom line, which should be understandable to Bay Area Council members, is that it is really hard if not impossible under current rules to build housing that is affordable to middle income residents yet pencils out for developers.
Readers can follow the ongoing local, regional (CASA) and state (SB 50 and other housing bills) efforts as the need for action becomes clearer each week.
These economic updates are authored by Stephen Levy, Director of the Center for Continuing Study of the California Economy, and a member of the Bay Area Council Economic Institute board.
Is a looming recession about to hit? That question was on the top of everyone’s mind on February 8th as the Bay Area Council Economic Institute convened top public and private sector leaders to give their economic forecasts for the region, California and the nation. In a conversation moderated by Stanford Institute for Economic Policy Research Director Mark Duggan, Federal Reserve Bank of San Francisco President Dr. Mary Daly offered an exclusive perspective from the Fed, assessing that an economic slowdown is a good thing and could help prevent a recession. She remarked that in 2018, the economy grew at close to a 3 percent annual rate, which Daly said is well above a sustainable level by a full a percentage point.
“We want it to come back down,” Daly emphasized. “Two percent is the consensus of what the economy can sustain, so coming back down can help prevent a recession or make it less likely.”
President Daly also addressed the impact of the government shutdown on the economy as two-fold: what has and what might happen. The economic impact to the economy in Q1 should be modest and will recoup by Q2; however, the impact of another shutdown could be much worse. “When the government shuts down, this is not a confidence-boosting event,” she quipped. “When uncertainty goes up, businesses stop taking entrepreneurial risks. They do just what they need to do to keep their business going. That can have negative impact on the economy.”
Zooming in on a more micro level analysis of the regional economy, Jonathan Levin, Dean of Stanford Graduate School of Business, and Kausik Rajgopal, Western Regional Manager of McKinsey & Company, addressed wealth disparity, education, innovation and housing among other key factors impacting the Bay Area’s economic health. The emergence of artificial intelligence and how we prepare our future workforce for an environment where computers are taking on more and more was also a hot topic. Levin reflected that non-routine and skills social in nature cannot be automated and that there will always be a need for critical thinking and leadership skills among others.
The Bay Area economy is deeply interconnected to the global economy, serving as the epicenter for technology, entrepreneurship and all things digital. Canada Consul General Rana Sarkar, German Consul Hans-Ulrich Sudbeck, Japan Consul General Tomochika Uyama shared their perspectives on why they are in the region, highlighting how their presence builds connections, supports innovation at home, supports trade and investment, and contributes to shared approaches to emerging issues.
Bay Area job growth surged in December supported by strong labor force growth and continuing low unemployment rates. The surge in labor force growth was the result of higher participation rates from existing residents. Population growth in the region is falling as birth rates fall and out migration increases. But very low unemployment rates and record levels of labor force participation rates raise questions as to where the workers will be found to fill planned future job growth.
The Bay Area Again Outpaces the Nation in Job Growth
Year over year job growth rose to 2.4% and the region outpaced the 1.8% growth for the nation and 1.7% for California.
The San Jose and Santa Rosa metro areas led the region in job growth over the past 12 months.
Unemployment rates remained low in December 2018 throughout the region with a 2.6% regional rate the same as in October and November. Labor force growth surged by more than nearly 110,000 (+2.7%) for the past 12 months driven by record levels of participation by all age groups over 25.
Year over year job growth rose in December to 96,300 and has remained in a narrow range since early in 2017. This occurred despite slowing population growth and rising outmigration in the face of high housing costs.
Surging Job Growth Amidst Slowing Population Growth—How did it Happen, How Long Can it Last
Bay Area population growth has slowed as a result of lower levels of natural increase and rising levels of domestic out migration. Total growth fell from above 100,000 in 2013 to 37,000 in 2018. Domestic migration moved from plus 29,000 to minus 42,000 in 2018 as a growing number of residents moved out as a result of rising housing costs. Foreign migration increased in 2018 and was higher than the region’s total population growth. A separate memo has been prepared on population trends in the Bay Area.
Recent job growth was made possible primarily from reentry into the workforce of existing residents as the tight labor market encouraged employers to consider applicants they previously looked past. Bay Area labor force participation rates are at record levels as residents who dropped out of the workforce now find eager employers.
Housing permit levels continued an upward trend in 2018 though most of the gains came in the first six months of the year and in Sonoma County, site of the fire damage. Permit levels are up 12% in the first 11 months of 2018
The slowdown in new permits has been accompanied by a number of projects coming on line and a softening of resale home prices. Median prices are actually down year over year as high prices, new units and out migration have cooled the market at least temporarily.
While labor force participation rates could rise further, at the same time the aging of baby boomers will move many into the 55+ age groups, which have much lower rates compared to residents aged 25-54.
So the region will continue to struggle to find new workers as increasingly they will come from people moving to the region, which has become difficult given the housing shortage and high housing costs. The struggle to attract and house new workers will happen as 1 million Bay Area residents retire by 2030.
The region has reached the point where future labor force growth will need to come mainly from new residents and new housing
The next needed steps involve lowering the cost of building new housing, changing zoning to allow more and less expensive housing to be built and, hopefully, state funding to offset some costs of housing. Perhaps the hardest challenge to overcome is the lack of affordable housing for middle income residents who are not eligible for subsidized housing even if it were available in sufficient quantity.
The bottom line, which should be understandable to Bay Area Council members, is that it is really hard if not impossible under current rules to build housing that is affordable to middle income residents yet pencils out for developers.
These economic updates are authored by Stephen Levy, Director of the Center for Continuing Study of the California Economy, and a member of the Bay Area Council Economic Institute board.
The California Department of Finance released new county population estimates in December 2018 and they show a steady slowdown in the level of regional population growth. The main determinants of the slowdown are declines in the level of births and increasing migration of residents out of the Bay Area.
The region added just 38,000 residents in 2018 down form levels of 80,000 to 100,000 just three years earlier.
Although foreign immigration levels remained strong, domestic migration turned increasingly negative after being positive earlier in the decade as high housing prices forced some residents to leave the region.
In addition the number of births has trended down each year as the number of annual deaths is increasing so the contribution of natural increase to population growth is diminishing. In fact in 2018 foreign immigration accounted for more than the total population growth in the region.
Population growth since 2010 has outpaced the state and national growth rates but that is largely the result of growth before 2016
The chart below shows the steadily declining annual population growth in the region’s largest counties. Data is in thousands.
The decline is mostly the result of increasing out migration with the largest outflow from Santa Clara and Alameda counties. Though the trend is clear and understandable it is important to remember that even in 2018 outflows were just far less than 1% of the region’s total populations.
There are anecdotal reports of residents moving to adjacent counties. This may be true but inflows into adjacent counties are far less than the level of out migration from the region implying that many are leaving the region’s job market.
Migration to the Sacramento region and nearby counties in the Central Valley has increased but was only 10,000 in the highest year.
Implications
The region has reached the point where future labor force growth will need to come mainly from new residents and new housing. Slower population growth fueled by migration outflows combined with the coming surge in retirements underscore the importance of expanding housing and housing affordability to support planned job growth and maintain economic competitiveness.
The next needed steps involve lowering the cost of building new housing, changing zoning to allow more and less expensive housing to be built and, hopefully, state funding to offset some costs of housing. Perhaps the hardest challenge to overcome is the lack of affordable housing for middle income residents who are not eligible for subsidized housing even if it were available in sufficient quantity.
The bottom line, which should be understandable to Bay Area Council members, is that it is really hard if not impossible under current rules to build housing that is affordable to middle income residents yet pencils out for developers.
These economic updates are authored by Stephen Levy, Director of the Center for Continuing Study of the California Economy, and a member of the Bay Area Council Economic Institute board.
Bay Area job growth surged in November supported by strong labor force growth and continuing low unemployment rates. The surge in labor force growth was the result of higher participation rates from existing residents. Population growth in the region is falling as birth rates fall and out migration increases. But very low unemployment rates and record levels of labor force participation rates raise questions as to where the workers will be found to fill planned future job growth.
The Bay Area Again Outpaces the Nation in Job Growth
Though year over year job growth fell to 2.2% from 2.4% the month earlier, the region outpaced the 1.7% growth for the nation and 1.8 for California.
The San Jose and Santa Rosa metro areas led the region in job growth over the past 12 months.
Unemployment rates remained low in November 2018 throughout the region with a 2.6% regional rate the same as in October. Labor force growth surged to nearly 1000,000 for the past 12 months driven by record levels of participation by all age groups over 25.
Year over year job growth rose in November to 92,200 and has remained in a narrow range since early in 2017. Slowing labor force growth from boomer retirements will probably push job growth levels lower over the coming years.
Surging Job Growth Amidst Slowing Population Growth—How did it Happen, How Long Can it Last
Bay Area population growth has slowed as a result of lower levels of natural increase and rising levels of domestic out migration. Total growth fell from above 100,000 in 2013 to 37,000 in 2018. Domestic migration moved from plus 29,000 to minus 42,000 in 2018 as a growing number of residents moved out as a result of rising housing costs. Foreign migration increased in 2018 and was higher than the region’s total population growth. A separate memo is being prepared on population trends in the Bay Area.
Recent job growth was made possible primarily from reentry into the workforce of existing residents as the tight labor market encouraged employers to consider applicants they previously looked past. Bay Area labor force participation rates are at record levels as residents who dropped out of the workforce now find eager employers.
While participation rates could rise further, at the same time the aging of baby boomers will move many into the 55+ age groups, which have much lower rates compared to residents aged 25-54.
So the region will continue to struggle to find new workers as increasingly they will come from people moving to the region, which has become difficult given the housing shortage and high housing costs.
Housing permit levels continued an upward trend in 2018 though most of the gains came in the first six months of the year. Permit levels are up 11% in the first ten months of 2018 led by strong gains in Contra Costa, Napa and Sonoma counties. And project approvals and plans are also rising throughout much of the region from Oakland, Emeryville, eastern Contra Costa County and San Francisco to Redwood City, Mountain View, Cupertino and San Jose. And projects started in prior years are now reaching completion.
The next needed steps involve lowering the cost of building new housing, changing zoning to allow more and less expensive housing to be built and, hopefully, state funding to offset some costs of housing. Perhaps the hardest challenge to overcome is the lack of affordable housing for middle income residents who are not eligible for subsidized housing even if it were available in sufficient quantity.
The bottom line, which should be understandable to Bay Area Council members, is that it is really hard if not impossible under current rules to build housing that is affordable to middle income residents yet pencils out for developers.
These economic updates are authored by Stephen Levy, Director of the Center for Continuing Study of the California Economy, and a member of the Bay Area Council Economic Institute board.
Bay Area year over year job growth slowed in October though the region continued to add jobs at a faster pace than the state and nation. Unemployment levels and rates remain low but did not decline further in October. The surge in labor force growth continued coming mostly from higher participation of existing residents. But very low unemployment rates and record levels of labor force participation rates raise questions as to where the workers will be found to fill the planned future job growth.
The Bay Area Again Outpaces the Nation in Job Growth
Though year over year job growth fell to 2.2% from 2.4% the month earlier, the region outpaced the 1.7% growth for the nation and 1.8 for California.
The San Jose and Santa Rosa metro areas led the region in job growth over the past 12 months.
Unemployment rates remained low in October 2018 compared to a year throughout the region with a 2.6% regional rate the same as in September. Labor force growth surged to nearly 80,000 for the past 12 months driven by record levels of participation by all age groups over 25.
Year over year job growth dipped in October to 85,000. Slowing labor force growth from boomer retirements will probably push job growth levels lower over the coming years.
Housing permit levels continued an upward trend in 2018 though most of the gains came in the first six months of the year. Permit levels are up 14% in the first nine months of 2018 led by strong gains in Contra Costa, Napa and Sonoma counties. And project approvals are also rising throughout much of the region
Recent job growth has been supported by declining unemployment and an increase in labor force participation—two factors that do not increase housing demand. But the region has reached the point where future labor force growth will need to come mainly from new residents and new housing
The next needed steps involve lowering the cost of building new housing, changing zoning to allow more and less expensive housing to be built and, hopefully, state funding to offset some costs of housing.
Perhaps the hardest challenge to overcome is the lack of affordable housing for middle income residents who are not eligible for subsidized housing even if it were available in sufficient quantity.
The bottom line, which should be understandable to Bay Area Council members, is that it is really hard if not impossible under current rules to build housing that is affordable to middle income residents yet pencils out for developers.
These economic updates are authored by Stephen Levy, Director of the Center for Continuing Study of the California Economy, and a member of the Bay Area Council Economic Institute board.
The Bureau of Economic Analysis released metro area GDP estimates for 2017 on September 18, 2018. These estimates show very strong Bay Area growth in 2017, far outpacing the state and nation.
Led by the San Jose metro area, the region posted a GDP of $838 billion for a gain of 4.8% adjusted for inflation and 6.3% in current dollars. The inflation adjusted regional GDP gain compared to 3.0% in the state and 2.1% for the nation. All metro areas in the region outpaced the nation led by San Jose’s 7.6% real GDP growth.
The rapid Bay Area growth in 2017 pushed the region up to be the world’s 18th largest economy just behind Turkey and ahead of the Netherlands.
Source: Bea, IMF DataMapper World Economic Outlook (April 2018) Analysis: Bay Area Council Economic Institute
If California were on the chart, it would rank above the UK with $2,747 trillion as the world’s 5th largest economy as widely reported with India likely to pass California in the near future.
The Bay Area gains were driven by gains in the technology sector with the San Jose and San Francisco-Oakland metro areas leading the region in GDP growth.
These economic updates are authored by Stephen Levy, Director of the Center for Continuing Study of the California Economy, and a member of the Bay Area Council Economic Institute board.
Bay Area job growth accelerated in July and August and unemployment levels and rates fell sharply compared to a year earlier. More good news came in rising residential building permits and strong GDP growth, which is displayed in a separate memo. But very low unemployment rates and slowing population and labor force growth raise questions as to where the workers will be found to fill the planned expansions in the region.
The Bay Area Again Outpaces the Nation in Job Growth
Strong job growth in July and August pushed year over year Bay Area job growth to +2.2% compared to 1.6% for the nation and 2.1% for California.
The San Jose metro area led the region in job growth over the past 12 months with a 3.1% increase.
Unemployment rates are sharply lower in August 2018 compared to a year throughout the region. The number of unemployed residents fell by 34,300 between August 2017 and 2018 and the regional unemployment rate of 2.8% is the lowest since the height of the dot.com boom. Labor force growth remained very low (+0.1%) during the past year..
Year over year job growth has been remarkably stable at near 80,000 over the past year and a half. Slowing labor force growth from boomer retirements will probably push job growth levels lower over the coming years.
Housing permit levels continued the surge that began in 2017 with permit levels rising 32% in the first five months of 2018 led by strong gains in Alameda, Contra Costa, Napa and Sonoma counties. And project approvals are also rising throughout much of the region
And last week brought more good news on housing. Cupertino and Sand Hill (the developer) will now choose between proposals that will bring 2,500 or near 3,000 new housing units on the Vallco site. And each day last week brought a new housing proposal for downtown San Jose. These proposals also bring units reserved for low-income families. This good news is important as companies continue to plan major expansions in the region. These expansion plans come at a time when the region is struggling to deal with the challenges of housing shortages and lack of affordability and increasing traffic delay.
For the company expansion plans to become real will require housing for more workers on top of building for the existing shortages and increased mobility options to get workers to their jobs. While permit levels are now keeping pace with current population growth, this housing upturn does not come close to addressing the large shortage built up much less fully keep pace with current growth. And not all permits eventually get built.
The next needed steps involve lowering the cost of building new housing, changing zoning to allow more and less expensive housing to be built and, hopefully, state funding to offset some costs of housing.
Perhaps the hardest challenge to overcome is the lack of affordable housing for middle income residents who are not eligible for subsidized housing even if it were available in sufficient quantity.
The bottom line, which should be understandable to Bay Area Council members, is that it is really hard if not impossible under current rules to build housing that is affordable to middle income residents yet pencils out for developers.
These economic updates are authored by Stephen Levy, Director of the Center for Continuing Study of the California Economy, and a member of the Bay Area Council Economic Institute board.
Bay Area job growth slowed in June and the regional labor force increased by just 5,000 over the past 12 months, far short of what is needed to support future job growth. In June 2018, year over year job growth slowed to the lowest level in several years with +73,400 (1.9%). Low unemployment rates and slowing population and labor force growth raise questions as to where the workers will be found to fill the planned expansions in the region.
The Bay Area Again Outpaces the Nation in Job Growth
The Bay Area posted a 1.9% job growth rate during the past 12 months just above the state and national 1.6% gain.
The San Jose metro area was the only part of the region to post seasonally adjusted job gains in June and led the region over the past 12 months with a 3.1% increase. California job levels were almost flat in May and June. Job growth has slowed in recent months and then rebounded, so it is not clear that June represents a permanent slowing though the weak labor force growth is also a warning sign about housing supply and affordability.
Unemployment rates rise in the summer months. Unemployment levels were still lower in June 2018 compared to a year earlier, but the pace of decline is shrinking as rates are already very low. The number of unemployed residents fell by 18,700 between June 2017 and 2018—a much smaller decline than in previous months. Labor force growth slowed to a trickle (0.1%) during the past year.
Housing permit levels continued the surge that began in 2017 with permit levels rising 32% in the first five months of 2018 led by strong gains in Alameda, Contra Costa, Napa and Sonoma counties. And project approvals are also rising throughout much of the region.
Yet companies are planning major expansions in the region. These expansion plans come at a time when the region is struggling to deal with the challenges of housing shortages and lack of affordability and increasing traffic delay.
For the company expansion plans to become real (at least for most or all of them) will require housing for more workers on top of building for the existing shortages and increased mobility options to get workers to their jobs.
While permit levels are now keeping pace with current population growth, this housing upturn does not come close to addressing the large shortage built up, much less fully keeping pace with current growth. And not all permits eventually get built.
The next needed steps involve lowering the cost of building new housing, changing zoning to allow more and less expensive housing to be built and, hopefully, state funding to offset some costs of housing so that cities get the funds but some of the fees and infrastructure costs do not have to be added to the cost and price/rental rate of the new housing. The Committee to House the Bay Area (CASA) is working on these issues and the Bay Area Council has participants in this important effort.
But the overall housing shortage is not evenly distributed among price and rent categories. Very low income households are those making between 0% and 50% of area median income (AMI). Low income ranges from 50% to 80% of AMI and moderate (middle income) ranges from 80% to 120% of AMI. With funding and approval challenges, it is not surprising that the low and very low income targets are not being met. But the shortage for middle income households is virtually the same as that for low and very low income households.
Perhaps the hardest challenge to overcome is the lack of affordable housing for middle income residents who are not eligible for subsidized housing even if it were available in sufficient quantity.
CASA is taking a close look at the missing middle including ideas like adding a new RHNA category for 120%–150% or 180% of area median income and a variety of ways to reduce the cost including modular construction, reducing parking requirements and fees and making it easier to build ADUs.
The bottom line, which should be understandable to Bay Area Council members, is that it is really hard if not impossible under current rules to build housing that is affordable to middle income residents yet pencils out for developers. Here is the link to the CASA agendas and packets. The July 18th packet contains several housing production policy ideas.
These economic updates are authored by Stephen Levy, Director of the Center for Continuing Study of the California Economy, and a member of the Bay Area Council Economic Institute board.