San Francisco tops U.S. counties in economic value created per unit of water consumed.
San-Jose-Sunnyvale-Santa Clara tops U.S. Metropolitan Statistical Areas in economic value created per unit of water consumed; San Francisco-Oakland-Hayward has third highest, followed by the Los-Angeles-Long Beach-Riverside area.
California’s large metropolitan regions, especially the San Francisco-Oakland-Silicon Valley Bay Area, generate more economic value per unit of freshwater consumed than other regions in the United States. The findings result from analysis done by the Bay Area Council that compared annual water consumption data among the top 15 counties and Metropolitan Statistical Areas by gross domestic product (GDP) in the United States.
San Francisco tops U.S. counties in economic value created per unit of water consumed
The City and County of San Francisco produces $1.3 million in economic value for every acre-foot of water consumed, more than any other county in the top 15 metropolitan statistical areas, and 31 percent more value than is created by the next highest value county, Middlesex, Massachusetts. One acre-foot equals 325,851 gallons, approximately the amount of water used by 11 Californians per year. San Francisco’s water efficiency can be credited to its cluster of high value professional services and technology sectors, combined with high-density land use policies which limit outdoor irrigation (which accounts for approximately half of all domestic water use in California). During water year 2016, San Francisco residents consumed 41 gallons-per-day compared to the California statewide average 82 gallons.
The San-Jose-Sunnyvale-Santa Clara Metropolitan Statistical Area tops U.S. regions in economic value created per unit of water consumed.
The San-Jose-Sunnyvale-Santa Clara Metropolitan Statistical Area produces $504,000 in economic value for every acre-foot of water it consumes. The metro area, which includes Silicon Valley, has one of the most productive economies in the United States, and consumes about 467,000 acre-feet of water per year, less than a quarter of the average across all metropolitan statistical areas (2,217,352 acre-feet).
Methodology
We examined the top 15 Metropolitan Regions, as defined by the United States Office of Management and Budget, and ranked by gross domestic product by the United States Department of Commerce Bureau of Economic Analysis. Individual county GDP figures were sourced from Moody’s Analytics.1 County water consumption was obtained from the United
States Geological Survey (USGS) data on total public supply withdrawals and self-supplied and industrial withdrawals.2 The water data represents urban water use only (all households, commercial, and industrial), and does not include water for agriculture, livestock, or grazing. Economic value per acre-foot was determined by dividing county GDP by county water use.
Notes
1. Moody’s Analytics, Economic Data: Forecast and Historical https://www.economy.com/products/data
2. United States Geological Survey. Estimated Use of Water in the United States County-Level Data for 2010. https://water.usgs.gov/watuse/data/2010/
Most everyone has now read the stories about recent Bay Area job losses. It is true that job growth has slowed substantially over the past two years falling on a year over year basis by nearly two-thirds.
The Bay Area is no Longer California’s Fastest Growing Region
The Bay Area posted a 1.4% job growth rate during the past 12 months and lagged the state job growth rate for the second month in a row. The U.S. growth rate was affected last month by hurricane-related job losses.
Job growth is slowing throughout the region. Year over year job growth reached a low of 55,100 in September July well below the 100,000-150,000 levels of recent years.
At the same time, the September data showed positive trends for labor force growth and unemployment. Unemployment rates are still falling even though rates are already low. The regional unemployment rate of 3.3% in September is the lowest since the dot.com boom. The number of unemployed residents fell from 159,500 a year ago to 145,000 last month.
Labor force growth picked up last month and the region has added 45,000 workers (+1.1%) over the past 12 months. There are many reasons why job growth may have slowed so much. One is difficulty for workers to find housing. But there have also been a slew of layoffs resulting from consolidations. And retirements are surging as boomers are growing older.
But there are many indications that companies and communities are responding to growth challenges and planning for the future.
There is more positive news with regard to expanding our housing supply. Housing permits are up substantially for the first eight months of the year but more are needed. Mountain View is moving ahead with housing at North Bayshore. San Jose has bold housing proposals that coincide with the substantial Google expansions being planned. NASA is adding housing at Moffett Field. More housing is being proposed around the new BART stations and San Francisco and Oakland are moving ahead to permit more housing.
The next needed steps involve lowering the cost of building new housing, changing zoning to allow more and less expensive housing to be built and, hopefully, state funding to offset some costs of housing so that cities get the funds but some of the fees and infrastructure costs do not have to be added to the cost and price/rental rate of the new housing.
Economic Institute President Micah Weinberg, Ph.D. and Hoover Institution research fellow Lanhee J. Chen, Ph.D. co-authored an op-ed appearing on the New York Times September 19th, 2017. The piece titled “The Sanders Single-Payer Plan Is No Miracle Cure” underlines the marginal number of successful universal healthcare systems globally exposing their issues to control costs and to provide better care than systems that include private-sector insurers. The piece also examines the potential inefficiencies of Senator Sanders’ proposed single-payer healthcare bill compared to similar systems in developed nations.
In a bipartisan effort to further expose the potential inefficiencies of addressing the current complexity and concerns of healthcare in the United States with Senator Sanders’ proposal, Dr. Weinberg and Dr. Chen appeared on a segment on Fox News on September 20th, 2017. Dr. Weinberg and Dr. Chen propose a German-style insurance system as a simple, single private insurance market solution for users where insurers are regulated to produce impactful health services.
Dr. Weinberg emphasized that while the single payer bill is not the answer for the issues the nation has in regards to healthcare, the proposed Graham-Cassidy healthcare bill will generate a series of difficulties for businesses employing Americans across different states.
The Bay Area led California and the nation with a real (inflation-adjusted) GDP gain of 5.2% in 2016, more than 3 times faster than the national growth rate. The Sacramento region rebounded from years of slower growth to post a 3.1% real (beyond inflation) growth rate.
San Jose led all metro areas in California with a real GDP increase of 5.9% in 2016 led by gains in tech related sectors. The San Francisco-Oakland metro area was 2nd at 5.4% with gains in tech and finance.
2016 saw areas outside of the Bay Area with strong gains as these areas are now fully participating in the state’s growth. Fresno GDP grew by 3.4% led by gains in agriculture, construction, health care and government. The Bakersfield metro lagged as the oil cutbacks restrained growth.
The Sacramento metro area was led by gains in finance and professional services. The Ventura and San Diego metro areas lagged as a result of major declines in manufacturing GDP.
The Riverside-San Bernardino metro area was led by gains in construction, finance and health care that offset losses in manufacturing. The LA-Orange metro area was led by gains in information, which includes motion pictures and Internet Services.
The LA Basin and Bay Area rank high in comparison to most states.
The five county LA Basin economy ranks behind only California, Texas and New York in 2016 with a $1.2 trillion dollar economy. The nine county Bay Area economy would rank 5th among all states (up from 6th last year) with a $781 billion dollar economy measured by the value of goods and services produced in each area.
Where do California Regions Rank Worldwide?
The LA Basin economy would rank 15th (up from 16th last year) in terms of the output of goods and services behind Australia and ahead of Mexico. The Bay Area would rank 18th behind Turkey and ahead of the Netherlands. San Diego County would rank 44th behind Bangladesh and ahead of Portugal. The eight county San Joaquin Valley would rank 52nd behind Iraq and ahead of Algeria. And the six county Sacramento region would rank 55th behind Kazakhstan and ahead of Hungary. California and the regions were not counted as countries in these rankings. See the below on page 4.
2017 Update and Commentary
Job growth has slowed in the Bay Area and statewide so far in 2017. But job growth continues to spread to areas previously left behind including the Inland Empire, Butte, and many San Joaquin Valley counties.
So it is very likely that GDP growth in the state and many regions in 2017 will be below the 2015 and 2106 levels.
The recently released ACS data remind us of two important points: 1) that though poverty is falling, it remains far above the levels we hope for and 2) that in most areas of the state it is high housing costs that push a large number of residents below the poverty level and that housing remains both an economic, equity and environmental challenge that we need to meet.
Methodology
The estimates presented above are based on 2016 advance metropolitan area estimates published by BEA in September 2017.
GDP is referred to as output or the output of goods and services in the text. GDP is used instead of GSP (gross state product) although the meanings are similar).
The LA Basin includes Los Angeles, Orange, Riverside, San Bernardino and Ventura counties. The Bay Area includes Alameda, Contra Costa, Marin, Napa, San Francisco, San Mateo, Solano and Sonoma counties. The San Diego region includes San Diego County. The San Joaquin Valley region includes Fresno, Kern, Kings, Madera, Merced, San Joaquin, Stanislaus and Tulare counties, The Sacramento region includes El Dorado, Placer, Sacramento, Sutter, Yolo and Yuba counties.
These economic updates are authored by Stephen Levy, Director of the Center for Continuing Study of the California Economy, and a member of the Bay Area Council Economic Institute board.
The California Employment Development Department (EDD) has released job and labor force estimates for June 2017. Here are the highlights:
Job growth in the Bay Area rebounded in June.
The region’s labor force fell over the past year with all job gains coming from a decline in the number of unemployed workers, already near record low levels.
Major companies continue to announce expansion plans, some accompanied by housing developments.
A Job Rebound Accompanied by a Shrinking Labor Force
Job growth has slowed over the past year, though June brought a strong rebound and the region again outpaces the state and nation.
Job growth is slowing throughout the region. For the past 12 months only the Oakland, San Francisco, Santa Rosa and Napa metro areas have added jobs at a faster pace than the nation. Year over year job growth reached a low of 65,000 in May before rebounding to 79,900 in June still well below the 100,000+ levels of recent years.
At the same time unemployment rates have declined sharply throughout the region to the lowest levels since the dot.com boom. The June rates are higher than normal as a result of school closings for the summer but the year over year trends show the continuing decline.
While unemployment and unemployment rates have declined, labor force growth has shrunk with 9,700 fewer workers than a year ago. This has created a very tight labor market where finding workers has become more difficult. Job growth cannot continue without positive labor force growth, which is tied to the region’s efforts to provide more housing at a range of affordability.
Job growth levels have declined sharply since last June from near 130,000 on a year over year basis to roughly half that level before rebounding a bit in June.
But this week alone has brought positive signs for the region’s future.
Facebook announced expansion plans in Menlo Park including plans for housing and community amenities. Adobe announced plans for expansion in San Jose. San Francisco adopted a number of pro housing initiatives and approvals. South Bay communities are pursuing mixed use projects around BART stations. The state legislature will look at several housing proposals in August.
Housing permits are up for the first part of the year but more are needed.
These economic updates are authored by Stephen Levy, Director of the Center for Continuing Study of the California Economy, and a member of the Bay Area Council Economic Institute board.
Last Tuesday, Economic Institute Vice President Jeff Bellisario joined by Oakland Athletics’ President Dave Kaval discussed the findings of a new Institute report on the economic impact of building a new Stadium in Oakland. The study found that over the first 10 years of operation a new baseball stadium for the Oakland Athletics would generate $3.05 billion in economic impact for the residents and businesses of the city. Building the stadium would also create 2,000 construction jobs, many of which would go to local workers and businesses under hiring agreements expected to accompany the project. The analysis breaks down the economic impact of the new stadium as follows:
$768 million from construction and related spending
$1.54 billion from game-day spending
$742 million from ballpark operations
While the location of the new stadium has not been specified, the study estimates a new stadium could increase attendance from 1.5 million (2016) to 2.55 million in its first year of operation.
This Monday, Economic Institute President Micah Weinberg discussed the importance of preserving open space in the Bay Area while addressing the housing challenges the region faces at Greenbelt Alliance’s board of director’s meeting. The conversation suggests that the Bay Area can make progress to accommodate its growing population in a way that is environmentally sustainable while preserving open spaces that are economic assets to the region.
The conversation precedes the release of the Institute’s forthcoming report Bay Area Balance: Preserving Open Space, Addressing Housing Affordability that makes the economic case for preserving open spaces and identifies opportunities for responsible development in the region. The report complements East Bay Regional Parks District’s Quantifying Our Quality of Life report, an economic analysis of open spaces in the East Bay.
Listen to the conversation below.
The California Employment Development Department (EDD) has released job and labor force estimates for May 2017. Here are the highlights:
Job growth in the Bay Area and state has slowed since January…
Unemployment and unemployment rates have reached the lowest levels since the dot.com boom and labor force growth has disappeared at least temporarily.
Job openings nationally are at record levels at the same time unemployment is low and labor force growth is slowing.
Before summarizing the recent data, this brief looks at the strength and vigor of the regional economy over the period since 2012.
The state accounted for 17.1% of U.S. job growth and 23.6% of national GDP growth between 2012 and 2016 while representing between 11% and 12% of national jobs and population. The Bay Area with 2.5% of U.S. jobs in 2012 accounted for 4.8% of national job growth and the rest of the state also outpaced the nation in job growth. The Bay Area also accounted for an above-average share of GDP growth.
A High and Rising Share of Fast Growth Sectors
The state has a high share of fast growing basic (export oriented) sectors, many concentrated in the Bay Area and California increased its share of national jobs in many key sectors between 2007 and 2016.
These gains pushed the state’s share of total U.S. jobs to 11.8% in 2016, a record, from 11.4% in 2012.
The state and Bay Area economic strength in the face of strict air quality regulations, high and rising housing costs and state and local tax increases, lend perspective to two national policy issues.
The Bay Area this month achieved compliance with two more federal air quality standards and the Air Resources Board announced that both total and per capita GHG emissions are declining. At the same time the region is attracting company after company taking advantage of our labor force to innovate in a variety of clean tech endeavors.
These trends show that helping the environment is consistent with, and will be helped by in the long run, policies to promote energy efficiency and air quality.
The second point is that the Bay Area and state economies are critical to U.S. economic growth. That is what the 17.1% of job growth and 23.6% of GDP growth tell us. That means that policies that could hurt our economy like restrictive trade and immigration policies, will also retard national economic growth. Our economies are connected.
Looking at the Bay Area Slowdown
Job growth has slowed. The Bay Area still outpaces the nation in job growth in May 2017 but barely and state growth lags the nation for the first time in several years.
Job growth is slowing throughout the region. For the past 12 months only the Oakland, San Francisco and Napa metro areas have added jobs at a faster pace than the nation.
At the same time unemployment rates have declined sharply throughout the region to the lowest levels since the dot.com boom.
While unemployment and unemployment rates have declined, labor force growth has shrunk to 0 for the past 12 months. This has created a very tight labor market where finding workers has become more difficult.
Job growth levels have declined sharply since last May from near 130,000 on a year over year basis to roughly half that level.
Is the slowdown a sign of serious trouble ahead or is this a temporary bump in the road.
Job growth will slow in the nation, state and region going forward as labor force growth slows with more boomers retiring.
But this week alone has brought positive signs for the region’s future.
Google is exploring a very large (20,000 job) expansion around Diridon station in San Jose that will, if completed, bring additional housing and retail activity,
Alphabet announced plans to add 300 modular units to the Moffett Field development in a test of whether modular units can be an important part of reducing the cost of housing in the region
The federal government announced that for now “dreamers” will be allowed to learn and earn
Last week Jeff Bellisario, one of the Institute’s co-authors of the Megaregion study came to an expert panel meeting I ran for the Sacramento Area Council of Governments in preparing their upcoming regional transportation and sustainable communities plan. The meeting, with Jeff’s help, explored the possibilities for improved economic competitiveness in the two regions through better Bay Area/Sacramento region connections.
Thanks, Jeff.
These economic updates are authored by Stephen Levy, Director of the Center for Continuing Study of the California Economy, and a member of the Bay Area Council Economic Institute board.
Much of the political rhetoric of the 2016 Presidential campaign focused on the winners and losers of the nation’s economic transformation over the past several decades, painting global trade and rapid technological advancements as villains stealing blue collar jobs and decimating local economies in places like Ohio, Michigan and Pennsylvania. The story, however, is far more complex and one that has huge implications for our region. The Bay Area Council and the Bay Area Council Economic Institute are delving into those complexities, and this week hosted a fascinating discussion with Ohio Congressman Tim Ryan and Silicon Valley Congressman Ro Khanna on the many and strong connections between the Bay Area and America’s heartland and the vast opportunity for deepening those connections to address concerns about economic displacement.
The conversation, which was moderated by former Economic Institute Chair and eminent UC Berkeley economist Laura D’Andrea Tyson, explored how the Bay Area’s innovation leadership can be leveraged to boost up places that are feeling left behind, the ways in which that can happen and the widespread economic benefits that it can produce. Institute president, Micah Weinberg initiated the conversation by telling the story of Alabama’s half a billion dollar investment that led to the auto manufacturing industry boom during a time in which many part suppliers in the region did not meet OSHA guidelines and standards. The industry grew by about 26,000 jobs, many of which were low-paying and dangerous. By contrast, Bay Area companies on brought 27,000 jobs with higher average wages to the region without the financial incentive Alabama-based companies received.
The Economic Institute also previewed an online tool that offers a detailed analysis of the existing jobs and economic connections between Bay Area companies and individual states and congressional districts. The tool will be formally launched in the coming weeks.
Read more about the conversation from Wired’s Nitasha Tiku.
The California Employment Development Department (EDD) has released job and labor force estimates for March 2017. Here are the highlights.
Job growth picked up in March led by gains in the Oakland metro area and the region again outpaces the nation and state in job growth.
Unemployment and unemployment rates continue to decline throughout the region.
National job growth slowed in March leaving the first quarter of 2017 with conflicting job trends in the nation, state, and region.
Year over Year Job Growth Strong but Slowing
The region added 94,100 jobs between March 2016 and 2017 for a gain of 2.5% compared to 1.5% for the nation and 2.1% for California.
Year over year job growth remains equal to or above the national average in all metro areas in the region except the Santa Rosa metro area though at a much slower pace than in the past two years. The Oakland metro area has become a growth leader in the past three months as the peninsula showed strong but slowing job gains compared to a year earlier.
The March job trends erase, for the moment, fears that January and February data showed a loss of competitive advantage for the region.
The job gains continue to push unemployment rates lower but labor force growth has slowed dramatically in recent months and is up only 0.3% over the past year. The regional unemployment rate at 3.6% is substantially lower than the national 4.5% and state 4.9% unemployment rates. Only the Vallejo metro area has an unemployment rate higher than the national rate.
Year over year job gains bounced back up in March after declining sharply in the first two months of 2017 from mid-2016 levels. It is too soon to know if the severity of the recent declines was a one-time event or reflects ongoing challenges for the region.
The continuing job growth now that unemployment rates have fallen will bring new residents to the region as will the growing need to replace retiring workers.
All of these trends underscore the importance of policies to increase housing and make sure that housing and transportation challenges do not undermine the region’s still vibrant economic competitiveness. Bay Area residents approved many funding measures for transportation and several local measures give hope that the housing supply and affordability challenges are being increasingly recognized by residents. The Bay Area Council has identified policies that can reduce costs and other barriers to expanding housing choices in the Solving the Housing Affordability Crisis report (2016).
While more communities such as San Francisco, Redwood City and Mountain View are now approving housing developments, the region has a long way to go and regional stakeholders will also want to watch the many housing bills now in the state legislature.
These economic updates are authored by Stephen Levy, Director of the Center for Continuing Study of the California Economy, and a member of the Bay Area Council Economic Institute board.
The California Employment Development Department (EDD) has released job and labor force estimates for February 2017 and revisions for 2015 and 2016. Here are the highlights.
Job growth slowed in the first two months of 2017 and now only slightly outpaces the state and nation while the region’s unemployment rate remains below 4%.
The region added approximately 10,000 more jobs in 2016 than originally reported.
This week Amazon announced a 1,300 job tech oriented expansion in East Palo Alto to take advantage of the region’s skilled workforce. This builds on the move by auto companies for similar reasons.
Year over Year Job Growth Strong but Slowing
The region added 74,700 jobs between February 2016 and 2017 for a gain of 2.0% compared to 1.6% for the nation and 1.9% for California. While the January and February job numbers may be revised upwards, the pace of job growth is likely to slow in 2017 and beyond as more baby boomers retire and the pool of unemployed workers shrinks.
Year over year job growth remains equal to or above the national average in all metro areas in the region though at a much slower pace than in the past two years.
The job gains continue to push unemployment rates lower but labor force growth has slowed dramatically in recent months and is up only 0.3% over the past year.
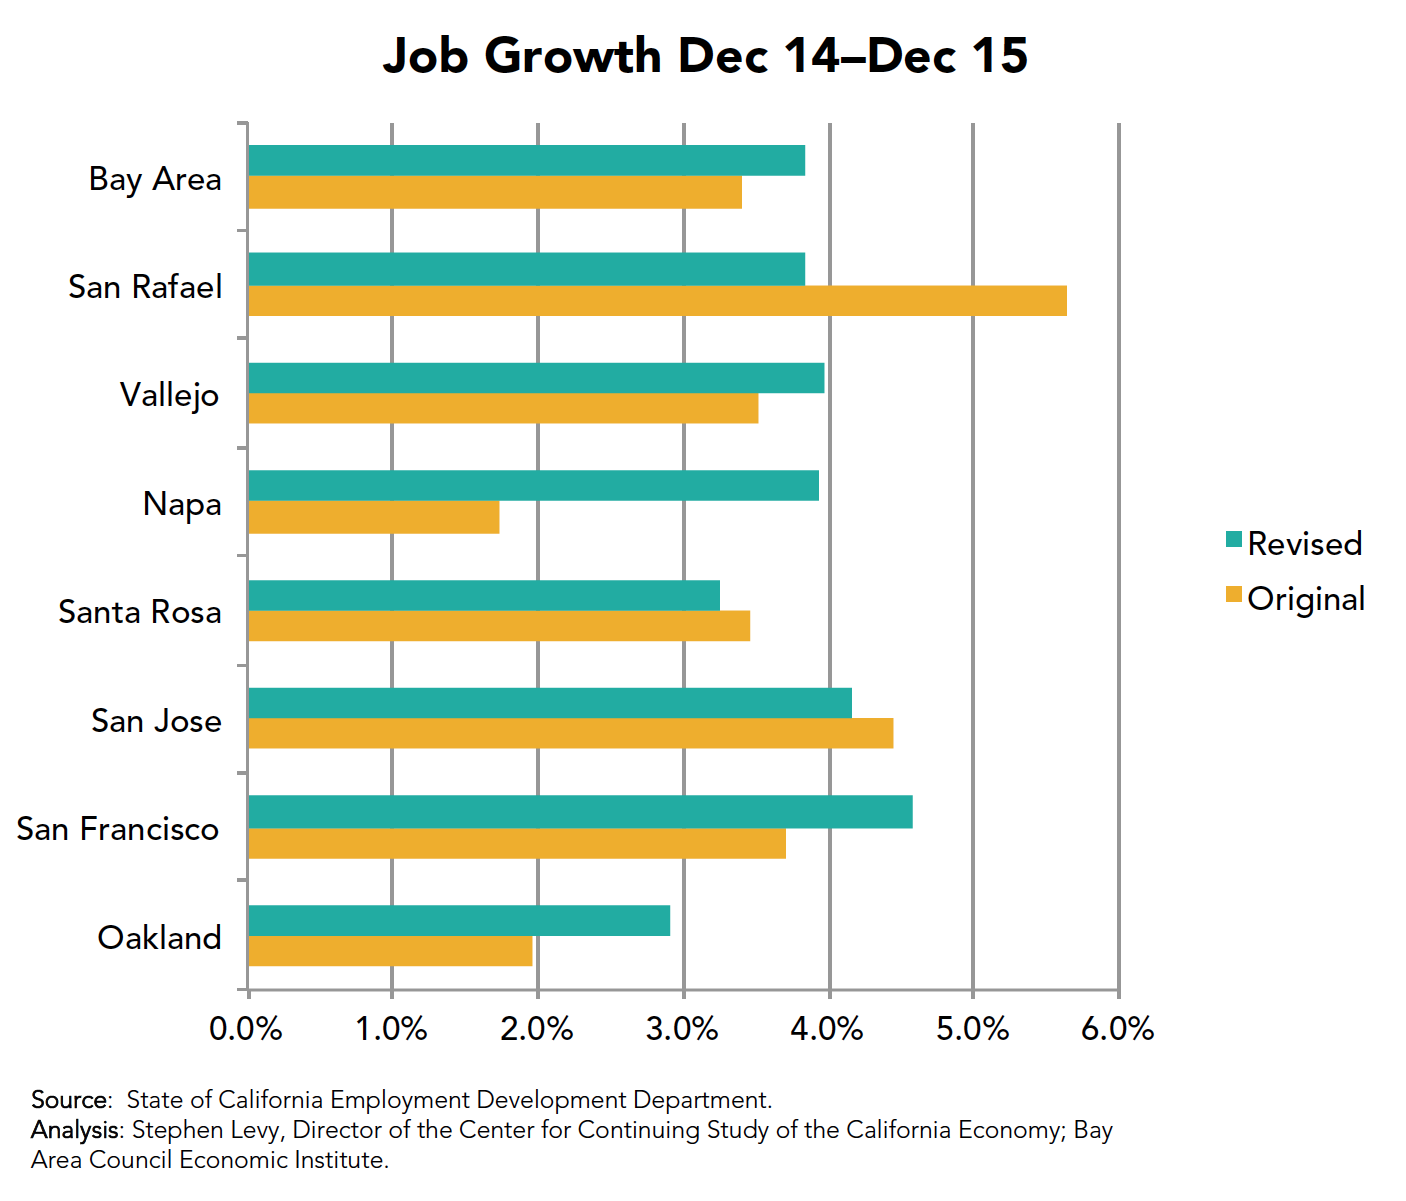
Each year in March EDD makes revisions to the previous year’s job estimates. Overall the region gained jobs in the revision though the Oakland and SF metros gained while the San Jose metro had fewer jobs than previously reported.
Year over year job gains declined sharply in the first two months of 2017 from mid-2016 levels. It is too soon to know if the severity of the recent declines will continue.
The continuing job growth now that unemployment rates have fallen will bring new residents to the region as will the growing need to replace retiring workers.
All of these trends underscore the importance of policies to increase housing and make sure that housing and transportation challenges do not undermine the region’s still vibrant economic competitiveness. Bay Area residents approved many funding measures for transportation and several local measures give hope that the housing supply and affordability challenges are being increasingly recognized by residents. The Bay Area Council has identified policies that can reduce costs and other barriers to expanding housing choices. http://www.bayareacouncil.org/economy/by-the-numbers-solving-the-housing-affordability-crisis/.
While more communities such as San Francisco, Redwood City and Mountain View are now approving housing developments, the region has a long way to go and regional stakeholders will also want to watch the many housing bills now in the state legislature.
These economic updates are authored by Stephen Levy, Director of the Center for Continuing Study of the California Economy, and a member of the Bay Area Council Economic Institute board.
This morning, Institute president Micah Weinberg participated in a segment of NPR’s Morning Edition along with reporter Stephanie O’Neill of Kaiser Health News. The segment discussed the impacts of the new Republican health care bill in California, a state where one in three residents rely on Medi-Cal for health insurance.
California was one of the states that fully embraced Obamacare to reduce the number of uninsured people. As it stands, Medi-Cal covers 14 million Californians. Of those covered, two-thirds actively participate in the labor force. Moreover, our 2016 Mainstreaming Medi-Cal report found that Medi-Cal generates $1.7 billion in increased yearly personal income in the state. A repeal of the program will have a devastating impact on the state’s economy.
Under the proposed Obamacare replacement, the Medi-Cal program would lose part of its federal funding and would be entirely cut from the federal budget by 2020. Although the actual magnitude of the impact of the proposed replacement plan is not yet determined, many people are expected to lose coverage or make the choice to drop out from Medi-Cal entirely.
Last week, upon request from California’s 14 GOP representatives, U.S. Transportation Secretary the Elaine Chao decided to delay the decision to award a $650 million federal grant to the state of California for the electrification of a Caltrain Bay Area commuter rail system. The proposed transformation would electrify the current railway system connecting San Jose and San Francisco, two of California’s major innovation and employment hubs.
The plan to electrify Caltrain’s railway system has been in the works for almost two decades, but the need to complete hasn’t been felt as urgent as now. In 2016, the Caltrain system carried over 62,000 riders per weekday, an 83% increase in ridership since 2010. Similarly, weekend ridership has increased 36% in the same period of time. This trend is expected to continue as the region’s residents and labor force increase.
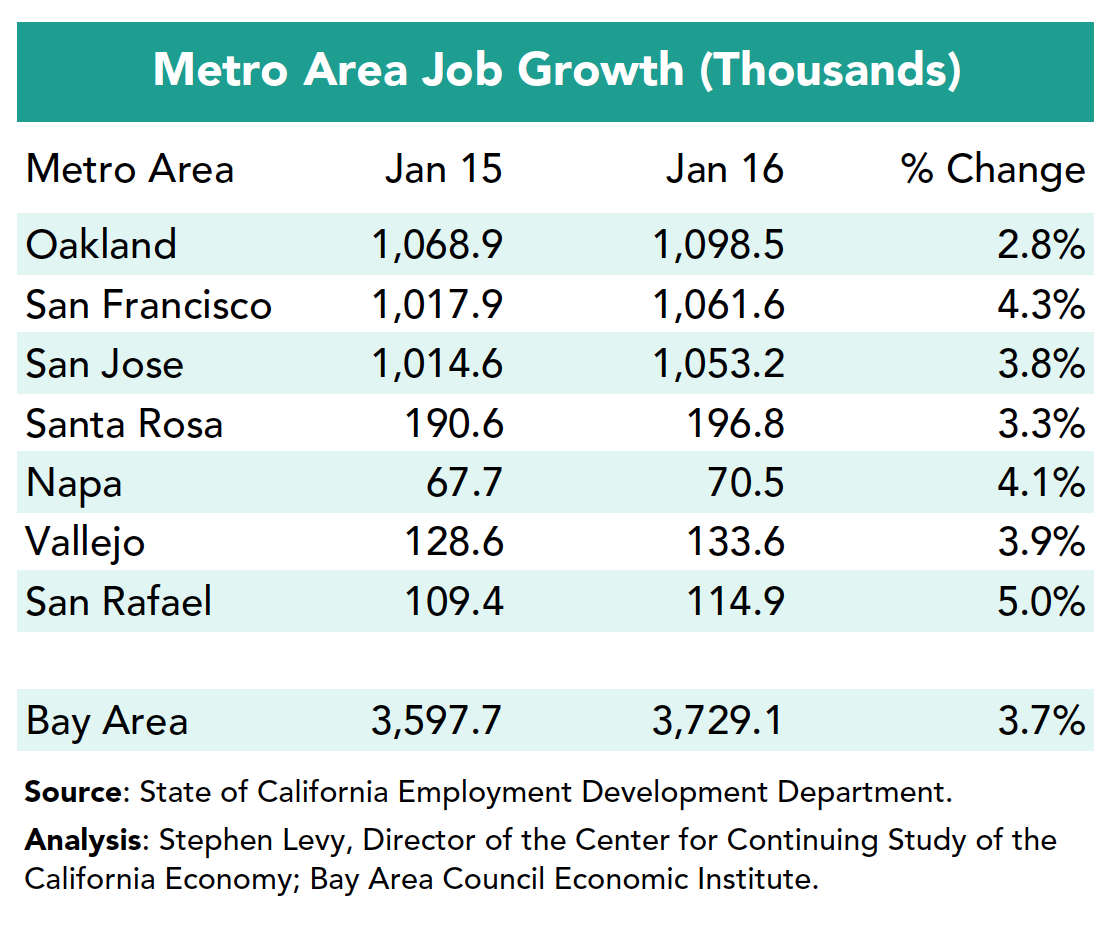
Continued job growth in the region seems to be the main driver for increased ridership. The San Francisco-Redwood City-South San Francisco and San Jose-Sunnyvale-Santa Clara metropolitan regions employ close to two million people and this number is expected to rise. Just between December 2015 and 2016, the Bay Area region added 100,300 jobs, a 2.4% increase compared to 1.5% for the nation and 2.0% for the whole state. Job gains continue to push unemployment rates lower even as the labor force continues to add workers although the region is now at or close to full employment.
The Bay Area is one of the nation’s top economic drivers. In 2015 alone the Bay Area generated over $666 million in GDP, ranking 3rd in GPD nationwide, behind the New York and Los Angeles metropolitan regions. Between 2014 and 2015 alone, the region saw a 5.8% increase in GDP compared 2.5% average increase seen by all other US metro areas.
According to MTC’s Vital Signs’ regional performance profile, the average time spent in public transportation by Bay Area commuters amounted to 48.9 minutes in 2014. Caltrain’s Project 2025 estimates that completion of this project would reduce commute time for riders by 10 minutes and would encourage people to use the system, resulting in increased ridership and fewer cars on the road. Further delay of the electrification of Caltrain penalizes the thousands of Californians that travel within the region, especially those that do so for work.
The fact that the Bay Area and its hubs are significant drivers for the US economy is undeniable. Delaying Caltrain’s electrification ultimately hurts workers and the overall productivity of the region. The Bay Area will continue to grow and its transportation infrastructure needs to meet the needs of the region’s residents.
Last week, Economic Institute President Micah Weinberg participated in a panel at the Brookings’ Center for Health Policy addressing what worked and what didn’t work in Obamacare insurance markets. Dr. Weinberg pointed out that “you can’t put together competing networks in an area with only one hospital system. If we really care about competition, we need to care about competitors. The competitors we care the most about are actually not the insurance plans, but rather the providers.”
The panel discussion parallels the newly released report Study of Affordable Care Act Competitiveness in California developed by the Economic Institute in partnership with Brookings. The report examines the implementation of the Affordable Care Act in California and assesses the interplay among factors such as health care provider concentration, the choices that the state made in implementation, the underlying market dynamics, and the extent to which the structure of the federal law all contributed to creating these choices for consumers across the many diverse regions of the state.
Most of what was said about trade during the presidential campaign was wrong. Chalk it up to politics, but both candidates fed voters a line that distorts our understanding of what free trade is about and how Americans benefit. Uninformed voters might be forgiven for believing them. It’s better, though, to know the facts.
First, let’s define what this is about. Free trade agreements are partnerships between nations that agree to drop barriers — such as tariffs and quotas — to trade. Such agreements make goods and services cheaper for both parties and increase jobs and exports for both.
Let’s also be clear that California has a lot at stake. As the nation’s second-largest exporting state and a technology powerhouse, we particularly stand to benefit from provisions that open agricultural markets (California is the nation’s largest agricultural exporter) and protect intellectual property and the cross-border movement of data — issues of great importance to our tech companies.
So here are the facts:
Free trade agreements are not killing manufacturing. At $2.2 trillion, U.S. manufacturing output is at an all-time high. But output is different from employment, which has been falling for decades. That’s a result of technology and improved efficiency in production processes, not trade agreements. Analysis shows that only 13 percent of manufacturing’s job loss is linked to trade, while 87 percent is caused by automation.
Free trade agreements don’t hurt the U.S. trade balance — they help it. Taken together, the U.S. has a positive balance of trade with the 20 countries with which it has free trade agreements. The U.S. International Trade Commission estimates that in 2015 those agreements contributed a net gain of nearly $60 billion to our global trade balance. Our deficit is overwhelmingly with countries such as China, where the U.S. does not have free trade agreements.
Free trade agreements are about growing the pie. Seventy-five percent of the world’s purchasing power is outside the United States, something U.S. companies can’t ignore. These agreements open doors. Even though the United States’ 20 free trade partners account for only 6 percent of the world’s population and less than 10 percent of its economy, they purchase nearly half of U.S. manufactured exports.
Our manufactured exports also are growing faster to our free trade partners than to countries where no U.S. free trade agreement is in place. In 2015, U.S. manufacturers sent $12.7 billion more in manufactured goods to those countries than they sold to us. At the same time, the U.S. had a $639 billion manufactured trade deficit with non-free-trade countries.
Distorted views of trade, an unfortunate legacy of the election, have extended to individual agreements. Is NAFTA really a disaster for jobs and manufacturing? Then why have manufactured exports to Canada and Mexico nearly quadrupled since NAFTA entered into force? The reality is that we buy a lot from Mexico and Canada, but many of those products are assembled from U.S.-made components.
The Trans-Pacific Partnership, a proposed agreement with 11 Asia-Pacific countries, is the biggest victim of this false debate. The U.S. International Trade Commission — the most authoritative source available — estimates that with a Trans-Pacific Partnership, both exports and imports would grow, but exports would grow faster. Both agriculture and services, the area where most economic growth today is occurring, would benefit as long-standing trade barriers in Japan and other countries are reduced. These are areas where California and the Bay Area lead.
The significance of free trade agreements runs deeper. They are about writing the rules of trade. When agreements such as Trans-Pacific Partnership protect intellectual property and the free movement of data, it’s because the U.S. has fought for those principles. Other provisions provide enforceable environmental and labor protections, which are core U.S. values. Those values aren’t universal, however. China has its own trade deal on the table with 16 Asia-Pacific countries (the Regional Comprehensive Economic Partnership) which does not share those priorities.
If we abandon the Trans-Pacific Partnership but China’s deal goes forward, then U.S. companies will lose competitiveness across the region. China can’t be faulted for advancing its interests and those of its companies. We have no less a responsibility to advance ours.
So where do we go from here?
Affirm our existing trade agreements. Tweak them, maybe. But acknowledge that they’re working and important to our economy.
Stick with the basics of the proposed Trans-Pacific Partnership. Its provisions are good for both the U.S. and its partners, and should serve as the foundation for any new proposals.
Support manufacturing by fixing the tax code. At 35 percent, our corporate tax rate is the highest in the developed world and should be reduced so that it’s closer to the global norm. This will encourage more investment in the United States. Tax rates should also be adjusted to encourage repatriation of the more than $2 trillion in profits our companies have parked overseas — if it’s reinvested in infrastructure or assets like production equipment and worker training.
Support U.S. workers.Far more workers benefit from these agreements than don’t, but for those who lose the pain is real. Trade Adjustment Assistance, which provides transitional assistance to workers who lose their jobs as a result of trade, should be revisited and strengthened.
If we’re really concerned about dislocated workers, however, then our national focus should be on the disruption of traditional employment being caused by advances in technology — a process that is only beginning. Developing a national strategy to anticipate those changes should be a bipartisan priority in Congress. But don’t stop trade.
Sean Randolph is Senior Director at the Bay Area Council Economic Institute
As the world watched the inauguration of President Donald Trump, the Bay Area Council Economic Institute’s 10th Annual Economic Forecast presented by McKinsey & Company and hosted by the Federal Reserve Bank of San Francisco convened leading economists and top experts to give their economic forecast for the Bay Area, California, and the nation.
The prognosis was clear. As we usher in the new administration, we are on stable footing. Dr. Christopher Thornberg, Founding Partner of Beacon Economics and a leading expert on the California economy, presented on a set of economic indicators, showing that much of the national political rhetoric around stagnant wages, the impact of trade, and unemployment is not borne out in the economic data. Labor markets are tight and becoming tighter across most of the United States. This is particularly true in California where the housing supply problem is one of the biggest challenges to continued growth. He also assessed that, while GDP is growing relatively slowly, it is growing and economic fundamentals, such as consumer spending, remain strong. Among the challenges cited for slow growth were self-inflicted wounds and political gridlock, a weak global economy, and the shift to an information economy among others. And, while there is little chance for a recession (for now), uncertainty surrounding the new administration’s policy agenda clouds the view forward. There are broad ramifications for potential change in policy in healthcare, immigration, social insurance, trade, manufacturing, and more.
San Francisco Fed President and Council Executive Committee member John Williams offered an exclusive perspective on the U.S. economy and federal monetary policy. Williams talked about the dynamics surrounding the U.S. labor market and how the Fed is likely to gradually increase its interest rate targets over time so that the economy grows without risking a bubble. Williams emphasized how the central bank is not influenced by partisan politics, staying politically independent, data-driven and focused on its narrow goals to promote low inflation, full employment and financial stability.
Bay Area Council Economic Institute Chair and McKinsey & Company Western Region Managing Partner Kausik Rajgopal and Aspen Institute Fellow Natalie Foster explored the “Future of the Worker” in the new age of automation and the growing gig economy. In the Bay Area, the independent workforce is 30 percent of the working age population with most digital independents working in order to earn when traditional jobs falter, to provide extra income for high cost of living or to buffer uneven income streams. One of the key points discussed was how automation is focused on specific activities rather than entire jobs, and can spur more job growth.
The California Employment Development Department (EDD) has released job and labor force estimates for December 2016. Here are the highlights.
Job growth slowed in December while year over year gains continue to outpace the state and nation.
Labor force growth remains strong which implies that job opportunities are strong enough to bring some workers back into the workforce.
At the same time as the labor force is surging, unemployment rates are at the lowest level since the dot.com boom.
Year over Year Job Growth Strong but Slowing
The region added 100,300 jobs between December 2015 and 2016 for a gain of 2.4% compared to 1.5% for the nation and 2.0% for California. The pace of job growth is likely to slow in 2017 and beyond as more baby boomers retire and the pool of unemployed workers shrinks but companies throughout the region continue to make plans for expansion as shown by the recent approval of the Facebook expansion in Menlo Park.
Year over year job growth remains above the national average in all but one metro area in the region.
The job gains continue to push unemployment rates lower even as the labor force continues to add workers although the region is now at or close to full employment.
While year over year job gains have declined from mid 2015 peaks, they remain in very healthy territory with no signs of a significant loss of competitive advantage. Job growth rates in 2016 are likely to be the peak going forward as baby boomer retirements are slowing labor force growth.
The continuing job growth now that unemployment rates have fallen will bring new residents to the region as will the growing need to replace retiring workers.
All of these trends underscore the importance of policies to increase housing and make sure that housing and transportation challenges do not undermine the region’s still vibrant economic competitiveness. Bay Area residents approved many funding measures for transportation and several local measures give hope that the housing supply and affordability challenges are being increasingly recognized by residents. The Bay Area Council has identified policies that can reduce costs and other barriers to expanding housing choices. Here is their analysis
Today President Trump was inaugurated.
His agenda has implications for the state and regional economy that will be explored by the Bay Area Council Economic Institute in future months. Here is a first analysis.
The region’s economy is tied to the world economy through trade, immigration and investment. All of these issues were discussed the incoming President and what happens in the coming legislative session will have major implications for the state and regional economies.
These economic updates are authored by Stephen Levy, Director of the Center for Continuing Study of the California Economy, and a member of the Bay Area Council Economic Institute board.
By Keith Carson Published on January 2nd, 2017
This op-ed originally appeared in the East Bay Times
My father always taught us that while we may not always accept the opinions of others, we must respect the opinions of others. For many of us living in this complex world, this concept is becoming more challenging with each passing day.
On Jan. 20, Donald Trump will be sworn in as the 45th president of the United States. While there are a range of emotions about Trump and his presidency, not much real attention has been focused on the 61 million Americans, including nearly 4 million Californians and 215,000 residents of Alameda and Contra Costa counties, who elected him to that office.
This campaign brought to light the great divide that exists in this country, one that we suppress, dismiss and ignore, but unfortunately surfaces daily.
Annual statistics document the grave disparities that have existed and still exist in education, housing, employment, the criminal justice system, and a range of other areas.
Disproportionately these disparities have impacted black, brown, and other people of color, indigenous people, and struggling, poor whites.
While President-elect Trump openly campaigned on attacking approaches to achieve equity, his 61 million supporters felt his platform reflected their views and values. These are 61 million people who live among us, teach in our schools, protect and serve, and make important decisions in government, business, and public life.
This 61 million decide daily who will or will not get sent to jail, receive a loan, get expelled from school, or receive medical attention.
We must engage the Trump presidency and the 61 million people who voted to elect him and his vision for America. Our faith-based organizations need to honestly and transparently revisit the doctrines upon which they were founded, answering the age-old question, “Am I my brother’s/sister’s keeper?”
Our public safety institutions must critically examine the scales of Lady Justice and ask themselves, “Are we a just society?” And we local elected officials must also look in the mirror and ask, “Are we taking the strides to serve the greatest good for our communities?”
Together we must begin an authentic dialogue with one another, even with those of different opinions.
Our local faith-based and community organizations need to open their doors and initiate these conversations in earnest at the ground level.
Those of us in public leadership need to come together and identify a common agenda to unite us around our shared goals.
Doing so can highlight that despite our differences of skin color, sexual orientation, religious belief, or economic status, we have far more in common.
We share the desires of a better future for our community and to live in peace, to develop to our maximum potential, and to genuinely embrace those who may be different from us.
Keith Carson represents District 5 on the Alameda County Board of Supervisors. Carson can be reached at 1221 Oak St., Suite 536, Oakland, CA 94612, 510-272-6695 or dist5@acgov.org.
Keith Carson is part of the Economic Institute’s Board of Trustees.
Header image by AP Photo/Evan Vucci
The California Employment Development Department (EDD) has released job and labor force estimates for November 2016 and the California Department of Finance has released county population estimates for 2016. Here are the highlights.
Although job growth slowed slightly in November year over year gains continue to outpace the state and nation and year over year job growth is remains above 100,000.
Labor force growth remains strong and is outpacing population growth, which implies that job opportunities are strong enough to bring some workers back into the workforce.
At the same time as the labor force is surging, unemployment rates are at the lowest level since the dot-com boom.
Population growth slowed in the state and region in 2016 but the Bay Area remains the fastest growing region in California measured by both jobs and population since 2010.
Year over Year Job Growth Strong but Slowing Slightly
The region added 100,300 jobs between November 2015 and 2016 for a gain of 2.7% compared to 1.6% for the nation and 2.3% for California. The pace of job growth is likely to slow in 2017 and beyond as more baby boomers retire but companies throughout the region continue to make plans for expansion as shown by the recent approval of the Facebook expansion in Menlo Park.
Year over year job growth remains above the national average in all but one metro area in the region.
The job gains continue to push unemployment rates lower even as while the labor force continues to add workers although the region is now at or close to full employment.
While year over year job gains have declined from mid 2015 peaks, they remain in very healthy territory with no signs of a significant loss of competitive advantage. Job growth rates in 2016 are likely to be the peak going forward as baby boomer retirements are slowing labor force growth.
The continuing job growth now that unemployment rates have fallen will bring new residents to the region as will the growing need to replace retiring workers.
All of these trends underscore the importance of policies to increase housing and make sure that housing and transportation challenges do not undermine the region’s still vibrant economic competitiveness. Bay Area residents approved many funding measures for transportation and several local measures give hope that the housing supply and affordability challenges are being increasingly recognized by residents. The Bay Area Council has identified policies that can reduce costs and other barriers to expanding housing choices. Read the report here.
The national election results have implications for the state and regional economy that will be explored by the Bay Area Council Economic Institute in future months. Click here to read the analysis.
Summary Population Update
The Bay Area added 67,400 residents in the year ending June 30, 2016. This is slightly less than in the previous three years. The fastest growth rates since 2010 were in Alameda (8.1%), Santa Clara (7.8%), San Francisco (7.7%) and Contra Costa (7.5%). For the first time since the Gold Rush days the Bay Area is the fastest growing region in California and also outpaced the nation in population growth. More details will come in the next update.
These economic updates are authored by Stephen Levy, Director of the Center for Continuing Study of the California Economy, and a member of the Bay Area Council Economic Institute board.
Recap
Thirty-five business leaders, government officials, and real estate developers convened in San Francisco on December 8 to tackle two questions that are vexing California families, governments, and employers: In the face of surging housing demand, high housing prices, and historically low interest rates, why does California chronically under-produce housing?What can we do in the near term to unlock supply?
Context: California real estate prices have risen three times faster than household incomes. As a result, more than half of the state’s residents cannot afford housing. This housing affordability gap, which is particularly acute in San Francisco, hurts families, exacerbates homelessness, and damages the region’s economic competitiveness. McKinsey & Company’s 2016 California housing affordability report ranked California 49th out of 50 U.S. states for housing supply—and estimated that California needs to build 3.5 million housing units by 2025. The analysis identified physical capacity to build five million new housing units in the state—including 500,000 potential units in the inner Bay Area. According to a recent report from the Bay Area Council Economic Institute, public policy can play a critical role in unlocking supply and creating a greater degree of affordability for families. The report analyzes 20 proposed or enacted San Francisco housing policies and their impacts on affordability.
Some of the key themes discussed included:
Win hearts and minds for housing. We need storytelling, not just data. Building conviction for housing among major voting blocs—e.g., environmentalists and organized labor—is critical. “Never let a good crisis go to waste”. The state could reframe the conversation by declaring a housing crisis and the electorate would be receptive to action due to skyrocketing rents and home prices. Critical electoral groups—the middle-income workforce, seniors and millennials—are particularly affected by this crisis. A professional public relations strategy could go a long way toward winning the hearts and minds of all stakeholders.
Develop a deeper fact base on what drives or impedes housing production. For cost reasons, housing production in California skews towards single-family structures rather than mid-rise or high-rise. The economics of dense development become even more challenging when fees and other policy-driven costs are included. To stimulate infill, we need to understand compressible costs, including the cost impacts of current regulations (e.g., Title 24) and potential future regulations (e.g., Zero Net Energy, purple pipe). If the net effect of environmental regulations is to force people to relocate from California to Texas, where per capita Greenhouse Gas production is three times higher, that is not a positive outcome for the environment.
Help transit agencies accelerate transit-oriented development. BART, Valley Transit Authority, and LA Metro have announced major housing commitments on agency-owned land. Fast tracking the development of these projects will demonstrate what is possible and link densely-built housing with access to transit. California could experiment with “housing accelerators” in the highest-potential transit station areas (e.g., tax increment financing, development-impact fee relief, cap and trade funding, inclusionary zoning, minimum density requirements, eminent domain, and streamlined approvals). By bringing transit agencies, city planning officials, developers, and community advocates together to plan and build successful developments, these accelerators can become a model for other California cities.
Improve funding for housing projects. Creating new transportation/housing funding streams linked to local housing production, imposing a ceiling on development impact fees (waived for cities that meet housing targets), financing non-housing infrastructure at mega-project sites, and committing state resources to facilitate Enhanced Infrastructure Financing Districts could make a big difference.
Give local governments “political cover” to create more housing. Modeled on the Massachusetts Chapter 40B example, allow developers to appeal to a state entity if local governments block housing projects that meet stated sustainability goals.
Rethink sacred cows. Consider revisiting Proposition 13, CEQA, and local control over land use as part of a grand bargain on housing.
Experiment with policy innovations. Options include granting the California Attorney General power to enforce housing element law by suing non-compliant jurisdictions; streamlining land-use approvals for affordable housing projects and transit oriented development (TOD); empowering a state entity to prioritize state-owned land for housing; and creating “policy innovation zones” in housing hotspots.
Bay Area households have the second highest median household income in the country, nonetheless households struggle to afford their basic needs.
The Bay Area has recovered from the Great Recession faster than the rest of the nation, and has proven to be resilient to economic downturns. Labor force participation and job growth rates have surpassed those of the nation. Nonetheless, despite the region’s economic success households have not seen their income rise at a fast enough pace to keep up with the rising cost of living.
According to the Bureau of Labor Statistics, the Bay Area Consumer Price Index (CPI) reached 258.5 in 2015. The index takes into account the cost of shelter – for homeowners and renters – as well as the cost of everyday expenses such as apparel, transportation and medical care. Between 2000 and 2015, CPI saw an increase of 78.4%, one of the fastest growing cost of living for US metro areas. During the same period, the median household income in the Bay Area saw increased from $73,000 to $103,600, a 41.9% total increase 36.5 percentage points behind CPI.
To put things into a national context, the 2015 annual CPI for the whole nation was 237.01 and only saw a .1 percent increase from the previous year. On the other hand, the San Francisco-Oakland-San Jose MSA’s CPI for 2015 was 258.57 saw a 2.6 percentage growth during the same period.
While the Bay Area’s increase in CPI surpassed the nation’s by only a few percentage points, the Bay Area is one of the most expensive regions in the country with median home sale prices tripling the nation’s average. In 2015, the average home sale price in the Bay Area was $766,394, while the nation’s was $247,600. Similarly, Bay Area renters pay among the highest prices for rent in the nation with thirteen Bay Area cities ranking in the top 20 nationally. Listings for one-bedroom apartments in Palo Alto, San Francisco, and Cupertino averaged $3,423 in 2015.
The presidential election focused on the disappearance of manufacturing jobs in the United States as well as the move to repeal the Affordable Care Act, which if it does nothing else, will dramatically decrease the amount of money the federal government spends on healthcare. A deeper dive into the relevant economic data raises important questions about these priorities at least as it relates to job creation. The chart below shows the trend for California that mirrors the trend in the nation: As manufacturing jobs declined over several decades largely driven by automation, they were replaced by healthcare jobs that are substantially more difficult to automate or offshore. There is reason to believe, therefore, that pumping more money, resources and attention into manufacturing at the expense of healthcare may be – for whatever other virtues this strategy may hold – problematic from the standpoint of job creation.
The trend in the Bay Area mirrors the trend in California and highlights the other missing piece of the conversation. Though manufacturing jobs are far below their historic peaks in the mid-20th century, there has been a slow and steady rebound of manufacturing employment in the region over the course of the past 5+ years. This is indicative of the increasing strength of the domestic economy during this time, and the emergence of export-driven high value-added manufacturing clusters in the Bay Area and throughout the nation. Pretending that manufacturing jobs are still in freefall, therefore, may lead to a belief that more aggressive anti-trade measures could prop up this sector of the economy. They would be much more likely, however, to choke off this rebound and impact not only these jobs but an economy that is producing a greater value of manufactured goods than at any other time in history.
Written by Micah Weinberg, PhD
Institute Welcomes New Chair
The Bay Area Council Economic Institute is happy to announce the appointment of Kausik Rajgopal to Chair of the Institute’s Board of Trustees. Kausik is Senior Partner and West Coast Regional Manager at McKinsey & Company, and brings extensive experience in strategy, operations, and the public sector. In addition to serving as Chair of the Economic Institute, Kausik also serves on the advisory board of Stanford University’s Center for Comparative Studies in Race and Ethnicity.
The Institute would like to thank outgoing Chair, Dr. Laura D’Andrea Tyson, for her exceptional service and ongoing commitment to the Institute and to the Bay Area. Under Dr. Tyson’s leadership the Institute released dozens of highly-influential reports and hosted thoughtful economic and public policy discussions with elected officials and thought leaders from here and abroad.
Solving The Housing Affordability Crisis:
How Policies Change the Number Of San Francisco Households Burdened by Housing Costs
On Wednesday October 19th, the Bay Area Council Economic Institute released its one of a kind Solving the Housing Affordability Crisis report, an analysis of how policies in San Francisco affect the number of households burdened by housing costs. The report compiles a list of 20 housing-related state and local policies that increase and worsen affordability in San Francisco. The analysis finds that while the city has seen an increase of 22% in employment between 2009 and 2015, it has lagged on the development of new housing, causing demand to drive up housing costs.
The report calls for state and local policymakers to consider the impact their policies have on housing affordability for individuals and families. The analysis ultimately finds that the best way to alleviate housing cost burdens is by building all types of housing.
The report was featured in an editorial piece on the San Francisco Chronicle’s Sunday paper, where it received praise for its objectiveness.
This month’s Bay Area Job Watch found that the region added 108,100 jobs between September 2015 and 2016 for a gain of 2.9% compared to 1.7% for the nation and 2.3% for California. While the pace of growth has slowed from the mid-summer 2015 highs year over year gains remain robust.
Yet the most impressive statistic in the September report is the continuing strong increase in the region’s labor force. In the past 12 months 123.800 workers have joined the labor force (+3.0%) far outpacing the 1.0% population increase. This means that economic growth is reaching more people in the region and that is good news. All of these trends underscore the importance of policies to increase housing and make sure that housing and transportation challenges do not undermine the region’s still vibrant economic competitiveness.
Upcoming Events and Report Releases
ANNUAL ECONOMIC FORECAST
January 20, 2017
8:00am – 11:00am
Federal Reserve Bank of San Francisco
Yellen Conference Center
101 Market Street
San Francisco, CA 94105
Upcoming Board Meetings
Basic Board of Directors Meeting
December 12, 2016
2:00pm – 8:00pm
University of California, San Francisco
BASIC Board of Directors and By Invitation Only
The California Employment Development Department (EDD) has released job and labor force estimates for October 2016. Here are the highlights
Possibly the most impressive statistic in the October report is the continuing strong increase in the region’s labor force. In the past 12 months 116,700 workers have joined the labor force (+2.8%) far outpacing the 1.0% population increase. While monthly labor force participation rate estimates are not available for the region, it must be true from these numbers that the region’s force participation rate has jumped while baby boomer retirements continue to put downward pressure on labor force growth.
This means that economic growth is reaching more people in the region and that is good news. Not everyone is fully participating but the trend is positive and unemployment rates remain low despite fast labor force growth.
Year Over Year Job Growth Strong but Slowing Slightly
The region added 102,000 jobs between October 2015 and 2016 for a gain of 2.7% compared to 1.7% for the nation and 2.4% for California. The pace of growth has slowed from the mid-summer 2015 highs although year over year gains remain robust.
Year over year job growth remains above the national average in all metro areas.
The job gains continue to support low unemployment rates while the labor force continues to add workers although the region is now at or close to full employment.
While year over year job gains have declined from mid 2015 peaks, they remain in very healthy territory with no signs of a significant loss of competitive advantage. Job growth rates in 2016 are likely to be the peak going forward as baby boomer retirements are slowing labor force growth.
The continuing job growth now that unemployment rates have fallen will bring new residents to the region as will the growing need to replace retiring workers.
All of these trends underscore the importance of policies to increase housing and make sure that housing and transportation challenges do not undermine the region’s still vibrant economic competitiveness. Bay Area residents approved many funding measures for transportation and several local measures give hope that the housing supply and affordability challenges are being increasingly recognized by residents.
The national election results have implications for the state and regional economy that will be explored by the Bay Area Council Economic Institute in future months.
Some of the obvious areas of concern are the negative impacts that restricting trade and immigration will have on an innovation economy.
These economic updates are authored by Stephen Levy, Director of the Center for Continuing Study of the California Economy, and a member of the Bay Area Council Economic Institute board.
The California Employment Development Department (EDD) has released job and labor force estimates for September 2016. Here are the highlights:
Possibly the most impressive statistic in the September report is the continuing strong increase in the region’s labor force. In the past 12 months 123.800 workers have joined the labor force (+3.0%) far outpacing the 1.0% population increase. While monthly labor force participation rate estimates are not available for the region, it must be true from these numbers that the region’s force participation rate has jumped while baby boomer retirements continue to put downward pressure on labor force growth.
This means that economic growth is reaching more people in the region and that is good news. Not everyone is fully participating but the trend is positive and unemployment rates remain low despite fast labor force growth.
Year Over year Growth Increased in September
The region added 108,100 jobs between September 2015 and 2016 for a gain of 2.9% compared to 1.7% for the nation and 2.3% for California. The pace of growth has slowed from the mid-summer 2015 highs although year over year gains remain robust.
Year over year job growth picked up a bit in September as discussed above and remains far above the national average in all metro areas.
The job gains continue to reduce unemployment rates (more slowly in September) while the labor force continues to add workers although the region is now at or close to full employment.
While year over year job gains have declined slightly from mid-2015 peaks, they remain in very healthy territory with no signs of a significant loss of competitive advantage. Job growth rates in 2016 are likely to be the peak going forward as baby boomer retirements are slowing labor force growth.
The continuing job growth now that unemployment rates have fallen will bring new residents to the region as will the growing need to replace retiring workers.
All of these trends underscore the importance of policies to increase housing and make sure that housing and transportation challenges do not undermine the region’s still vibrant economic competitiveness. Bay Area residents will have many opportunities at the ballot in November to support investments in transportation and housing for low income and vulnerable residents.
These economic updates are authored by Stephen Levy, Director of the Center for Continuing Study of the California Economy, and a member of the Bay Area Council Economic Institute board.
By Micah Weinberg and Derecka Mehrens Published on 9/29/2016
This piece originally appeared in The Mercury News
Santa Clara County voters have a once in a generation opportunity in November to support essential investments in transportation improvement when they decide how to vote on Measure B. This half-cent, 30-year sales tax measure will repair streets and complete the BART extension to San Jose and Santa Clara among other important investments.
If passed by two-thirds of voters, the measure will generate $6.3 billion to fund transportation projects. But in addition to this investment, there are other immense economic benefits derived from improving roads and transit in the county.
A recent study by the Bay Area Council Economic Institute found that Measure B will be a gigantic economic boon to the county, creating nearly 4,000 jobs and more than $15.4 billion in increased business output.
The good jobs Measure B will support cut across a range of industries, skills and incomes, including construction jobs, manufacturing and professional services. Local workers and businesses will be among the chief beneficiaries.
The $6.3 billion in total transportation spending over 30 years will stimulate the local economy through local contracting and support on-going operations and maintenance jobs.
Further, this funding will allow Santa Clara County to leverage additional funds for greater investment from state and federal sources and create an even greater impact. The direct spending will have ripple effects as dollars change hands and translate into new jobs and new business revenues.
To calculate the economic impacts, the Bay Area Council Economic Institute employed computer modeling widely used by federal, state, and local transportation agencies. The model considers a range of information and projections, including future population growth and travel patterns, labor and goods movement, market access and construction spending, to estimate the costs, benefits, and economic impacts that flow from them.
In addition to the many direct and indirect effects of Measure B investments, there are other economic impacts that are just as important but more difficult to quantify.
For example, San Jose has the fastest growing traffic congestion of any metropolitan area in the U.S. From 2010 to 2014, the annual number of hours of traffic delay per commuter grew from 37 to 51 hours, a 36.8 percent increase. It’s one of only two major metropolitan areas to exceed a 30 percent increase.
That growing delay creates a huge drag on worker productivity, discourages new economic investment, adds to harmful air pollution and generally diminishes our quality of life.
The immediate benefits of more efficient transportation are most easily noticed in reduced congestion, expanded transportation options and travel time savings.
The long-term benefits of infrastructure investments like this can shape the region’s economy and prepare it for continued economic growth and resiliency against future downturns, including improving access to jobs for the county’s residents, providing economic development opportunities near new transportation hubs, extending the regional labor pool available to employers and enhancing worker productivity.
Santa Clara County was the first in the state to use a sales tax to pay for local transportation infrastructure when Measure A was passed in 1976. The county has continued to use sales taxes to fund transportation – to the tune of raising $8 billion over the last 40 years. In that time, Santa Clara County has built the fastest growing economy in the United States.
In Silicon Valley, where taking risks is a way of life, investing in transportation infrastructure is almost a sure thing.
Micah Weinberg is president of the Bay Area Council Economic Institute. Derecka Mehrens is executive director of Working Partnerships USA. They wrote this for The Mercury News.
The California Employment Development Department (EDD) has released job estimates for August 2016. Here are the highlights:
Year over year growth slowing, but still strong
The region added 101,800 jobs between August 2015 and 2016 for a gain of 2.7% compared to 1.7% for the nation and 2.3% for California. The pace of growth has slowed from the mid-summer 2015 highs although year over year gains remain robust. The state jobs report showed a gain of 63,100 jobs in August but the Bay Area added only 4,000 jobs seasonally adjusted, an estimate that is likely to be revised up as it is implausible that the region added barely 5% of the state gains.
The job gains continue to reduce unemployment rates while the labor force continues to add workers.
Year over year job growth slowed in June as discussed above but remains far above the national average in all metro areas.
Possibly the most impressive statistic in the August report is the very strong increase in the region’s labor force. In the past 12 months 92,400 workers have joined the labor force (+2.2%) far outpacing the 1.0% population increase. While monthly labor force participation rate estimates are not available, it must be true from these numbers that the region’s force participation rate has jumped while the comparable state and national rates are under pressure from baby boomer retirement.
This means that economic growth is slowly reaching more people in the region and that is good news. Not everyone is fully participating but the trend is toward improvement.
While year over year job gains have declined slightly from mid 2015 peaks, they remain in very healthy territory with no signs of a significant loss of competitive advantage. Job growth rates in 2016 are likely to be the peak going forward as baby boomer retirements are slowing labor force growth.
The California job growth trends put the state near of the top of the nation’s most populous states, in part because job growth has accelerated in Southern California and parts of the Central Valley including San Joaquin County adjacent to the Bay Area and also in Fresno County.
The continuing job growth now that unemployment rates have fallen will bring new residents to the region as will the growing need to replace retiring workers.
All of these trends underscore the importance of policies to increase housing and make sure that housing and transportation challenges do not undermine the region’s still vibrant economic competitiveness.
These economic updates are authored by Stephen Levy, Director of the Center for Continuing Study of the California Economy, and a member of the Bay Area Council Economic Institute board.
This month, the U.S. Bureau of Economic Analysis released 2015 GDP estimates for metropolitan areas in the nation. An analysis by Stephen Levy from the Center for Continuing Study of the California Economy found that all major regions in California came ahead of the nation in real GPD growth, but the Bay Area lead both the state and the nation with a real GDP gain of 5.8% (inflation adjusted). The Bay Area’s $721 billion dollar economy would land it 6th among the top ten states measured by the value of goods and services produced in each state. Globally, the Bay Area would rank 16th just behind Mexico and ahead of Indonesia.
The San Jose-Sunnyvale-Santa Clara and San Francisco-Oakland metropolitan areas led all metro areas in California in real GDP growth in 2015 with an increase of 8.9% and 4.1%, respectively. Part of San Jose-Sunnyvale-Santa Clara metro area’s economic success is attributed to its continuous growth in the technology sector, which ultimately made it the 2nd fastest growing metropolitan region in the nation between 2014 and 2015.
Overall, Califonia continues leading the nation with $2,459 billion dollars in real GDP in 2015 as all regions in the state outpaced the nation.
By Sean Randolph and Mark Pisano Published on 9/19/2016
This piece originally appeared in the Capitol Weekly
They blew it. Fifteen months ago, Governor Brown called the Legislature into special session to find new ways to pay for the state’s aging transportation system.
A huge coalition—from highway and transit groups to trucking associations and business and labor organizations—asked the Legislature to put money into the system and improve accountability and results, citing clear benefits for jobs, economic development, and the environment.
Nothing happened.
Some hearings were held and a few tax proposals were considered, none on the scale needed to do the job. None were voted on, and the special session recessed last week with a whimper.
It’s time to move in a new direction—away from Sacramento’s political gridlock and toward a regional approach to governing and funding California’s transportation systems.
Until we do, it’s clear California’s deteriorating roads and aging transit systems will only get worse—continuing to be a drag on the economy. The Legislature focused this year on one part of the problem: the state’s $59 billion backlog in road maintenance. CA Fwd recently concluded that our transportation systems, from highways and bridges to airports and local roads, will require almost 10 times that much—$530 billion—to safely maintain and operate over the next 10 years. With the main source of state revenue—the gas tax—failing to keep pace with demand, public agencies have less than half the funds they need to pay for it. The state’s total transportation funding shortfall? Nearly $300 billion and climbing.
The source of this problem isn’t just funding or Sacramento politics: It’s an obsolete governance system—one that, for decades, funneled large amounts of federal money, matched with state dollars, to road, highway, and transit projects. With federal money drying up, state money is proving inadequate, and our leaders can’t seem to find innovative solutions.
While the state fiddles, local governments are taking action—and it’s at the local and regional level that the next generation of transportation solutions must be devised.
Taxpayers in 21 counties already pay for a sizable portion of their own transportation systems. These so-called “self-help” counties have approved $4 billion a year in local sales tax measures for everything from highway tunnels and transit extensions to local roads.
Those numbers are about to get a lot bigger.
Desperate to close growing funding gaps, four of the state’s biggest counties—Los Angeles, San Diego, Sacramento, and Santa Clara—will ask voters in November to approve nearly $150 billion in new tax measures—on top of existing taxes—over the next 30 years. These funds will go to everything from new transit (Santa Clara has earmarked $1.5 billion for extending BART into San Jose) to basic road repair (LA plans to spend $2.4 billion on maintenance alone). Six new counties are also poised to join the self-help ranks, with even conservative counties asking voters to raise taxes.
Let’s finally acknowledge what’s really happening: If state leaders are going to keep pushing more of this burden onto local governments, we need to give communities the tools to do the job.
We believe the time has come to develop a new relationship between the state and California’s economic regions—a new governance structure that will promote the kinds of transportation investments a growing population requires. If we are willing to consider policies that unleash the successful regional and county model—where voters even in tax-averse areas tend to support new transportation taxes when they see what they’re paying for—we could see a new generation of projects emerge, tailored to community needs.
The Brown administration has already laid the fiscal groundwork with its Enhanced Infrastructure Financing Districts, which will allow communities to combine private investments with a portion of the growth in their own economic development to finance transportation projects for years to come. These districts have the authority to capture the revenues—and other benefits—new infrastructure generates to pay for these investments. As communities fund more projects through public-private partnerships and performance-based financing, drivers and passengers will also have to contribute more through fees and usage charges, as will landowners and businesses that benefit from increased mobility.
This model will require a different role for the state, which should provide fiscal incentives to locals making investments that meet state goals while ensuring equity in regions lacking resources.
It won’t be easy to shift the transportation system away from California’s decades-long reliance on state funding, but it’s not impossible, either. It’s better than gridlock. And we believe its time is now.
— Ed’s Note: Mark Pisano is chair of the Southwest Megaregion Alliance and former executive director of Southern California Association of Governments. Sean Randolph is senior director of the Bay Area Council Economic Institute
The California Employment Development Department (EDD) has released job estimates for June 2016. Here are the highlights:
Year over year growth slowing but still strong
The region added 104,100 jobs between July 2015 and 2016 for a gain of 2.6% compared to 1.7% for the nation and 2.3% for California. The pace of growth has slowed from the mid-summer 2015 highs although year over year gains remain robust. The state jobs report showed a gain of 36,400 jobs in July and a year over year gain of 374,600 jobs or 15.3% of the national job gain. These year over year gains understate the strength of local and state economies as the July 2015 job gains were very large and affect the year over year comparisons.
The job gains continue to reduce unemployment rates while the labor force continues to add workers.
Year over year job growth slowed in June as discussed above but remains far above the national average in all metro areas.
While year over year job gains have declined slightly from mid 2015 peaks, they remain in very healthy territory with no signs of a significant loss of competitive advantage. Job growth rates in 2016 are likely to be the peak going forward as baby boomer retirements are slowing labor force growth.
The California job growth trends put the state near of the top of the nation’s most populous states, in part because job growth has accelerated in Southern California and parts of the Central Valley including San Joaquin County adjacent to the Bay Area and also in Fresno County.
These economic updates are authored by Stephen Levy, Director of the Center for Continuing Study of the California Economy, and a member of the Bay Area Council Economic Institute board.
The California Employment Development Department (EDD) has released job estimates for June 2016. Here are the highlights:
Bay Area Job Growth Rebounds From Slow May Job Growth
The region added 121,500 jobs between June 2015 and 2016 for a gain of 3.3% compared to 1.7% for the nation and 2.9% for California. The pace of growth has slowed from the mid-summer 2015 highs although year over year gains remain robust. The state jobs report showed a gain of 40,300 jobs in June and a year over year gain of 461,100 jobs or 18.8% of the national job gain.
The job gains continue to reduce unemployment rates while the labor force continues to add workers. However, unemployment rates jumped more than expected throughout the state in June, possibly as a result of seasonal factors that will reverse in July.
Year over year job growth has slowed slightly in the region though remaining above 3% in region and above the national average in all metro areas.
While the year over year job gains have declined slightly from mid-2015 peaks, they remain in very healthy territory with no signs of a significant loss of competitive advantage. Job growth rates in 2016 are likely to be the peak going forward as baby boomer retirements are slowing labor force growth.
The California job growth trends put the state near of the top of the nation’s most populous states, in part because job growth has accelerated in Southern California and parts of the Central Valley including San Joaquin County adjacent to the Bay Area and also in Fresno County.
The continuing job growth now that unemployment rates have fallen will bring new residents to the region as will the growing need to replace retiring workers.
All of these trends underscore the importance of policies to increase housing and make sure that housing and transportation challenges do not undermine the region’s still vibrant economic competitiveness.
Last week the Bay Area was the site of the first listening tour by the administration with regard to the details of the Governor’s new by right housing proposal with San Francisco Mayor Ed Lee joining the panel. And in November voters throughout the region will weigh in on new transportation funding measures.
These economic updates are authored by Stephen Levy, Director of the Center for Continuing Study of the California Economy, and a member of the Bay Area Council Economic Institute board.
BAY AREA JOB WATCH:
NATIONAL JOB GROWTH SLOWS, ANOMALY OR TREND?
Latest figures released by the Bureau of Labor Statistics and California Employment Development Department show national job growth at its lowest level since 2010, though the state and region continue to grow at a reasonable pace, with Bay Area growth continuing to outpace the nation and state by a significant margin. An analysis in this month’s Bay Area Job Watch conducted for the Institute by Trustee Steve Levy found that while the pace of growth has continued to slow from the mid-summer highs of 2015, the region is still adding jobs at a robust 3.1 percent year-over-year.
The disappointing national figures for May led policymakers at the Federal Reserve to signal a pause in plans to raise interest rates. Continued anemic foreign growth coupled with uncertainty surrounding the United Kingdom’s looming vote on its place within the European Union put additional downward pressure on the U.S. economy. Next month’s job report will be a critical piece of data in determining if this is an anomaly or a trend.
REPORT AND RELEASE EVENT SHOW MEDI-CAL’S IMPACT ON CALIFORNIA ECONOMY
On Friday June 3rd, the Bay Area Council Economic Institute released a major report at an event hosted by Blue Shield of California that documented the massive positive impact the state’s Medi-Cal program has on the economy. The analysis shows that this program is now the source of health coverage for over 13 million people in the state, 6.4 million of whom are working Californians or their children. According to the report, Medi-Cal coverage adds $1.7 billion to the state’s economy by avoiding lost personal income from illness as a result of being uninsured.
California Health and Human Services Secretary Diana Dooley was on hand and praised the report as “essential reading.” Dooley, who also chairs the state’s Affordable Care Act marketplace, Covered California, discussed with the members of the Bay Area Council’s Healthcare Committee how we can build on recent innovations to create a more consumer-centric healthcare system of competing stable networks and work together across sectors to improve the health of the people of our state through initiatives such as Let’s Get Healthy California.
FEATURED CHART: BAY AREA ECONOMIC PROFILE
This month’s featured chart comes from Promise and Perils of an Accelerated Economy the ninth Bay Area Economic Profile released by the Institute. Bay Area GDP growth has outpaced that of the US in every quarter since 2010, with a compounded annual growth rate of 3.1%, more than double that of a group of peer regions, including New York, Los Angeles, Austin, Boston, Seattle, and San Diego. California’s Department of Finance announced last week that the state surpassed France to become the sixth largest economy in the world, a statistic that would be unthinkable without the Bay Area economy.
UPCOMING RELEASE: NORTHERN CALIFORNIA MEGAREGION
The Northern California Megaregion is a critical geography for coordinated economic and human capital development, and for planning and enabling connectivity through transportation networks. The Bay Area Council Economic Institute’s new report explores the many rail, road, labor, goods movement, and innovation connections that currently exist between the Bay Area, the Sacramento Area, the Monterey Bay Area, and the Northern San Joaquin Valley.
Please join us for this exciting report launch which will include welcome remarks from Dr. Maria Pallavicini, Provost, University of the Pacific, a summary of report fundings from the Institute, and presentations from regional rail agencies on their future plans for expansion. Following these presentations, a panel of representatives from economic development organizations, public agencies and universities from around the megaregion will discuss future opportunities for greater collaboration in planning and policymaking.
Header image by Jeff Turner. Sacramento Set. Used under Creative Commons 2.0 Generic.
Today the California Employment Development Department (EDD) released job estimates for May 2016. Here are the highlights
Bay Area Job Growth Slows but Continues to Outpace the State and Nation
The region added 113,800 jobs between May 2015 and 2016 for a gain of 3.1% compared to 1.7% for the nation and 2.8% for California. The pace of growth has slowed from the mid-summer 2015 highs although year over year gains remain robust. The state jobs report showed a gain of 15,200 jobs in May compared to 38,000 for the nation-an unusually high share of U.S. growth. For April and May the state added 85,200 jobs or more than 50% of the national gains.
The job gains continue to reduce unemployment rates while the labor force continues to add workers. Unemployment rate declines were seen in all areas.
Year over year job growth has slowed slightly in the region though remaining above 3% in region and above the national average in all metro areas.
While the year over year job gains have declined slightly from mid 2015 peaks, they remain in very healthy territory with no signs of a significant loss of competitive advantage. Job growth rates in 2016 are likely to be the peak going forward as baby boomer retirements are slowing labor force growth.
The state job and unemployment news was also good showing that the recovery has spread beyond the Bay Area. The California unemployment rate declined to 5.2% the lowest since May 2007 and close now to the national 4.7% rate. The number of unemployed residents have been cut from more than 2 million to just under 1 million during the recovery.
The continuing job growth now that unemployment rates have fallen will bring new residents to the region as will the growing need to replace retiring workers.
New state Department of Finance population estimates show an increase of 78,300 residents between January 1, 2015 and 2016—once again far outpacing the gain in housing units. Both the region and Santa Clara County have been the population growth leaders in California since 2011.
All of these trends underscore the importance of policies to increase housing and make sure that housing and transportation challenges do not undermine the region’s still vibrant economic competitiveness.
These economic updates are authored by Stephen Levy, Director of the Center for Continuing Study of the California Economy, and a member of the Bay Area Council Economic Institute board.
Today the California Employment Development Department (EDD) released job estimates for April 2016. Here are the highlights
Bay Area Job Growth Continues to Outpace the State and Nation
The region added 126,500 jobs between April 2015 and 2016 for a gain of 3.4% compared to 1.9% for the nation and 2.8% for California. The pace of growth s slowed slightly from the mid-summer 2015 highs although year over year gains remain robust. The state jobs report showed a gain of 59,600 jobs in April compared to 160,000 for the nation-an unusually high share of U.S. growth.
The job gains continue to reduce unemployment rates while the labor force continues to add workers. Unemployment rate declines were seen in all areas.
Year over year job growth has slowed slightly in the region though remaining above 3% in region and above the national average in all metro areas.
While the year over year job gains have declined slightly from mid 2015 peaks, they remain in very healthy territory with no signs of a significant slowdown.
The state job and unemployment news was also good showing that the recovery has spread beyond the Bay Area. The California unemployment rate declined to 5.3% the lowest since June 2007 and close now to the national 5.0% rate. The number of unemployed residents have been cut from more than 2 million to just over 1 million during the recovery.
These economic updates are authored by Stephen Levy, Director of the Center for Continuing Study of the California Economy, and a member of the Bay Area Council Economic Institute board.
Published April 18, 2016 by Parag Khanna Originally appearing in Tech Insider
When the United Nations was founded in 1945, it had just 51 members; today it has nearly 200. By 2050 the UN could well have 250 members….or perhaps it will be replaced by something more appropriate to the times. We are entering a phase of history in which cities are superseding countries in importance — and a “United Cities” might be more useful than a United Nations.
These maps, designed exclusively for publication in my new book “Connectography,” illustrate how cities have become the organizing units of the 21st century global system.
Mega-Cities as the New Economic Geography
Cities have become the world’s dominant economic and demographic clusters. This map shows the distribution of the entire world’s population, with yellow representing the most dense areas. Surprisingly, these zones are not where you find the dashed ovals, which represent the world’s burgeoning mega-cities. In fact,mega-cities are growing so large that the urban surface area is expected to triple by 2050.
Mega-cities are also growing in their economic gravity. In emerging markets like Brazil, Turkey, Russia and Indonesia, the leading commercial hub or financial center accounts for at least one-third or more of national GDP. In the UK, London accounts for almost half Britain’s GDP. And in the US, the Boston-New York-Washington corridor and greater Los Angeles together add up to about one-third of America’s GDP.
This map of the world’s three dozen mega-cities therefore tells us much more about where the world’s people and money are than conventional maps of 200 separate countries.
The Rise of Diplomacity
The way cities relate to each other may ultimately have more impact on the world than what happens at the United Nations. In a world defined by crowded mega-cities, mankind has no higher priority than sustainable urbanization. Cities are leading the way in the solutions to the problems for which they are ground zero.
The Paris Climate Agreement doesn’t have enough teeth to actually reduce greenhouse emissions. What really brings down the carbon intensity of our economies is cities using technologies such as carbon-neutral building design, carbon capture and storage, solar power generation, electric car sharing systems, and so forth. This is what the C-40 Climate Initiative among 40 of the world’s largest and most industrial cities aims to do. International agreements won’t have much of a dent in reality without the participation of cities.
This map identifies the cities participating in just a small number of the more than 200 inter-city learning networks that are actively sharing best practices in every arena, from climate and safety to education and social inclusion. This is about the same number as inter-governmental organizations. Soon enough, “diplomacity”— diplomacy among cities— will supersede traditional diplomacy among states in importance.
Global Hubs Become Demographic Melting Pots
As migration controls return to European borders and populist movement gain ground in politics, it’s worth remembering that great global cities are open, diverse, and inclusive.
From Los Angeles and New York to London and Singapore, leading cities around the world are witnessing a growing — not shrinking — percentage of their dynamic and industrious populations coming from abroad. No city in the world has a higher foreign-born population than Dubai, where almost all residents come from India and Pakistan (as well as elsewhere in Europe and Africa).
These melting pot cities are the epicenters of a new kind of loyalty to cities over countries, which Canadian scholar Daniel Bell calls “civicism.” We should strive to have more such global centers of diversity and tolerance in the years ahead.
Special Economic Zones Grow Around the World
A half-century ago there were only a handful of Special Economic Zones (SEZs) — designated areas with more free-market oriented economic regulations — in poor countries like Mauritius and the Dominican Republic to help boost their agriculture and textile industries. Today there are more than 3500 such zones, integral to almost every country’s strategy in attracting investment and technology, strengthening productivity and skills, and boosting exports through better infrastructure and trade agreements.
Since China declared its first SEZ at Shenzhen in 1979, such zones have grown to account for a quarter of its GDP and most of its exports. Across Asia, upstart manufacturing powerhouses like Vietnam are using the same model to rapidly climb the value chain —even stealing investment away from China.
America too has its own SEZs: The Port of Corpus Christi, Texas, and Tampa, Florida, have been licensed as Foreign Trade Zone (FTZs) since the 1980s, using their tax-free logistics facilities to attract businesses focused on commodities and manufacturing exports through the expanding Panama Canal.
China: Empire of Megacities
One final reason why the world is coming to be dominated by mega-cities: because China is. Despite millennia of cultivated provincial and linguistic boundaries, China today is reorganizing itself around approximately two dozen megacity clusters with populations as large as 100 million or more. Each megacity is internally integrated through dense transportation networks, while high-speed rail connects the entire country.
India is also heavily investing in harnessing its rapidly urbanizing population through greater infrastructure investment, meaning its true map may also one day resemble a collection of big city hubs rather than dozens of weak and fragmented provinces.
This is far from being only an Asian trend. Italy is reforming its political and administrative structures in order to crystallize 14 “Metropolitan Regions” around hubs such as Rome, Turin and Milan, each of which is more viable than its lethargic provinces. In Great Britain, a “Northern Powerhouse” mega-urban region is emerging, stretching from Leeds to Liverpool, and eventually giving the UK a third economic anchor besides London and Scotland.
America should wake up to a world of hyper-competitive and connected cities. Indeed, the US should think seriously about how to transform itself into a “United City-States of America.”
Parag Khanna is a CNN Global Contributor and Senior Fellow at the Lee Kuan Yew School of Public Policy at the National University of Singapore. This article is adapted from his forthcoming book “Connectography: Mapping the Future of Global Civilization,” to be released on April 19 from Penguin Random House.
Today the California Employment Development Department (EDD) released job estimates for March 2016. Here are the highlights:
Bay Area Job Growth Continues to Outpace the State and Nation
The region added 129,000 jobs between March 2015 and 2016 for a gain of 3.4% compared to 2.0% for the nation and 2.6% for California. The pace of growth has slowed slightly from the mid-summer 2015 highs although year over year gains remain robust. The state jobs report showed a gain of only 4,200 jobs in March compared to 215,000 for the nation and will likely be revised upward next month.
The job gains continue to reduce unemployment rates while the labor force continues to add workers. Unemployment declines were seen in all metro areas.
Year over year job growth slowed slightly in all three of the regions large metro areas though remaining above 3% in the San Francisco and San Jose metro areas and above the national average in all metro areas.
The state job and unemployment news was also good showing that the recovery has spread beyond the Bay Area. The California unemployment rate declined to 5.4% the lowest since July 2007 and close now to the national 5.0% rate.
The continuing job growth now that unemployment rates have fallen will bring new residents to the region as will the growing need to replace retiring workers. All of these trends underscore the importance of policies to increase housing and make sure that housing and transportation challenges do not undermine the region’s still vibrant economic competitiveness.
These economic updates are authored by Stephen Levy, Director of the Center for Continuing Study of the California Economy, and a member of the Bay Area Council Economic Institute board.
(This piece by Dr. Micah Weinberg originally appeared on March 23, 2016 in the Oakland Tribune.)
The communities of Oakland must start fighting alongside each other rather than against each other to address the housing emergency that is affecting everyone in the Bay Area.
Activists shut down a March 18 Oakland Chamber of Commerce meeting focused on the opportunity to build more housing in the city. The protesters are motivated by real suffering of far too many people whose lives have been upended by eviction and whose livelihoods have been compromised by rising regional poverty levels even in the midst of an economic boom for some.
The targets of their attacks, though, were people who are essential allies in our most critical shared regional task: building more housing for everyone.
It is now definitively established that the primary cause of rising poverty in the state is the cost of housing. Those costs are caused by undersupply, according to groups as diverse as Beacon Economics and the California Legislative Analyst’s Office.
It took us a generation to get into this hole due to disincentives to housing construction such as Proposition 13, which makes most housing a fiscal loser for cities, and the California Environmental Quality Act, which is often perversely used against the precise type of high-density, mixed-income infill developments we need to achieve our urgent climate and community development goals.
An adequate supply of housing cannot be built in a day but will be built faster if we work together and avoid the false and polarizing choice of affordable versus market-rate.
We need both, and building new market-rate housing takes pressure off existing supply that serves residents from a wide range of incomes.
Recent evidence from places like Seattle and across the bay in San Francisco suggests that concerted efforts to speed housing construction of all types are starting to pay off with some softening in rents.
Still, it’s not coming fast enough to help everyone. And unfortunately, many proposed solutions — including most versions of rent control — threaten to worsen the problem of undersupply.
We need thoughtful short-term policies that address the current emergency, particularly for lower-income people, while not stifling new housing now and in the future.
Mayor Libby Schaff and the Oakland City Council have taken some steps in this direction, setting an ambitious goal for housing construction. A proposal to layer on more fees, however, risks turning those goals into empty promises.
More can be done to streamline and reduce the cost of the housing approval process, which adds tens of thousands of dollars to the price of a new unit before a single hammer has even been lifted.
It’s important in all of this to remember that Oakland is not alone. The housing problem is a regional problem that needs regional coordination and regional solutions, with action from all 101 Bay Area cities from the Peninsula to Marin County.
The Bay Area Council Economic Institute last fall issued a Regional Economic Strategy that advanced a variety of innovative policies focused on leveraging the region’s collective strength to meet our housing needs and put pressure on all cities to meet their obligations.
The humorist Will Rogers once said that if you find yourself in a hole, stop digging. For Oakland and the Bay Area, to get out of the hole we’re in we must keep digging … foundations for new housing.
Today the California Employment Development Department (EDD) released job estimates for February 2016. Here are the highlights:
Bay Area Job Growth Continues to Outpace the State and Nation
The region added 129,000 jobs between February 2015 and 2016 for a gain of 3.6% compared to 1.9% for the nation and 2.8% for California. The pace of growth has slowed slightly from the mid-summer 2015 highs although year over year gains remain above levels in the first half of 2015.
The job gains continue to reduce unemployment rates while the labor force continues to add workers. Unemployment declines were seen in all counties.
Year over year job growth slowed slightly in all three of the regions large metro areas though remaining above 3% in the San Francisco and San Jose metro areas and close to 3% in the East Bay.
The state job and unemployment news was also good showing that the recovery has spread beyond the Bay Area. California added 39,900 jobs and the unemployment rate declined to 5.5% the lowest since August 2007 and close now to the national 4.9% rate.
The continuing job growth now that unemployment rates have fallen will bring new residents to the region as will the growing need to replace retiring workers. All of these trends underscore the importance of policies to increase housing and make sure that housing and transportation challenges do not undermine the region’s still vibrant economic competitiveness.
These economic updates are authored by Stephen Levy, Director of the Center for Continuing Study of the California Economy, and a member of the Bay Area Council Economic Institute board.
Bay Area job growth continued strong in 2015 and the region has added more than 550,000 jobs since 2010.
Regional job growth has been led by technology with strong gains in health care and hospitality, mainly eating and drinking establishments.
The Bay Area jobs recovery is being led by Professional and Business Services, Educational and Health Care Services and Leisure and Hospitality with contributions from the Information and Construction sectors. Technology sectors dominate the growth in Information and Professional and Business Services while health care and eating and drinking establishments dominate the growth in the other two leading sectors.
It is worth noting that technology in the Bay Area is a very diverse sector with the names Apple, eBay, Facebook, Google, and LinkedIn bringing to mind a diverse set of goods and services. So technology in our region is unlike auto production in Detroit 40 years ago or oil and gas in North Dakota, Oklahoma and Texas today in terms of single sector risks.
The impact of the Internet is seen is the slow growth in retail trade and finance where more and more activities are done online. The recovery while very strong has left the farm, construction, manufacturing, wholesale trade, finance and government sectors with fewer jobs than in 2007 although many sectors are now in growth mode.
Some of the largest long-term transitions in industry structure are shown below. In 1990 there were more than two jobs in Finance for every job in the Information sector. Soon Information will pass Finance in job size, in part the result of innovations in the Information sector.
In 1990 there were more jobs in Manufacturing than in Professional and Business Services. In 2015 there were more than two jobs in Professional and Business Services for every Manufacturing job. It is important to note that while jobs have declined manufacturing output has increased as a result of very strong productivity gains and also to remember than manufacturing jobs in China and around the world are declining for the same reason.
Below we see another major transition in the region’s industry structure.
In 1990 there were more jobs in Retail Trade than in Educational and Health Services. Since then retail jobs have hardly changed while jobs Educational and Health Services (mainly in health care) have nearly doubled.
Most of these structural changes will continue. Some sectors will rebound to new highs, particularly construction if we build the needed housing and infrastructure, as well as government and wholesale trade jobs. But the manufacturing, retail and finance sectors will likely continue to see restrained if any job growth from productivity and changing ways we consumers and businesses do business.
These economic updates are authored by Stephen Levy, Director of the Center for Continuing Study of the California Economy, and a member of the Bay Area Council Economic Institute board.
Last week the California Employment Development Department (EDD) released revised job estimates for 2015 along with new data for January 2016. Here are the highlights:
The Bay Area Outpaced the State and Nation in Job Growth
Bay Area job growth for the year ending in January 2016 (3.7%) was nearly double the national growth rate.
Job gains were widespread among the region’s seven metro areas led by the San Rafael (Marin County), San Francisco and Napa metro areas but all Bay Area metros outpaced the nation by a wide margin in 2015.
The strong job growth brought unemployment rates down throughout the region, in some metro areas to below 4%. The regional unemployment rate fell a full percent from 5.0% in January 2015 to 4.0% in January 2016. During this period the labor force also grew bringing 50,900 residents into the workforce. The current low unemployment rates imply that the job growth for 2016 and 2017 forecast by UCLA in the January 2016 BACEI forecast conference will bring new workers into the region underscoring the need to increase the housing supply.
EDD also revised job estimates for 2015 and the region added about 15,000 more jobs than previously estimated.
The East Bay (Oakland metro area of Alameda and Contra Costa counties) added 31,500 jobs in the revised estimated nearly 50% more than the 21,300 job gain originally estimated. The Napa and Vallejo metro areas also had upward revisions signally that the region’s job growth is spreading beyond the San Francisco to San Jose corridor. The San Francisco metro area (SF and San Mateo counties) also had a large upward revision adding 47,300 jobs up from the original estimate of 37,800 jobs.
Job growth in the San Jose metro are (Santa Clara and San Benito counties) was revised down slightly to 42,600 jobs from 46,100.
Next week’s update will examine job growth in 2015 by major industry as well as include new job and unemployment estimates for February 2016.
These economic updates are authored by Stephen Levy, Director of the Center for Continuing Study of the California Economy, and a member of the Bay Area Council Economic Institute board.
“Thankfully next generation sequencing is so sensitive if you sequence the same fragment of DNA thousands and thousands of times, you will find that tumor’s specific DNA. And almost all of the cases in which we can do that the molecular alteration found in blood matches the molecular alteration that is found in the tumor. That is why people are starting to refer to this as ‘liquid biopsies'” –Garret Hampton
“Everybody’s virus was sequenced and then the relation between that sequence and the responsiveness to drugs was built, which then allowed to us to build regiments that had higher likelihood of success and then in a short period of time that disease was taken from a death sentence into a chronic disease. So this revolution in many respects is happening in the cancer arena right now. Now of course, cancer is more complex; it is a eukaryotic cell, it has a genome that’s roughly 1,500 to 2,000 times the size of the HIV virus, but all of the same things are going on.” –Michael Varney
“It isn’t all about the “omics” in precision medicine. Unless you have the clinical context that sits around these samples, then it’s actually of very limited value. What I mean by that is you need to be able to integrate the genomic data with the EMR data with the claims data with the self-reported patient data remote patient monitoring wearables [and] images.” –Jonathan Sheldon
“I’m delighted that we have had a huge success in breast cancer and have moved to colon cancer and prostate cancer. We really just have to do better, though, before I would say, ‘we are really committed to precision medicine’ because the map I just outlined wouldn’t suggest we are putting our money where our mouth is as a country.” –Kimberly Popovits
“We know what we pay for, but we don’t necessarily know what is happeing when the diagnosis happens, when the decision happens. So I can’t necessarily go and tie a payment [to value] although I would potentially love to do that in the right circumstances with the right dataset.” –Paul Markovich
“We need to optimize our SOPs at the beginning, we need to have transparency with our oncologists, and our pathologists, and the diagnostics labs all of this needs to be done, which is improvement upstream and then when you get the result you get a result that has many mutations, but how does that affect what your patient needs and how do you provide that information.” –Manoja Lecamwasam, PhD
“For precision medicine we are thinking beyond cancer, really thinking about the opportunity with asthma, obesity, diabetes, really broadly. That ends up bringing more types of data that we need to be thinking about interoperability.” — Dr. Elizabeth Baca
“The problem with precision medicine and sequencing a patient that has often been leveled at us is that you can’t do it fast. Are you going to sequence them and give me the results a month later? This is an ICU case, we need it now and we showed in this case and others that we can do it in 48 hours or less.” –Joseph DeRisi
“If you were just diagnosed non-small cell lung cancer of the squamous variety five years ago your life expectancy was 12 to 14 months, but here it is four years later and she still has the disease, but she’s having good quality of life going on Caribbean vacations.” –Otis Brawley, MD
“One of the things we also got is a new definition of cancer and that is the importance of genomics. We are moving cancer from an 1850s definition that involved histology, to a 21st century definition that involves histology and genomics” –Otis Brawley, MD
On Monday January 18, 2016, Institute President Micah Weinberg appeared as a guest speaker on Inside Silicon Valley, a radio program presented by Joint Venture Silicon Valley hosted by Russell Hancock. During the program — which can be heard on the show’s iTunes Channel here — Micah discussed the pressing issues the Bay Area’s economy and infrastructure faces today and possible solutions outlined in the Economic Institute’s A Roadmap for Economic Resilience report published in November 2015.
Weinberg emphasizes that while the Bay Area has seen great economic success following the Great Recession, the region is not immune to a possible future economic downturn. The Bay Area currently faces relatively unique issues when compared to the rest of the nation; limited affordable housing, lack of a strong regional transportation infrastructure, and high living costs threaten the region’s continued success. Micah expresses his concern for the increasing levels of poverty, as prosperity is not equally shared among the region’s residents.
In order to solve these issues the Bay Area Council and the Bay Area Council Economic Institute propose that the governance of the Bay Area is treated as a locality rather than on a county-by-county and city-by-city basis, thus facilitating the implementation of solutions that benefit all residents as they navigate through the nine county Bay Area. By allowing decisions to be made on a broader platform while city and county agencies continue to oversee their implementation, the Bay Area will foreseeably be able to overcome future challenges. Additionally, education and workforce development are presented as key aspects in the improvement and stability of the economy, and as a consequence, people’s livelihoods.
In partnership with the March of Dimes Foundation the Bay Area Council Economic Institute unveiled the Cost of Prematurity to Business Estimator. Prematurity is the number one cause of death for newborns in the United States, with one out of every nine babies born premature each year in the United States at an average medical expense of twelve times that of a healthy baby. The event featured presentations from the Institute as well as from Dr. James Byrne, Chairman of Obstetrics and Gynecology at Santa Clara Medical Center; Tre’ McCalister, Principle at Mercer; and Dr. Maurice Druzin, Professor and Vice Chair of Obstetrics and Gynecology at Stanford University School of Medicine outlining steps businesses and individuals can take and on the progress leading medical researchers are making.
A number of our research reports laid strong foundations for current and future policy change through the Bay Area Council and its partners. The organization also brought on a new President, Micah Weinberg, PhD, who has been managing operations as Sean Randolph, PhD has stepped into the role of Senior Director after a successful 15-year run as President. 2015 also saw the launch of the Institute’s new digital presence with a new mobile- and tablet-enabled website which allows its reports to be read online, their key statistics and quote shared easily through social networks. Thanks to Wells Fargo, Kaiser Permanente, TMG Partners, and the North Bay Leadership Council for their support of this project.
Next year is teeing up as one in which the research, convening, and public education activities of the Institute will be even more vital as the challenges that we face are at a crisis point. Regional housing has never been more unaffordable and our transportation networks have never been more congested. To an extent, these are the externalities of the success of our region, but this economic success should embolden and empower us to tackle these perennial challenges with renewed vigor. In doing so, we must understand the facts, employ best practices and work together. The Economic Institute – with its board comprised of top leaders from all sectors of our region – remains uniquely positioned to play a leading role in this effort.
Major Projects, Major Impact
The Institute completed more than a dozen major projects during the year. These projects each include a report or reports as well as expert roundtables, large public events, and traditional and social media coverage. Four major projects in particular were among the most impactful and most clearly set up future work.
The Bay Area Regional Economic Strategy– The Metropolitan Transportation Commission funded the Institute to provide input from business and civic leaders that would add a significant focus on sustained economic growth to regional planning. Ultimately this project resulted in a “Roadmap for Economic Resilience” that was much broader in scope and will serve as the basis for advocacy by BAC and its partners for years to come. This report received a great deal of attention in the press, and many state legislators have contacted us to beginning putting its recommendation into bill form.
21st Century Infrastructure– PG&E and AT&T were among the supporters of this project which comprehensively laid out the need for better communications and energy infrastructure in the region as well as plans to better fund and regulate these public goods. The report laid the groundwork for significant policy successes including on AB57 which improved the permitting process for new cellphone towers. Tom Doughty, Director of State Regulatory Strategy for Cal ISO, called it the best interest-group funded report he had ever read. This was one of many examples of successful collaboration between the policy and research teams at the Institute, in which we leveraged our broad network of corporate, public, non-profit and academic leaders to produce a series of civic-minded recommendations to improve the economy and quality of life in the region.
Surviving the Storm –Though California continued to experience one of its worst droughts of all time, an equal threat to our region is presented by a major storm event for which the Bay Area is overdue. In fact, the long-time drought increases the damage such a storm would cause. In addition to the human toll, the Institute estimated that a major storm event would cause $10 billion in economic damage to the Bay Area, an amount that rivals that caused by the Loma Prieta earthquake in 1989.
Tri-Valley Rising– The Tri-Valley is an integral component of the Bay Area economy. With its robust research and development infrastructure and its growing entrepreneurial environment, it is no longer just a nice place to live—it has become a vital node in the Bay Area innovation system. The more connected the Bay Area population is with the multiple job centers in the region, the more flexible the region’s economy can be in connecting skilled workers with appropriate jobs.
Thought Leadership on Many Critical Issues
We have many additional projects soon to be published or underway currently. This includes one looking at the “megaregion,” which includes Sacramento and the northern San Joaquin Valley. This area has many critical economic connections including the movement of goods and people, and there are megaregional issues – such as the improvement of transportation networks – for which we need to be planning. We are also following up on our successful report looking at the economic connections between the EU and California with one focused on cross-border entrepreneurship. We’ll also be issuing reports focusing on advanced manufacturing, the funding and efficiency of the state Medicaid program, the innovation occurring on University of California campuses, and the latest strategies and tools for impact investing.
Upcoming major events include our annual Regional Economic Forecast on January 15th, sponsored by Accenture and hosted by John Williams, our board member and the chair of the San Francisco Federal Reserve Bank. Board member Mayor Ed Lee will also be hosting the next meeting of the Board of Trustees of the Economic Institute at San Francisco City Hall on January 7th. This follows meetings hosted by Mayors Liccardo of San Jose and Schaaf of Oakland, also board members who are engaged with our work.
This tool was developed to provide a conservative estimate of the number of establishments (any physical location a firm is doing business at) and their employment of firms headquartered in the nine-county San Francisco-Silicon Valley Bay Area. Establishment and employment data were calculated using the National Establishment Time-Series (NETS) database. Supplemental data on wages were sourced from the Bureau of Labor Statistics’ Quarterly Census of Employment and Wages (QCEW), and economic impacts were modeled using the Bureau of Economic Analysis’ Regional Input-Output Modeling System (RIMS II).
All figures are for 2014, the latest year of NETS data available. The strictest definition of “headquarters” was applied, and therefore establishments and employment of subsidiary firms headquartered in the Bay Area – but with a parent company outside of the Bay Area – were excluded. Individual company names and data were suppressed as required by the NETS licensing agreement. Data on wages within Congressional Districts use corresponding statewide industry averages. Total impact figures include direct, indirect, and induced economic impacts as defined by the Bureau of Economic Analysis.
National Establishment Time-Series (NETS) Database
The NETS database provides an annual record of business dynamics within the U.S. economy. The database measures firm and establishment creation and destruction, employment creation and destruction, sales performance, mobility patterns, corporate affiliations, and more. The NETS Database is an annual snapshot (taken every January by Walls & Associates) of the full Dun & Bradstreet database that has followed over 58.8 million establishments between January 1990 and January 2014.1
The Brookings Institution, the Public Policy Institute of California, and others have used the NETS database in their research.
Quarterly Census of Employment and Wages (QCEW)
The QCEW program publishes a quarterly count of employment and wages reported by employers covering more than 95 percent of U.S. jobs available at the county, Metropolitan Statistical Area (MSA), state and national levels by detailed industry. QCEW produces a comprehensive tabulation of data on the number of establishments, monthly employment and quarterly wages for workers covered by State unemployment insurance (UI) laws and Federal workers covered by the Unemployment Compensation for Federal Employees (UCFE) program. These data are aggregated to many different levels, starting at the 6-digit NAICS industry level, to higher industry levels (NAICS industry groups, sectors, and supersectors), and to higher geographic levels (MSA, State, and national).2
Regional Input-Output Modeling System (RIMS II)
The RIMS II model is a regional economic model used by investors, planners, and elected officials to objectively assess the potential economic impacts of various projects. This model produces multipliers that are used in economic impact studies to estimate the total impact of a project on a region. RIMS II is based on an accounting framework called an input-output (I-O) table. For each industry, an I-O table shows the industrial distribution of inputs purchased and outputs sold. A typical I-O table in RIMS II is derived mainly from two data sources: the BEA’s national I-O table, which shows the input and output structure of nearly 500 U.S. industries, and the BEA’s regional economic accounts, which are used to adjust the national I-O table to show a region’s industrial structure and trading patterns. RIMS II is widely used in both the public and private sector.3
Notes
1. National Establishment Time-Series (NETS) Database: Database Description, Walls & Associates, 2017.
2. Quarterly Census of Employment and Wages Overview, Bureau of Labor Statistics, https://www.bls.gov/cew/cewover.htm . Accessed June 2017.
3. RIMS II, Bureau of Economic Analysis https://www.bea.gov/regional/rims/rimsii/. Accessed June 2017.
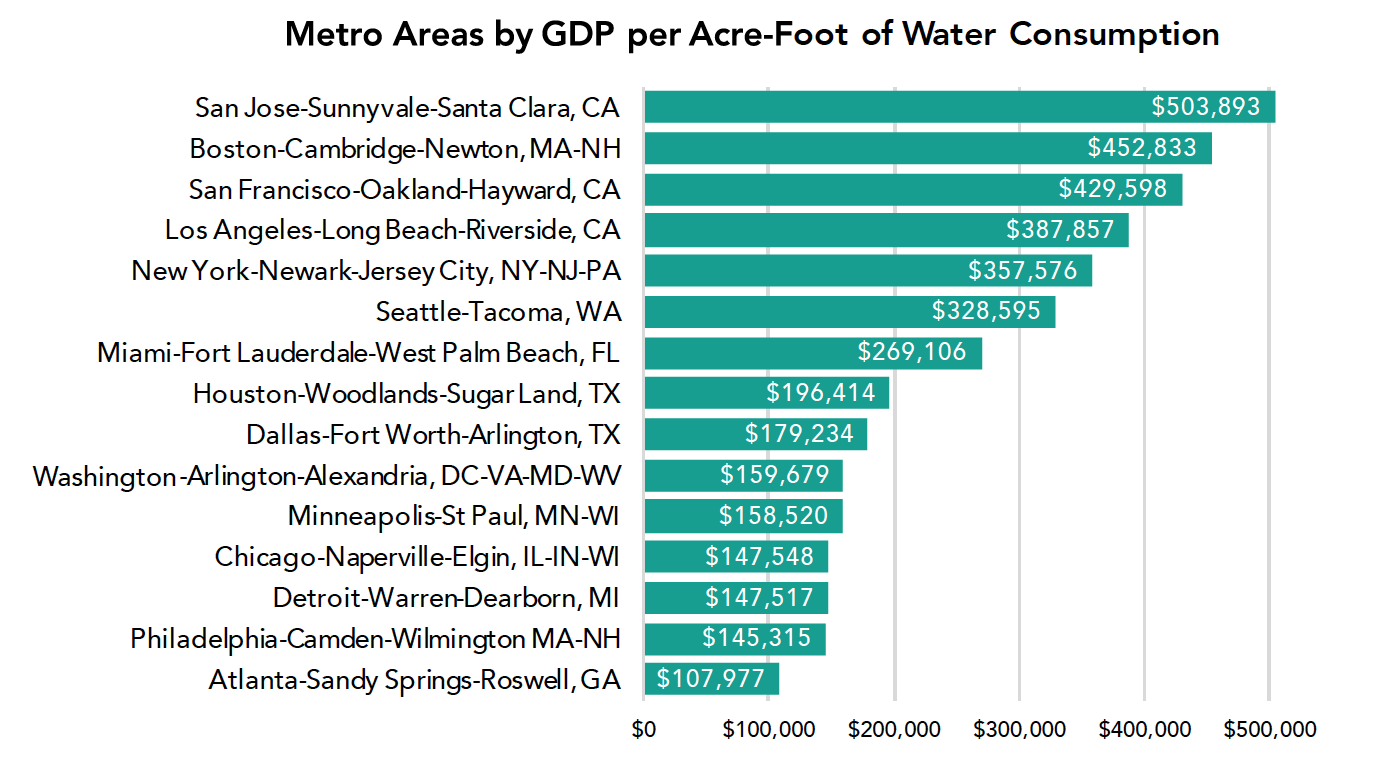
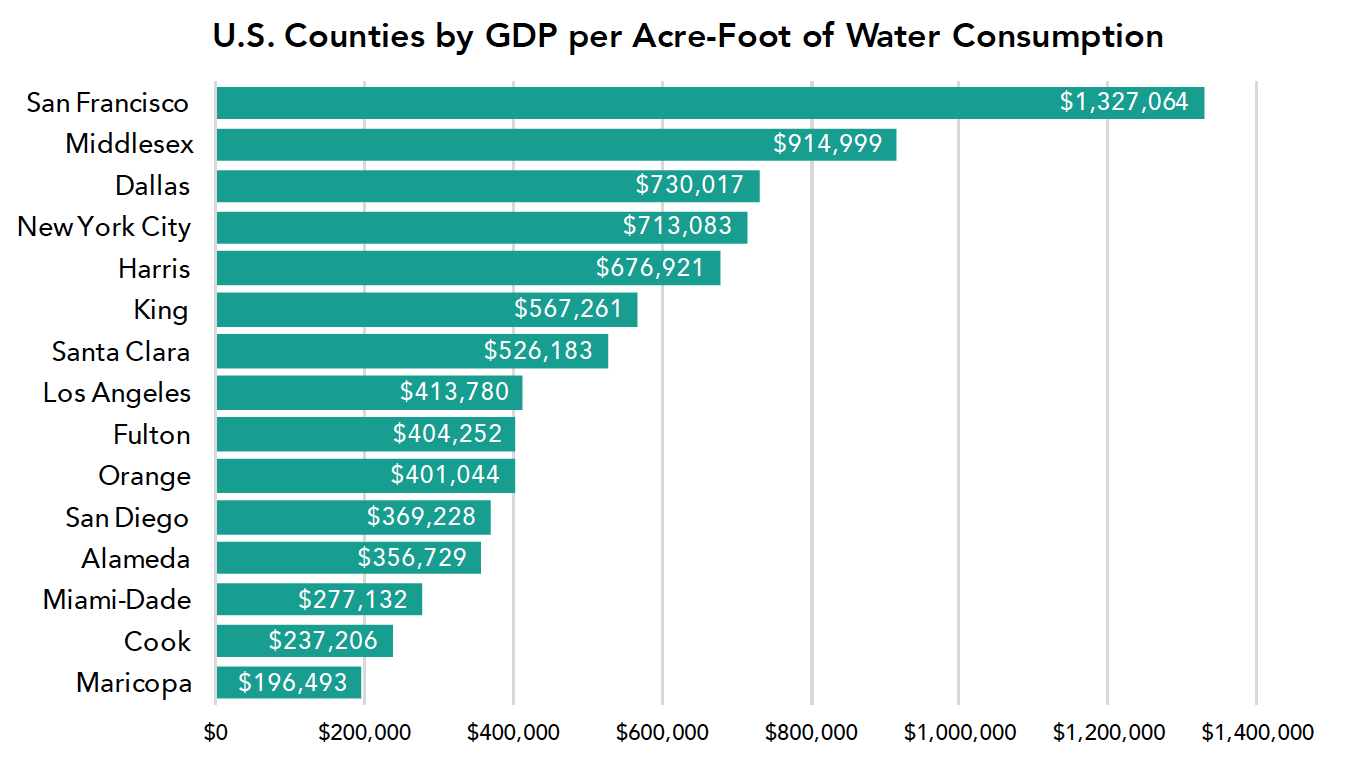

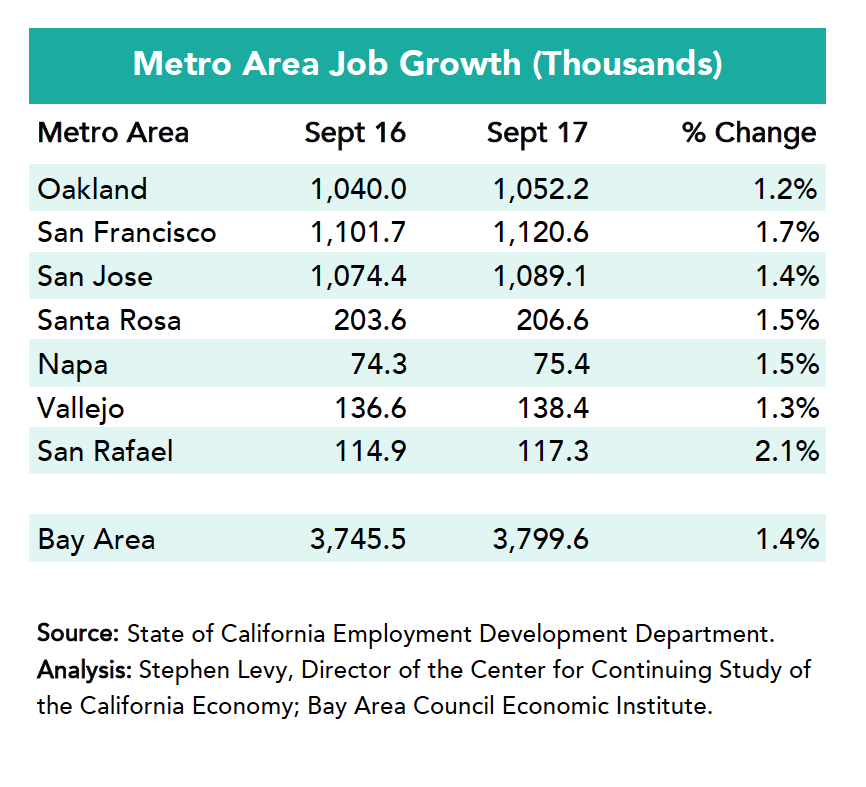
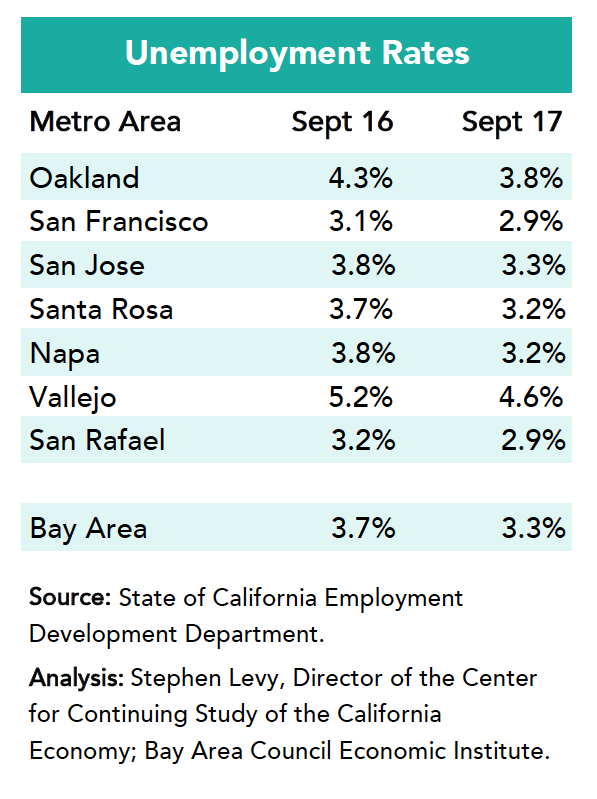
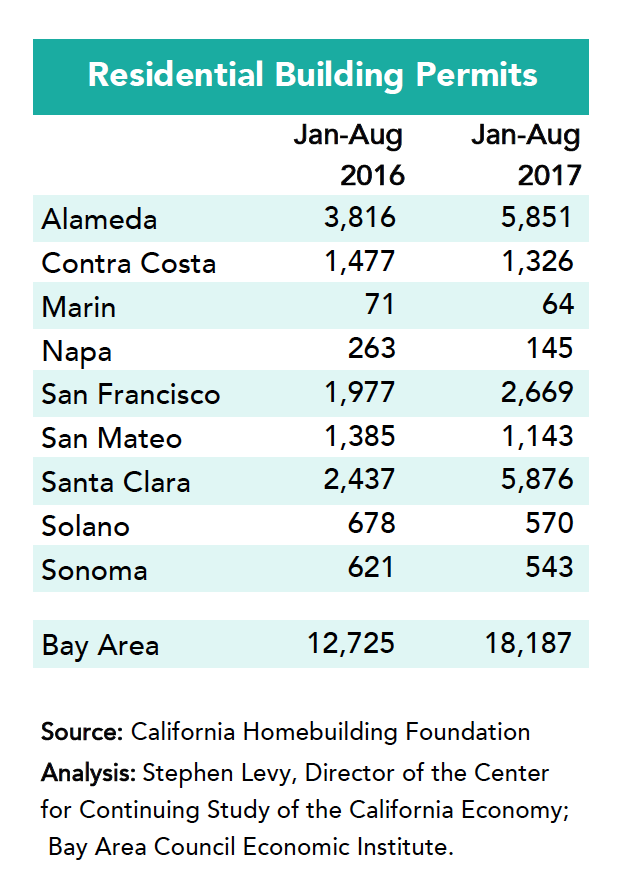
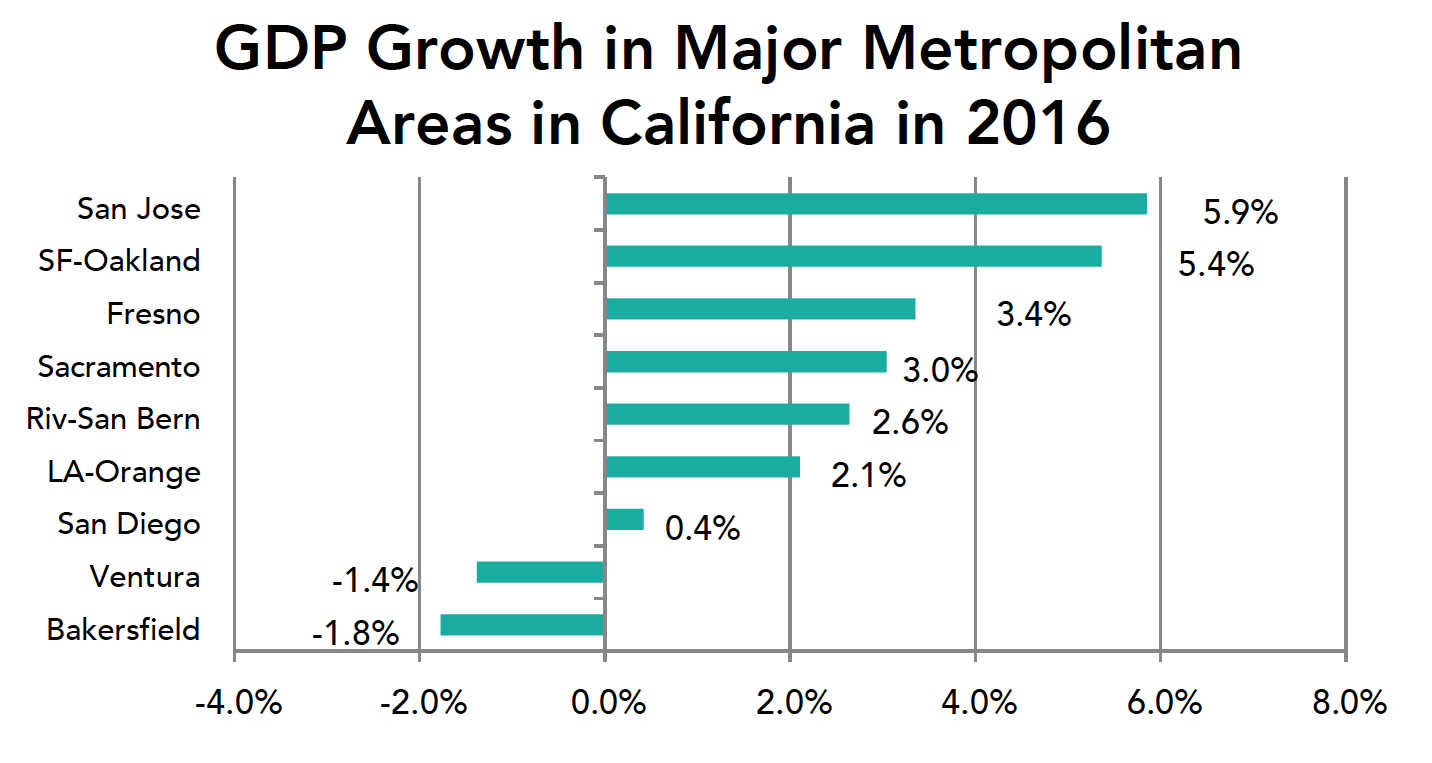
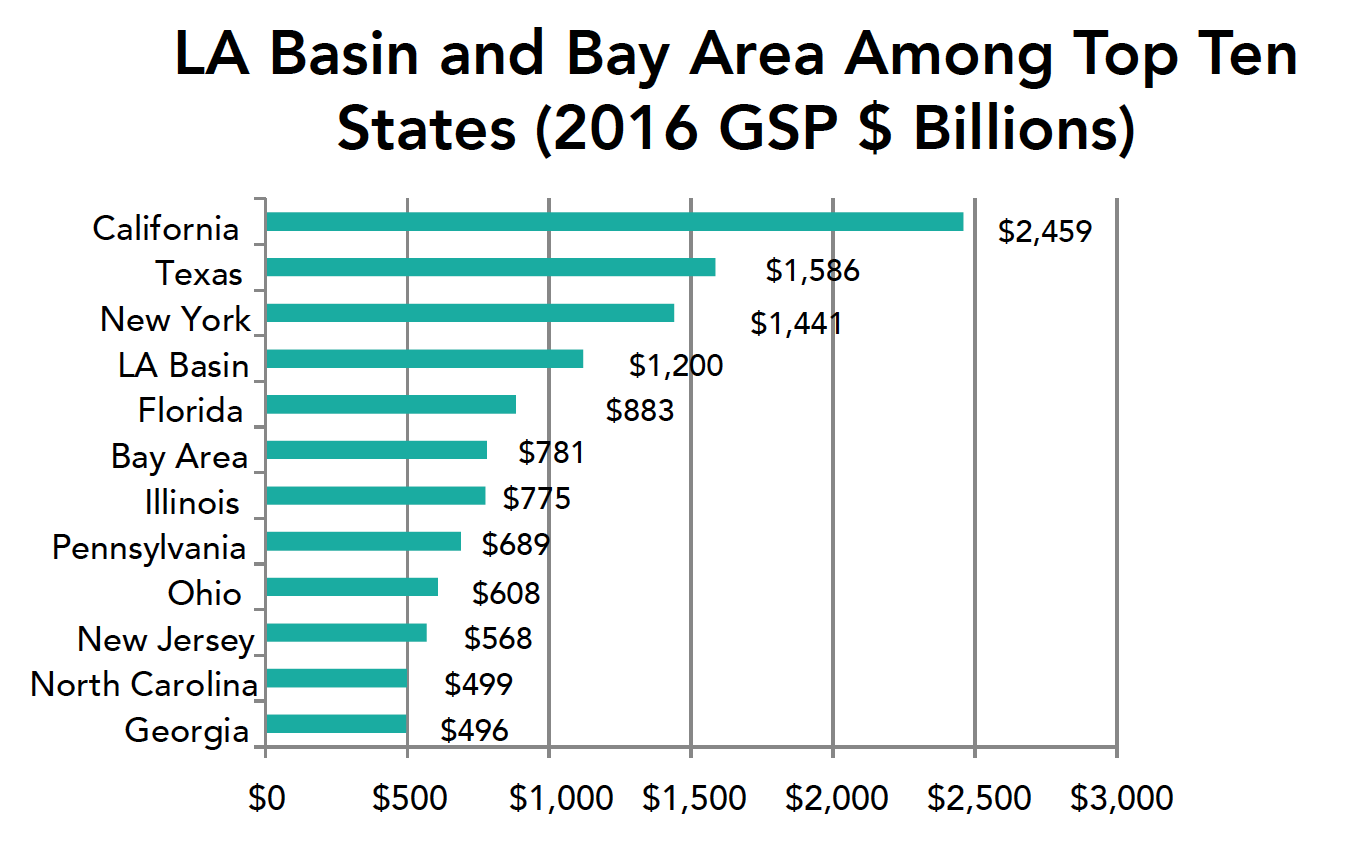
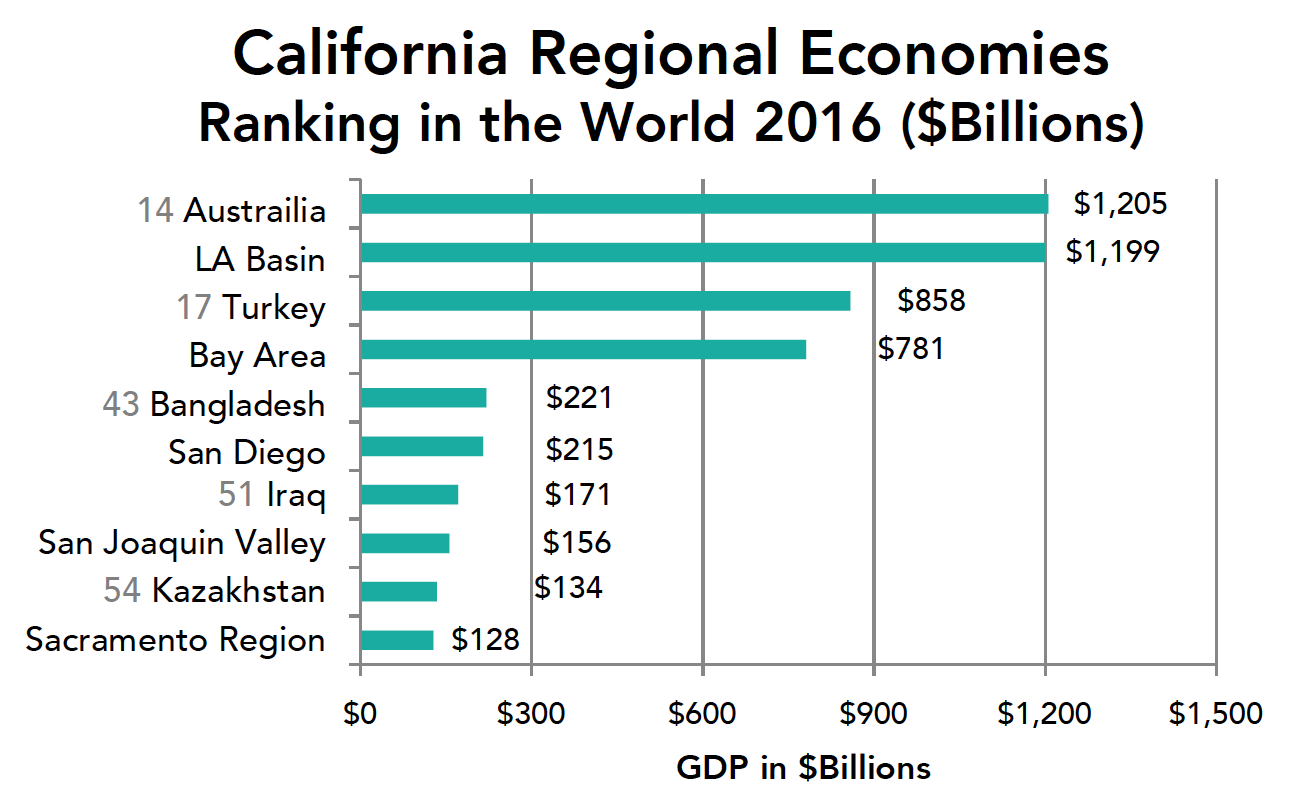
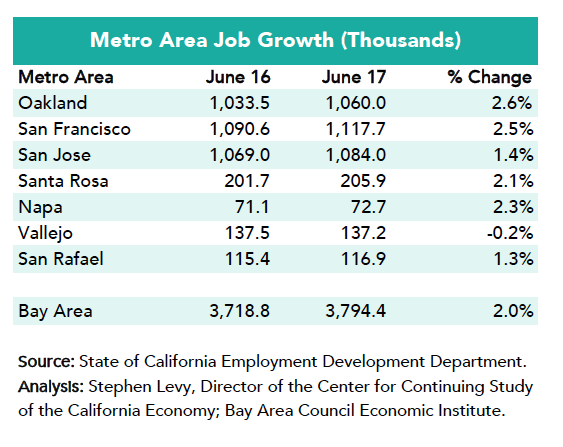
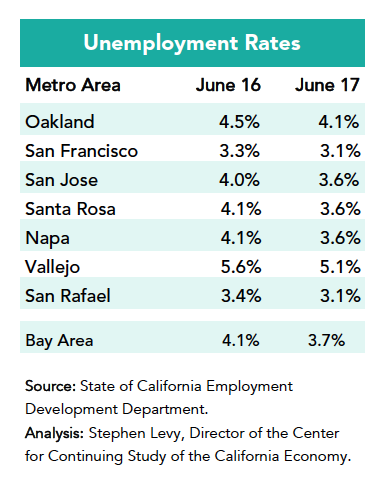
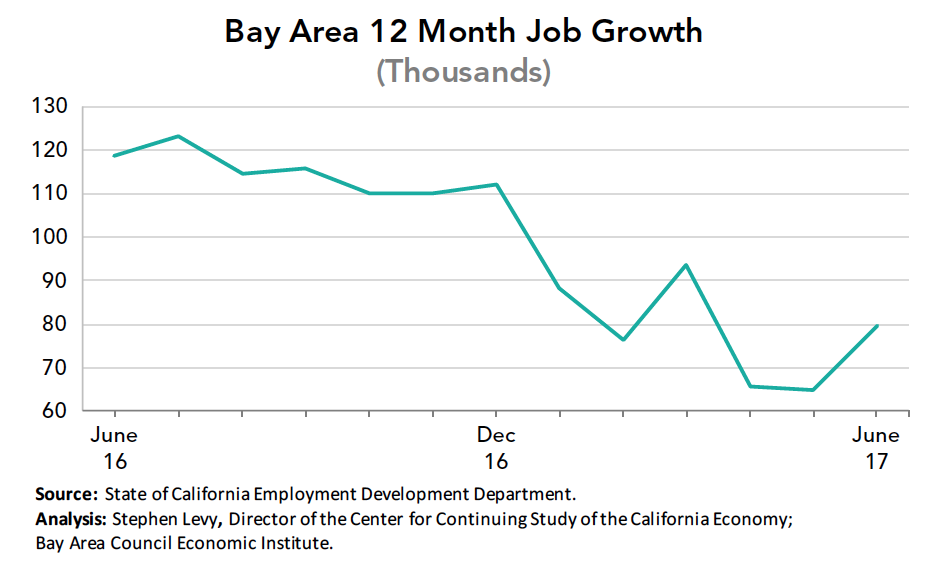
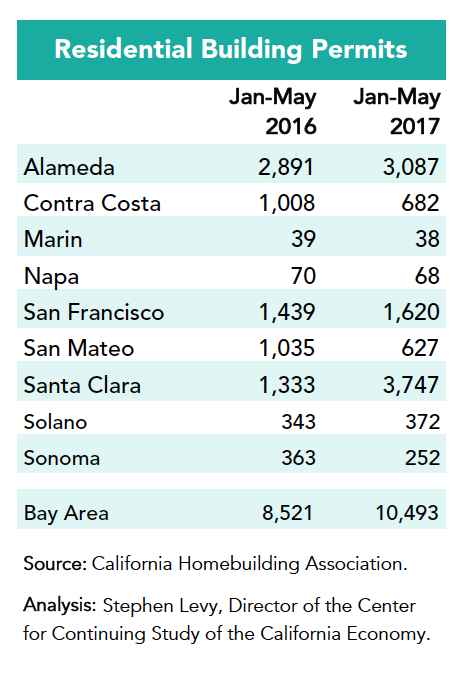
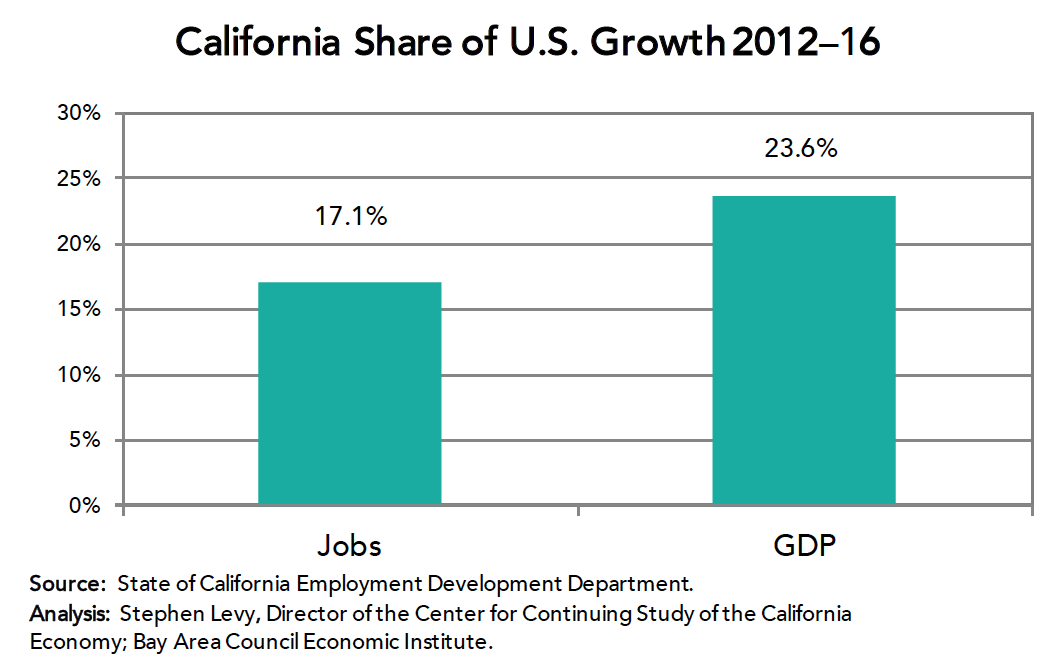
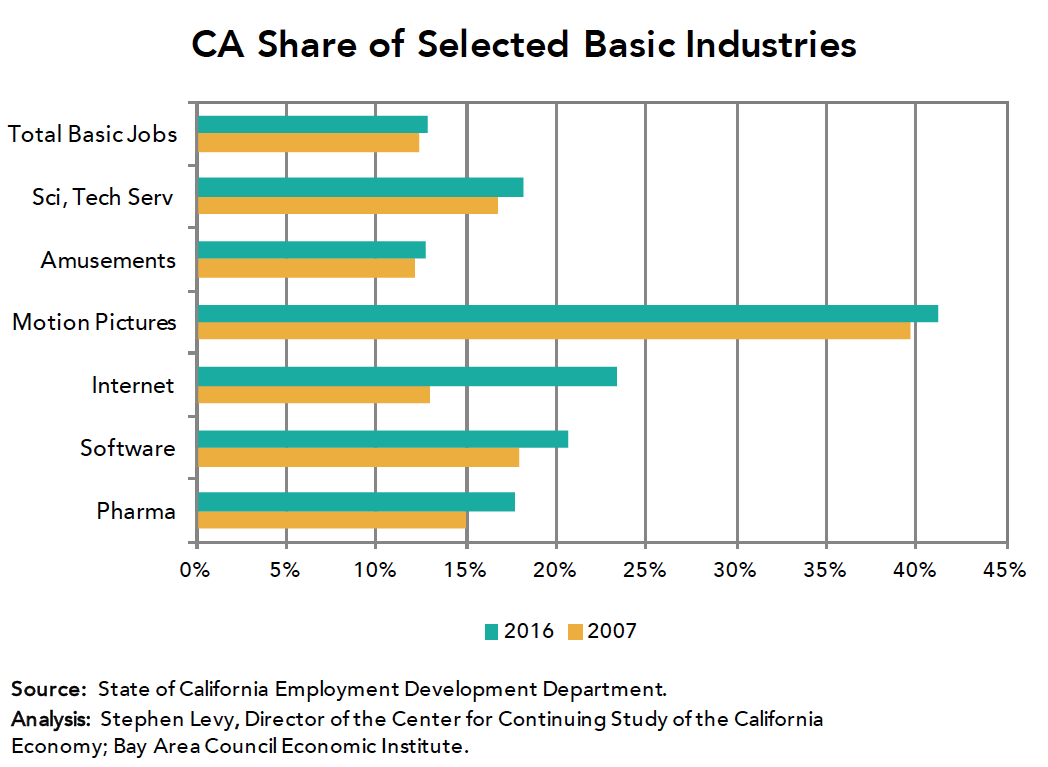
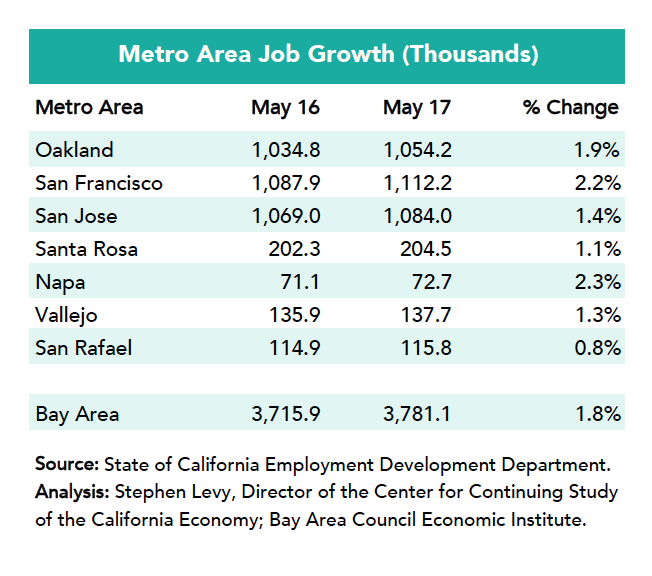
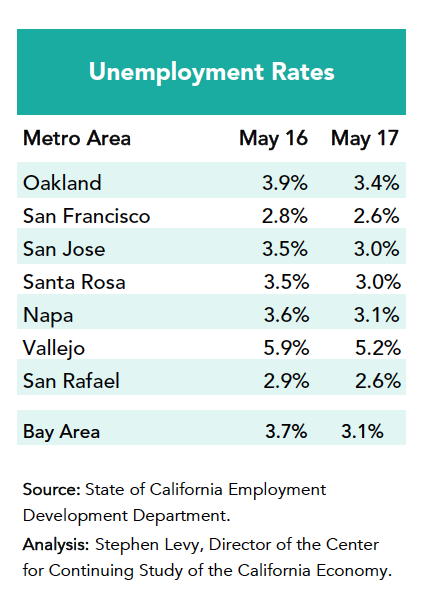
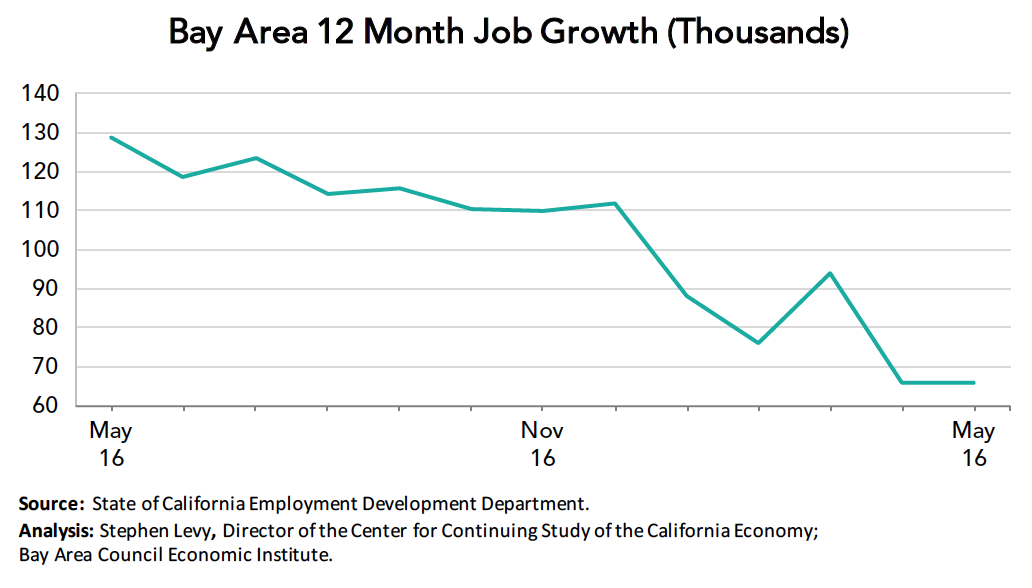
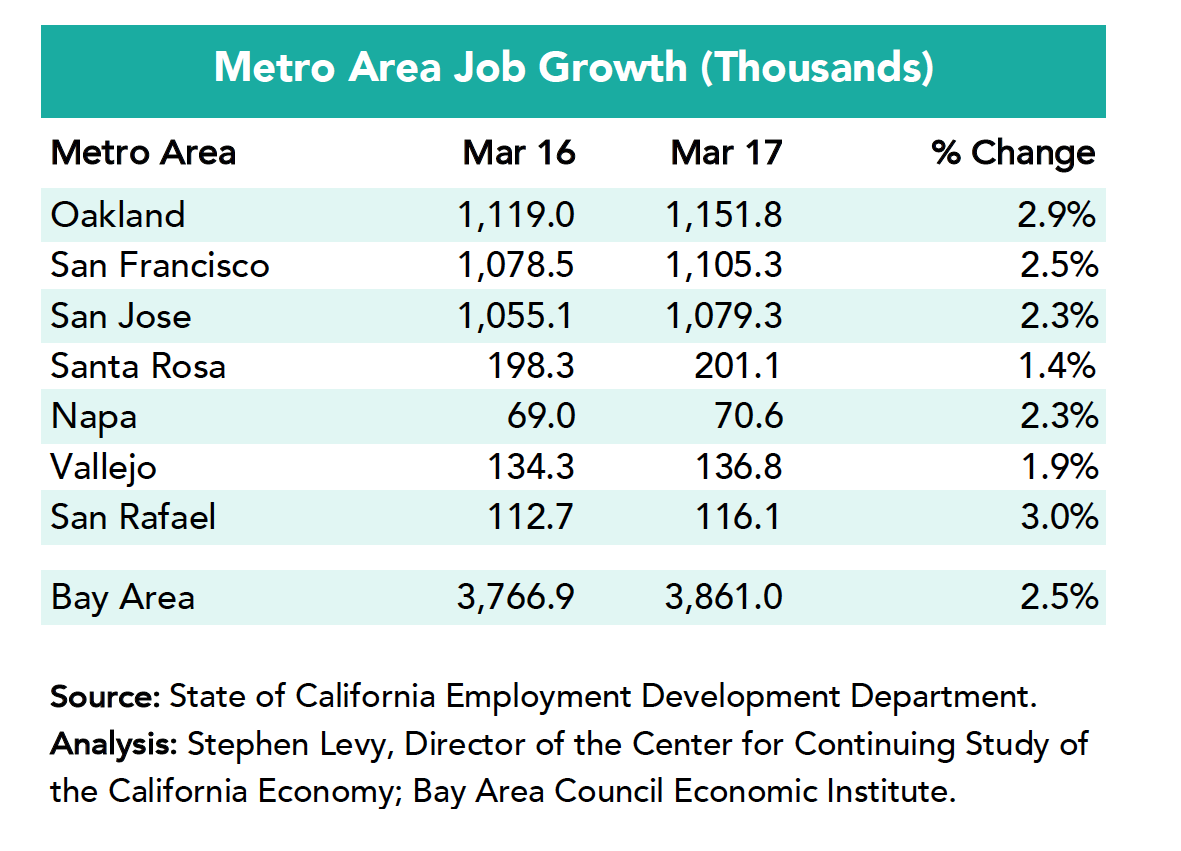
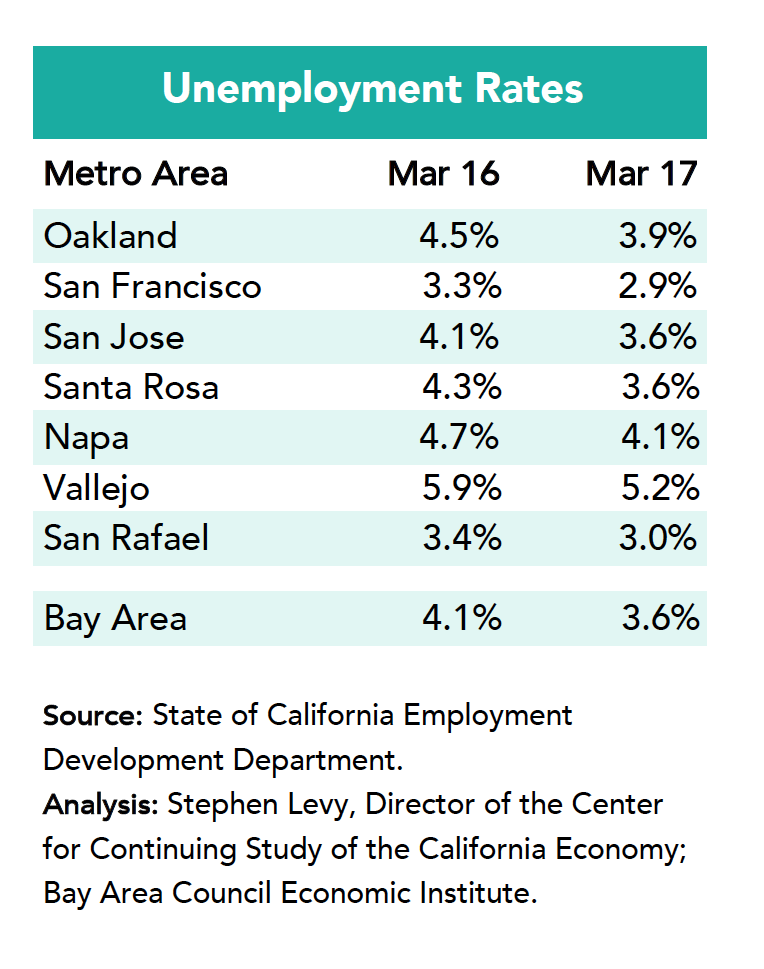
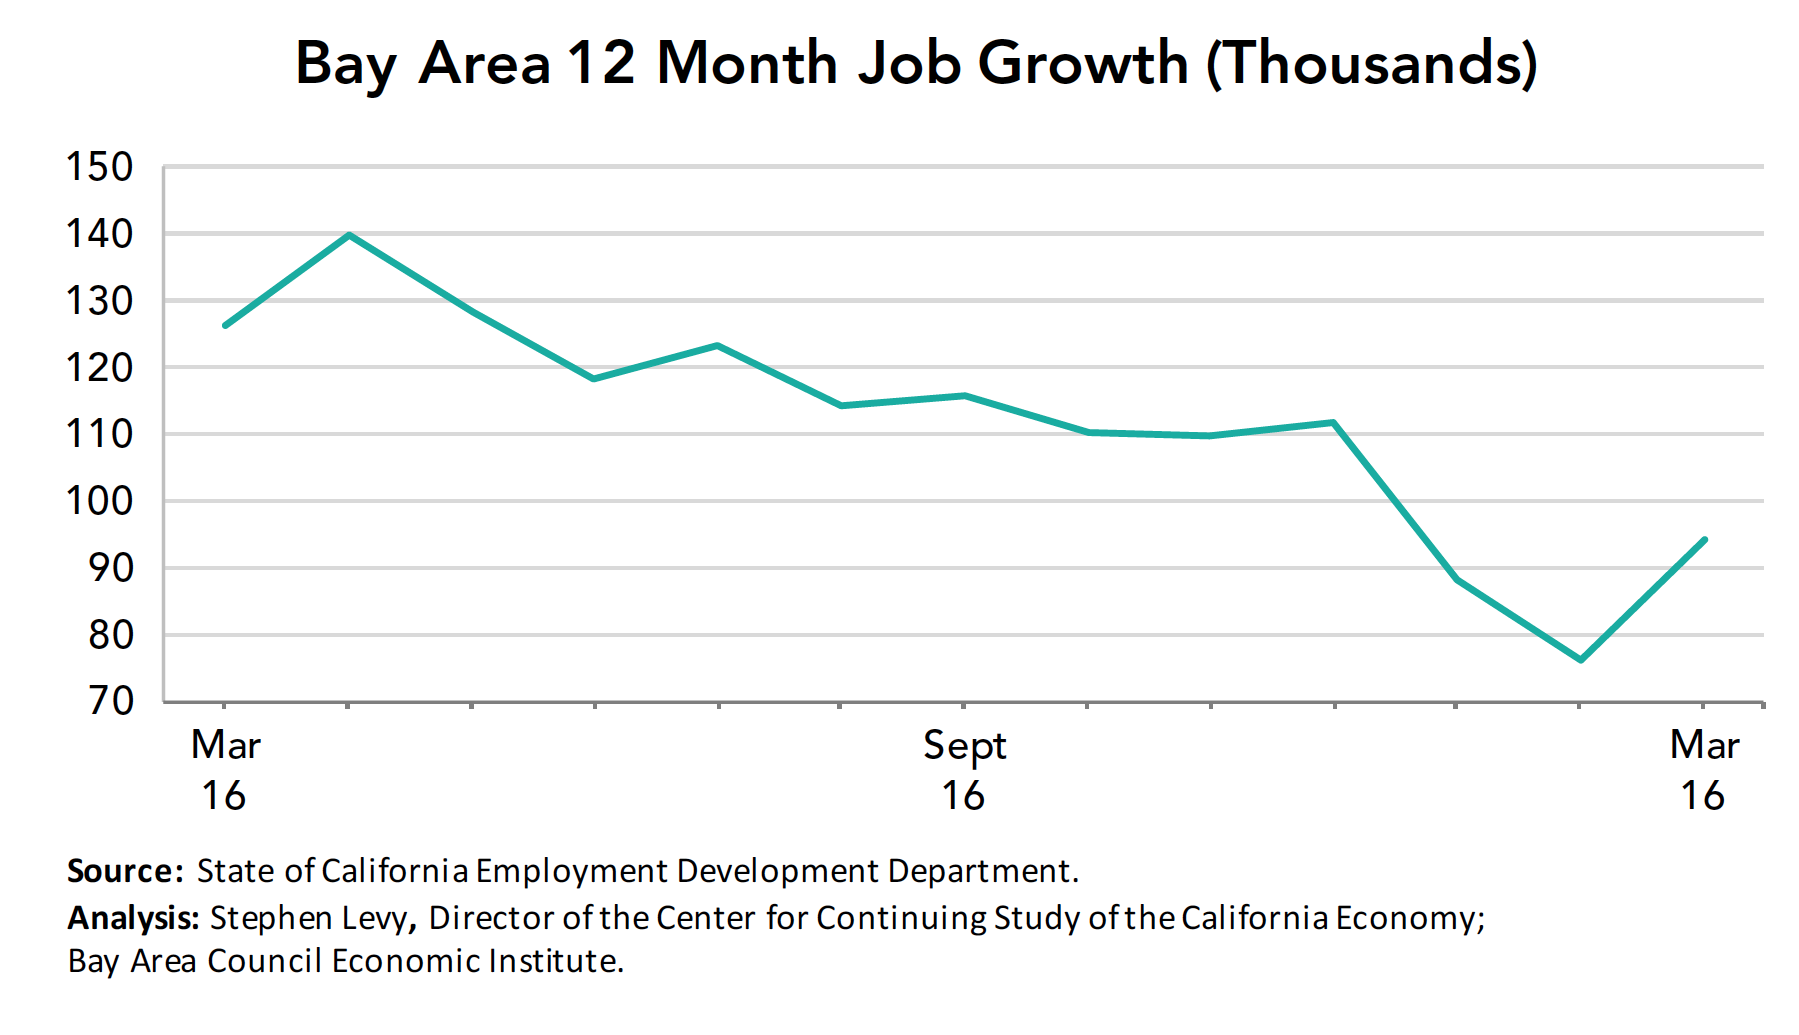
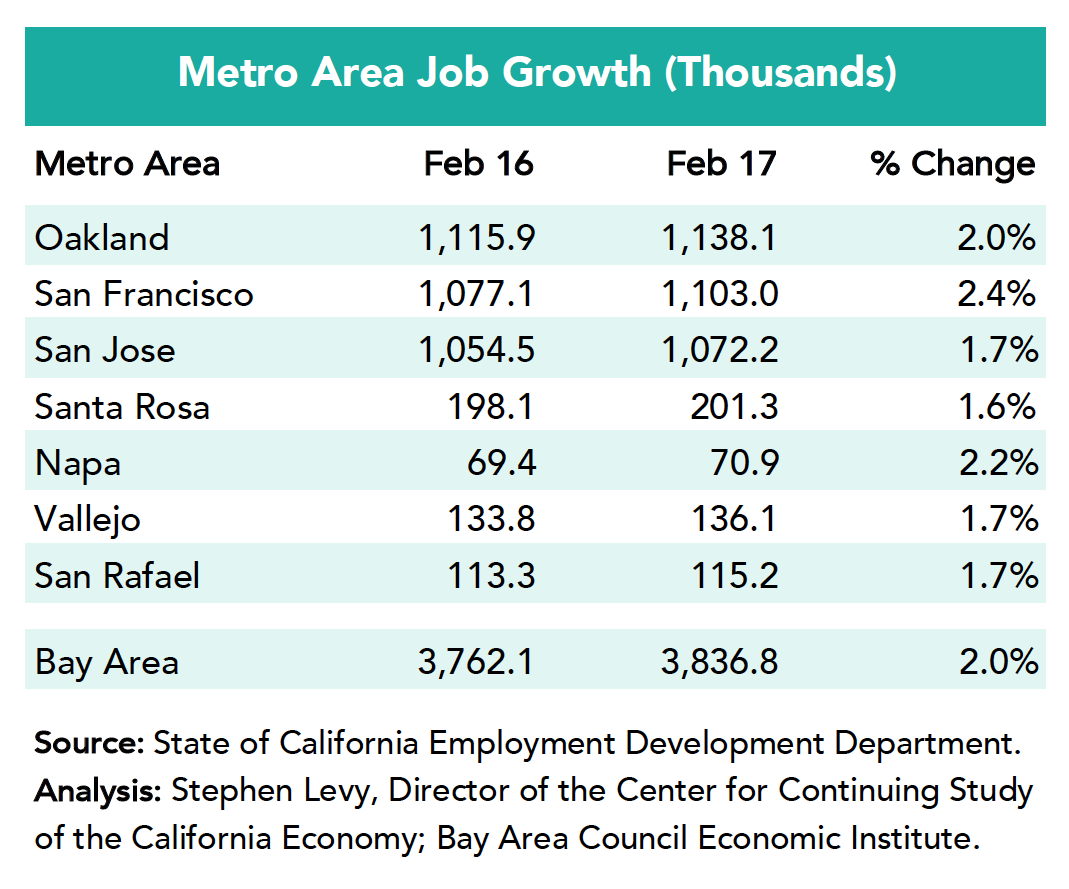
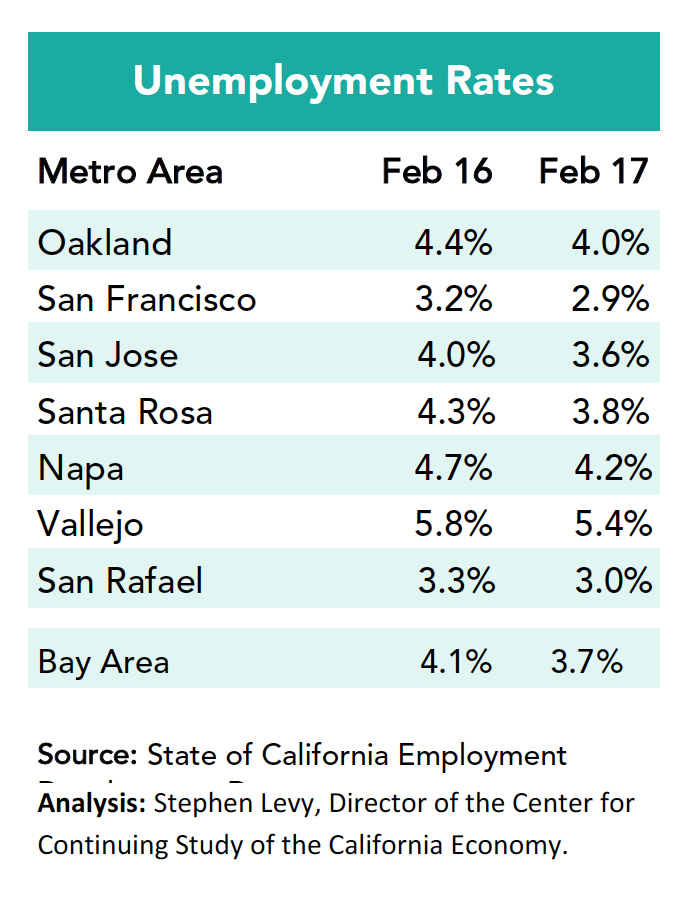
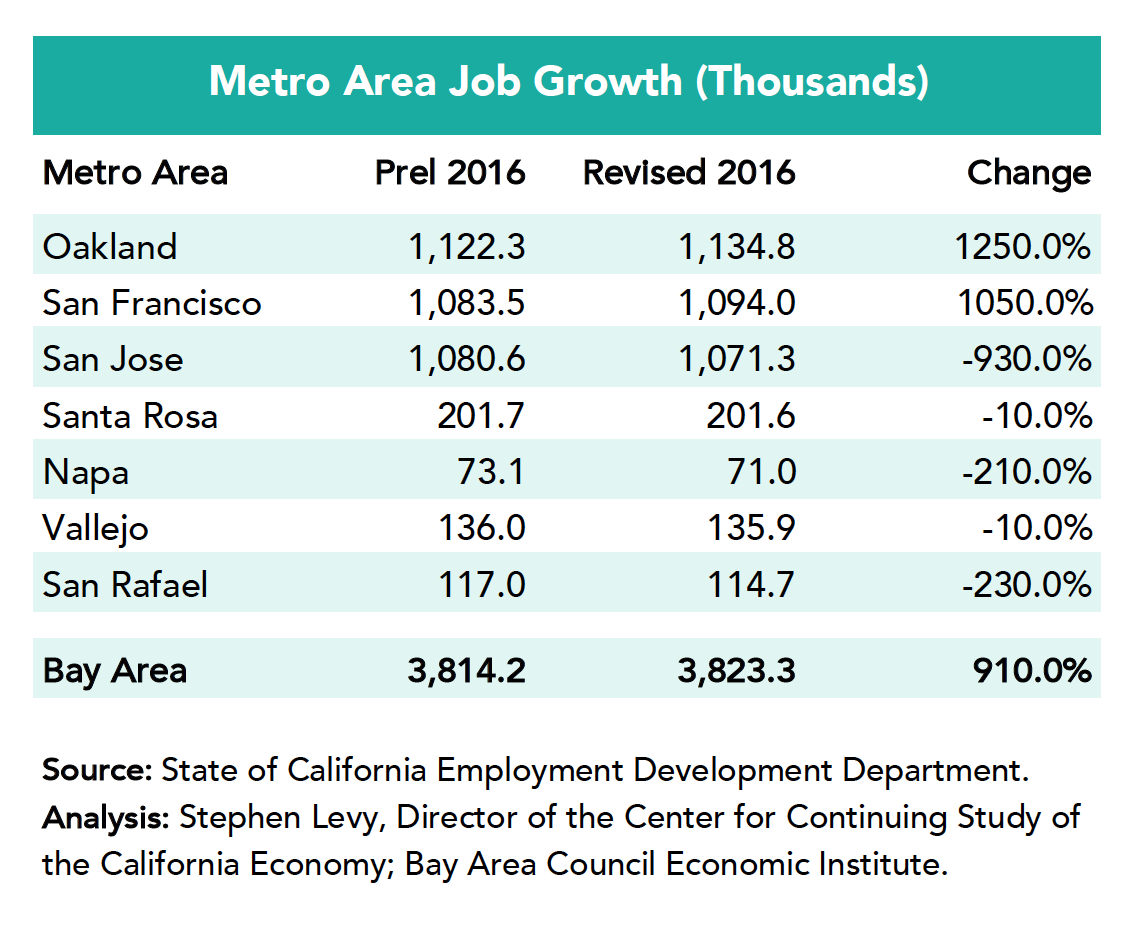
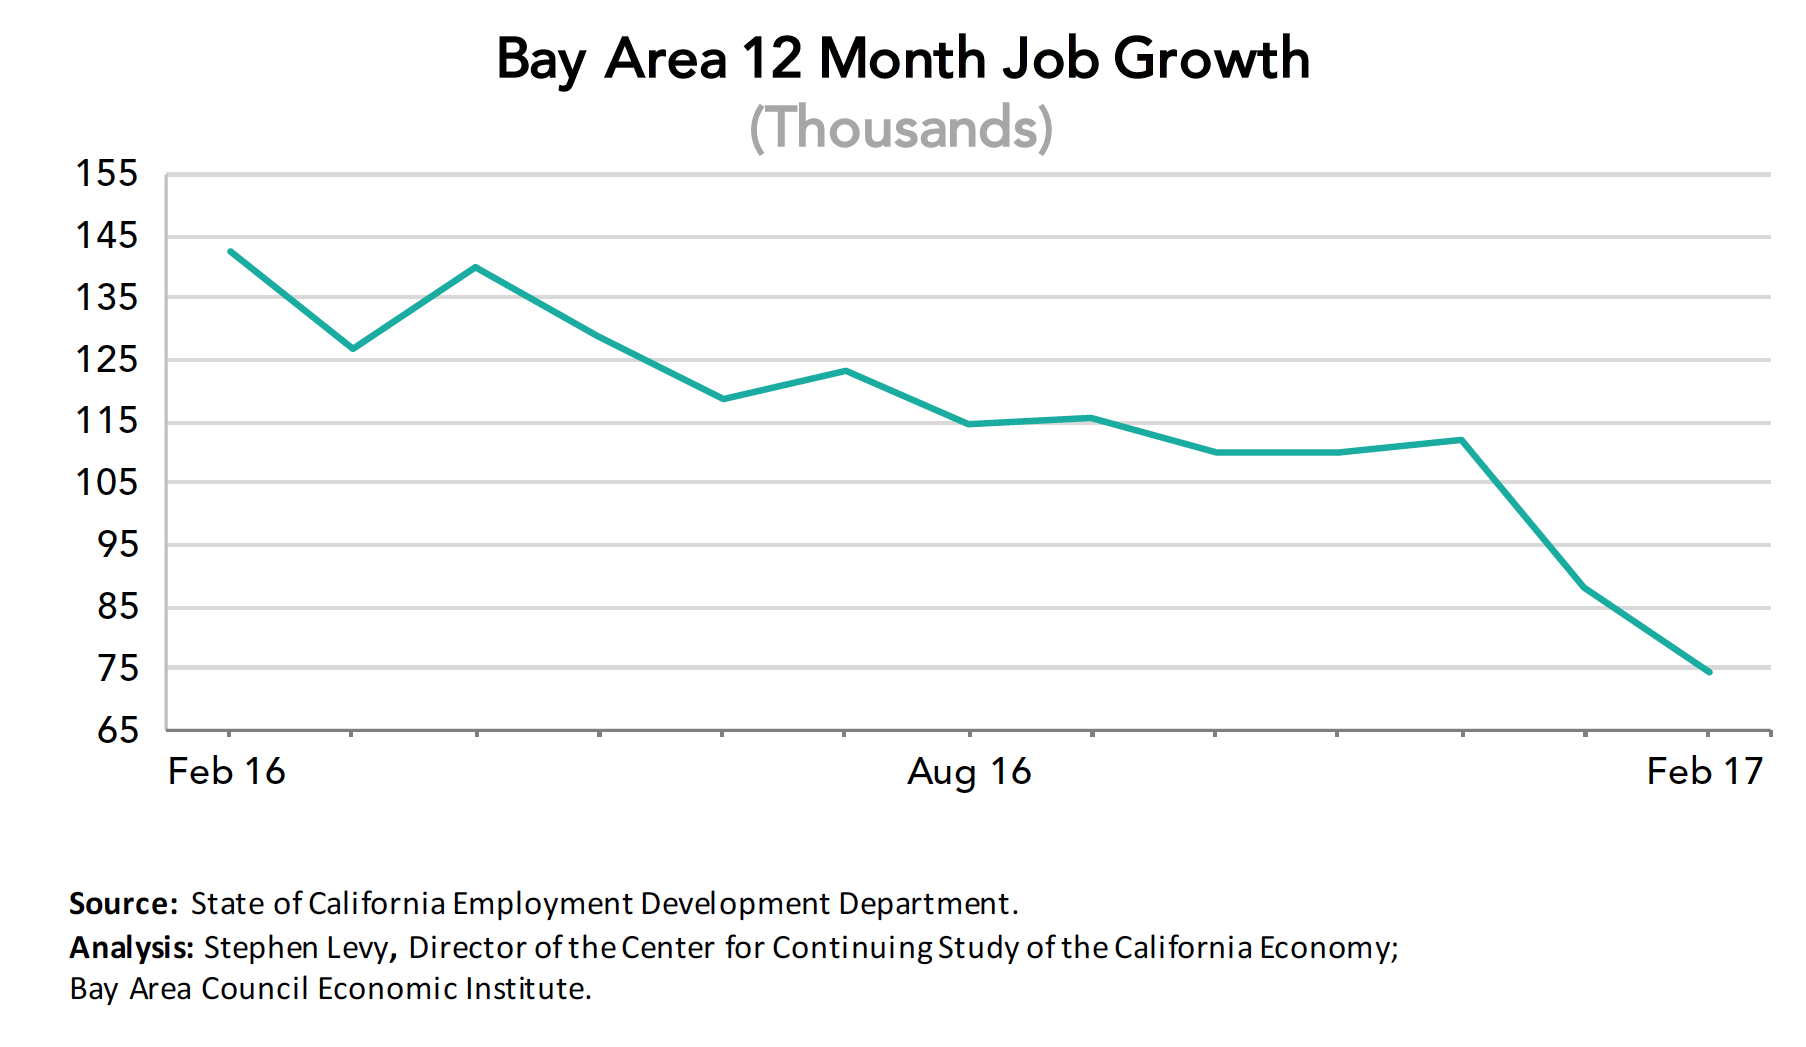

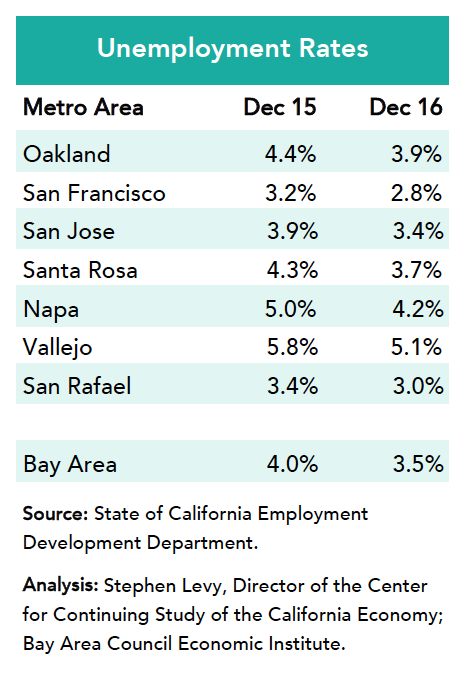
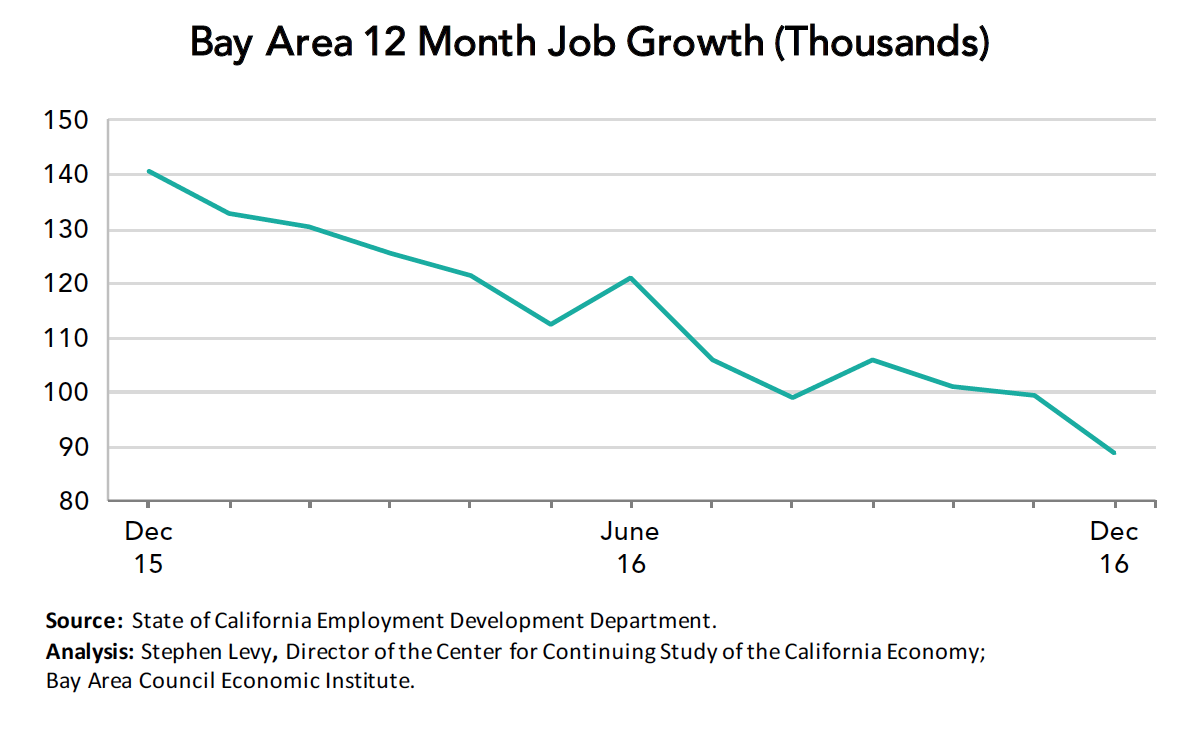
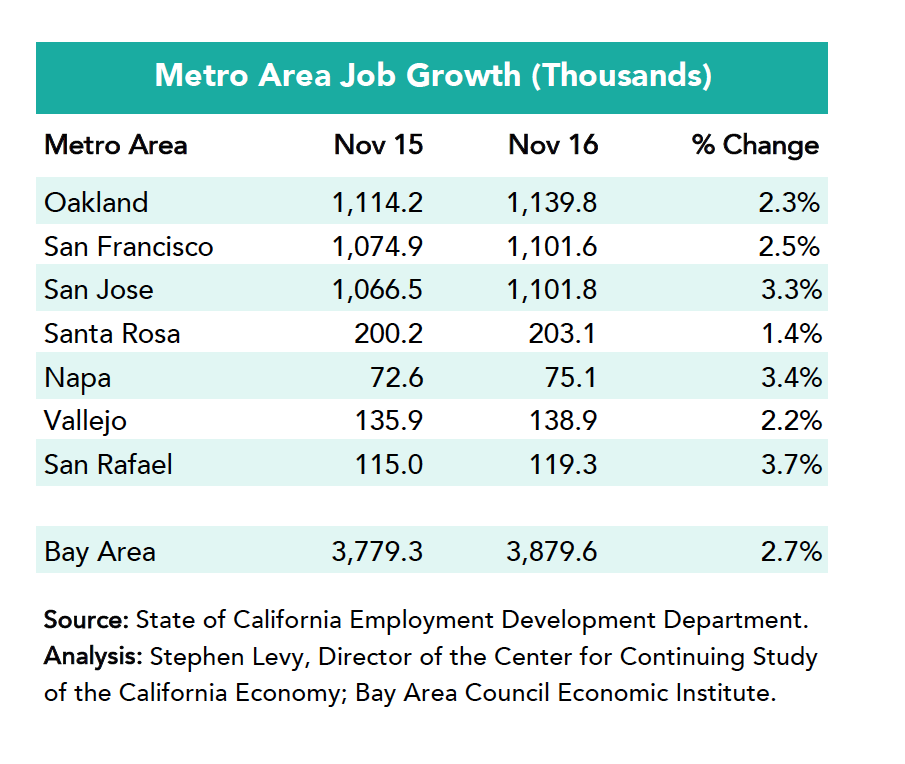
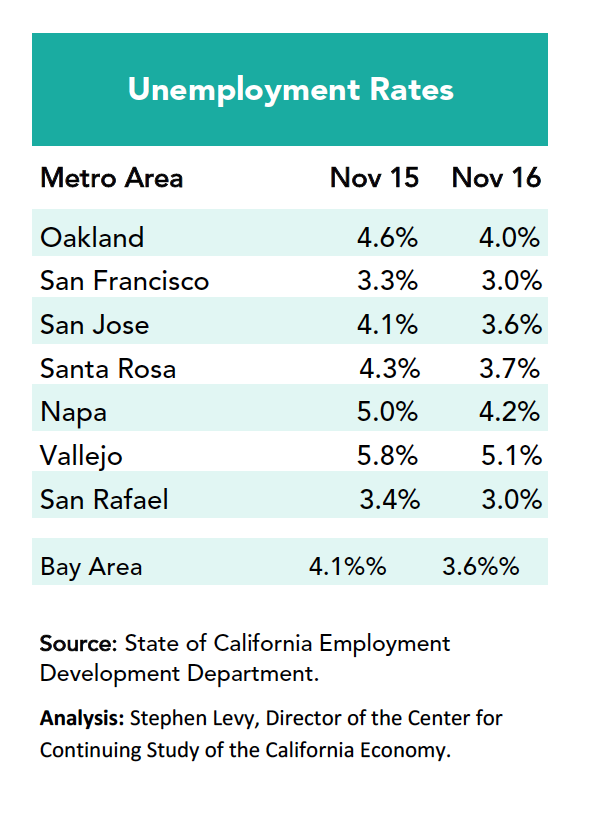
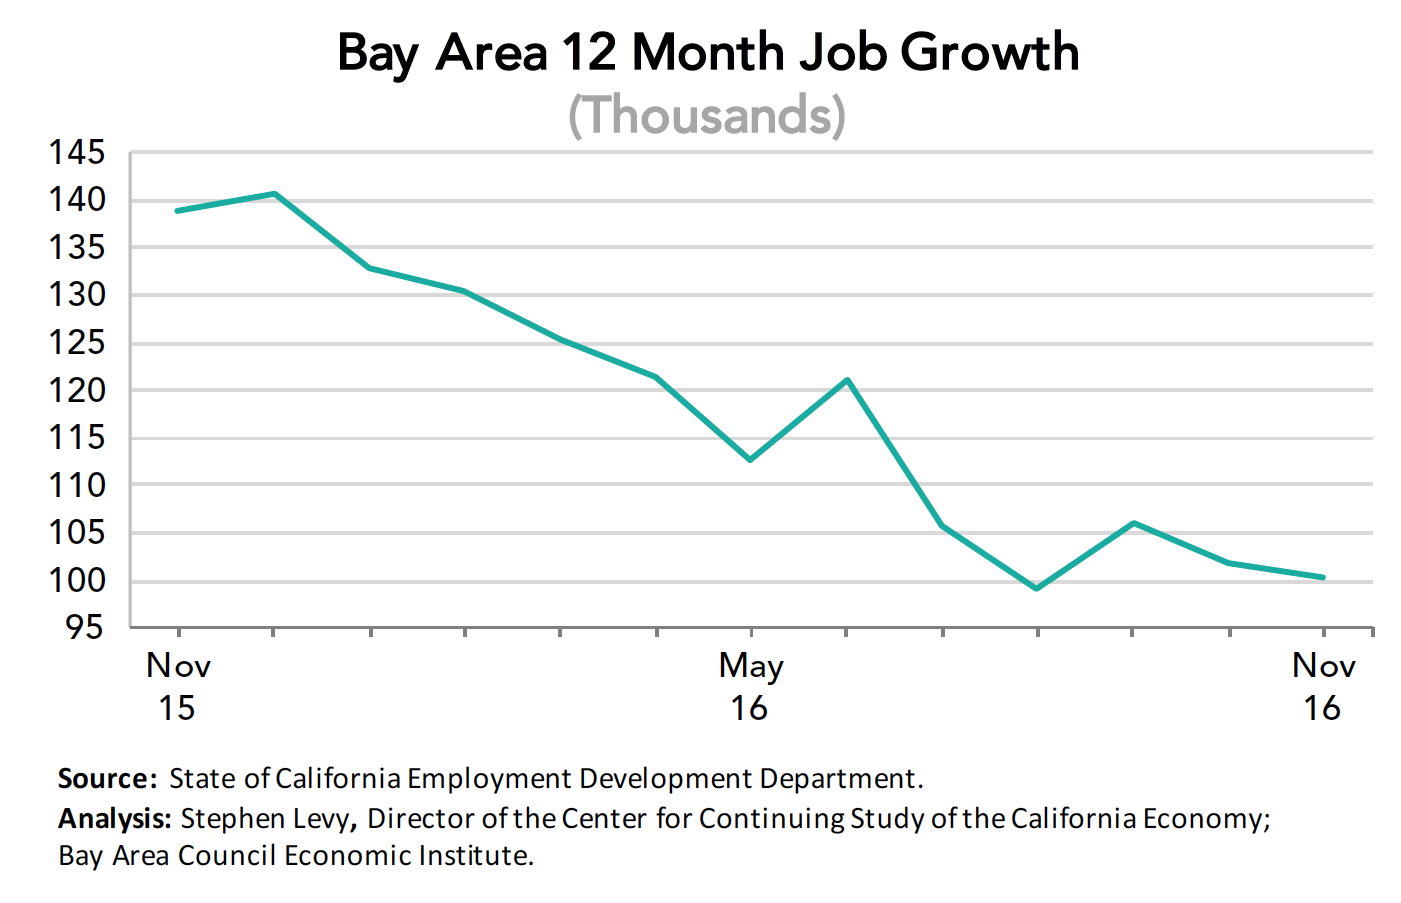
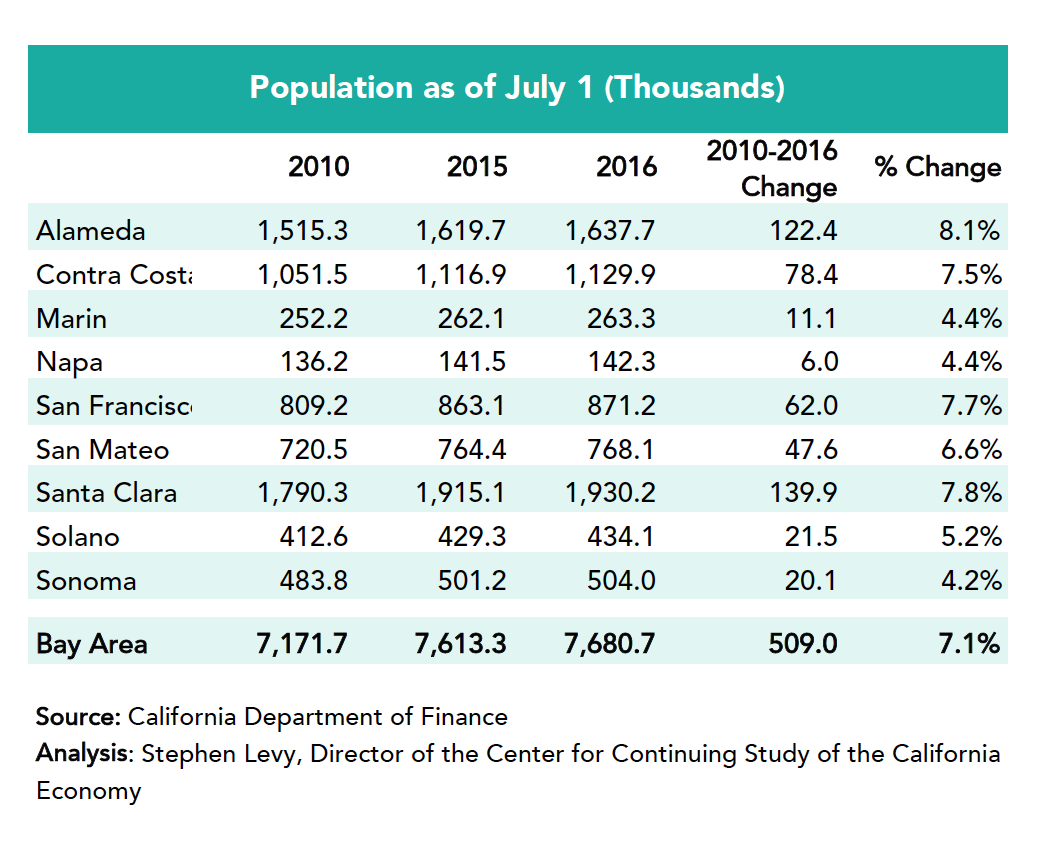
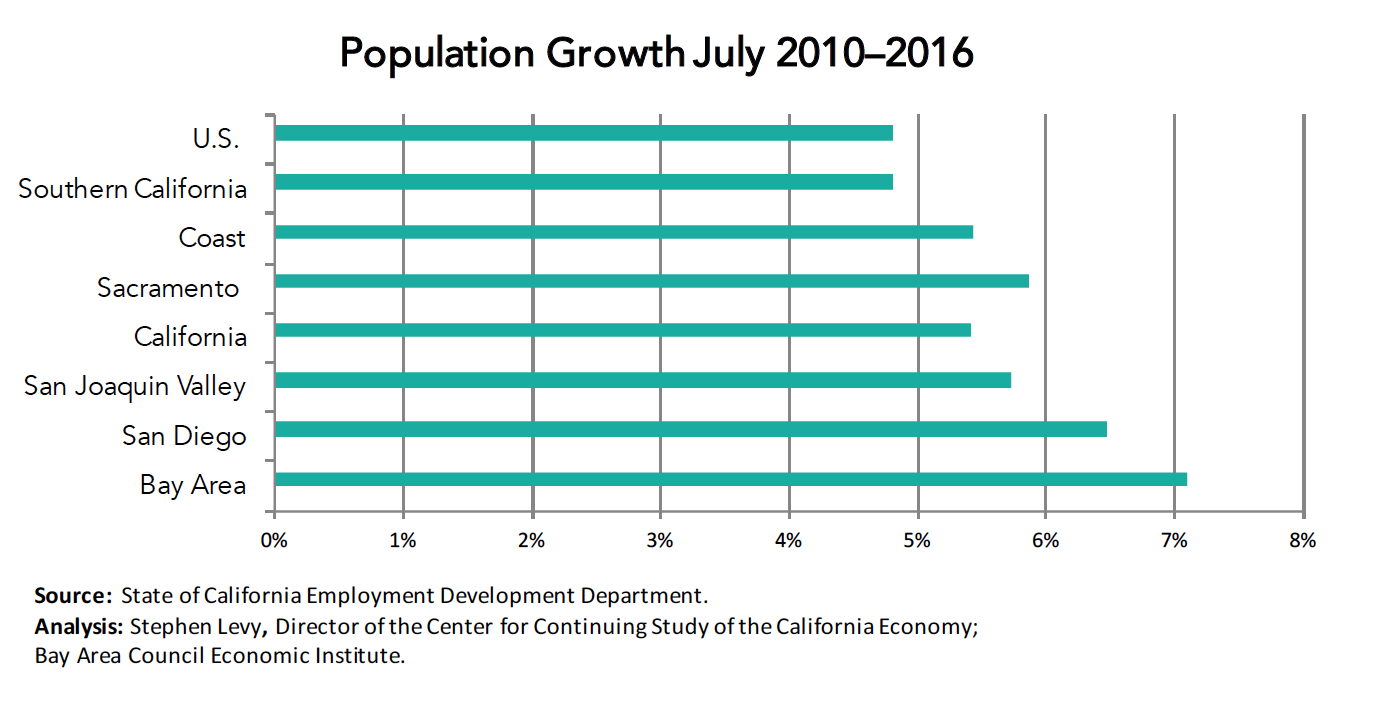
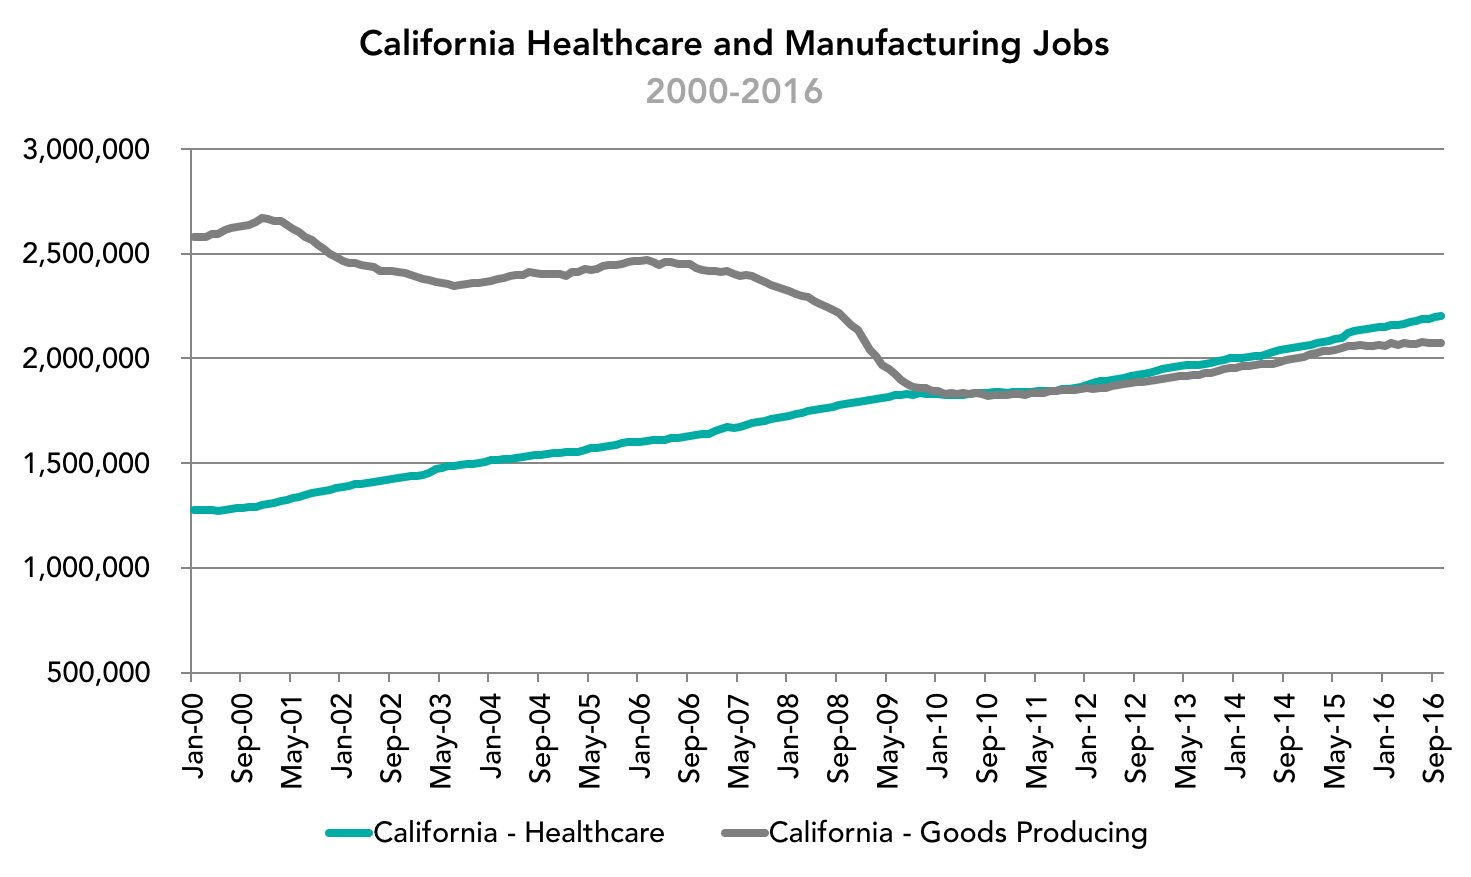
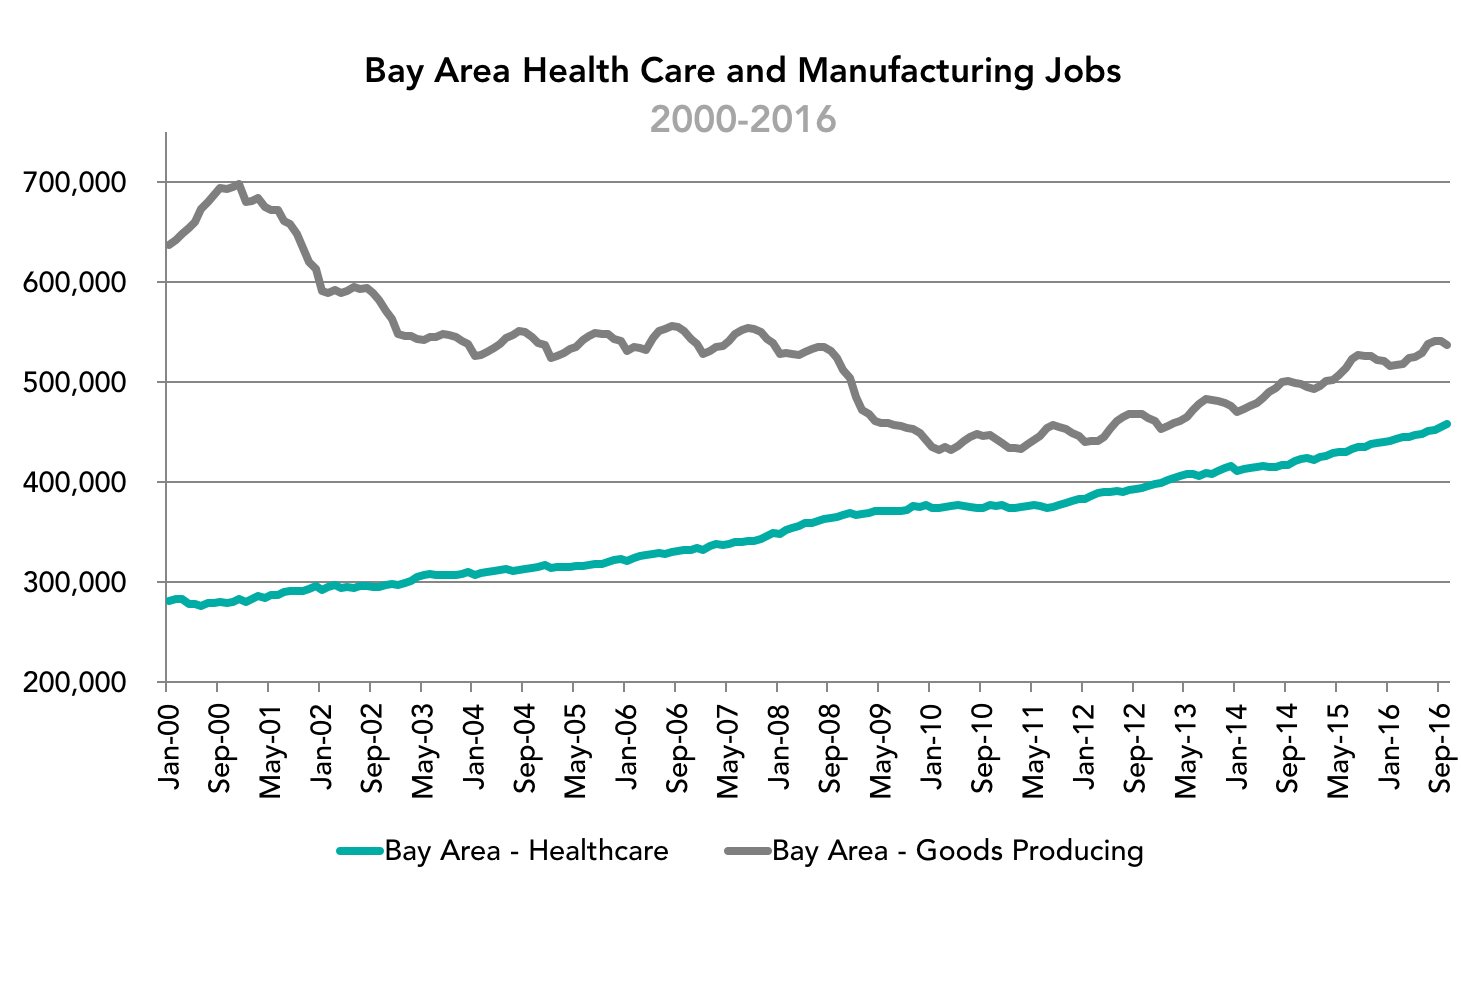

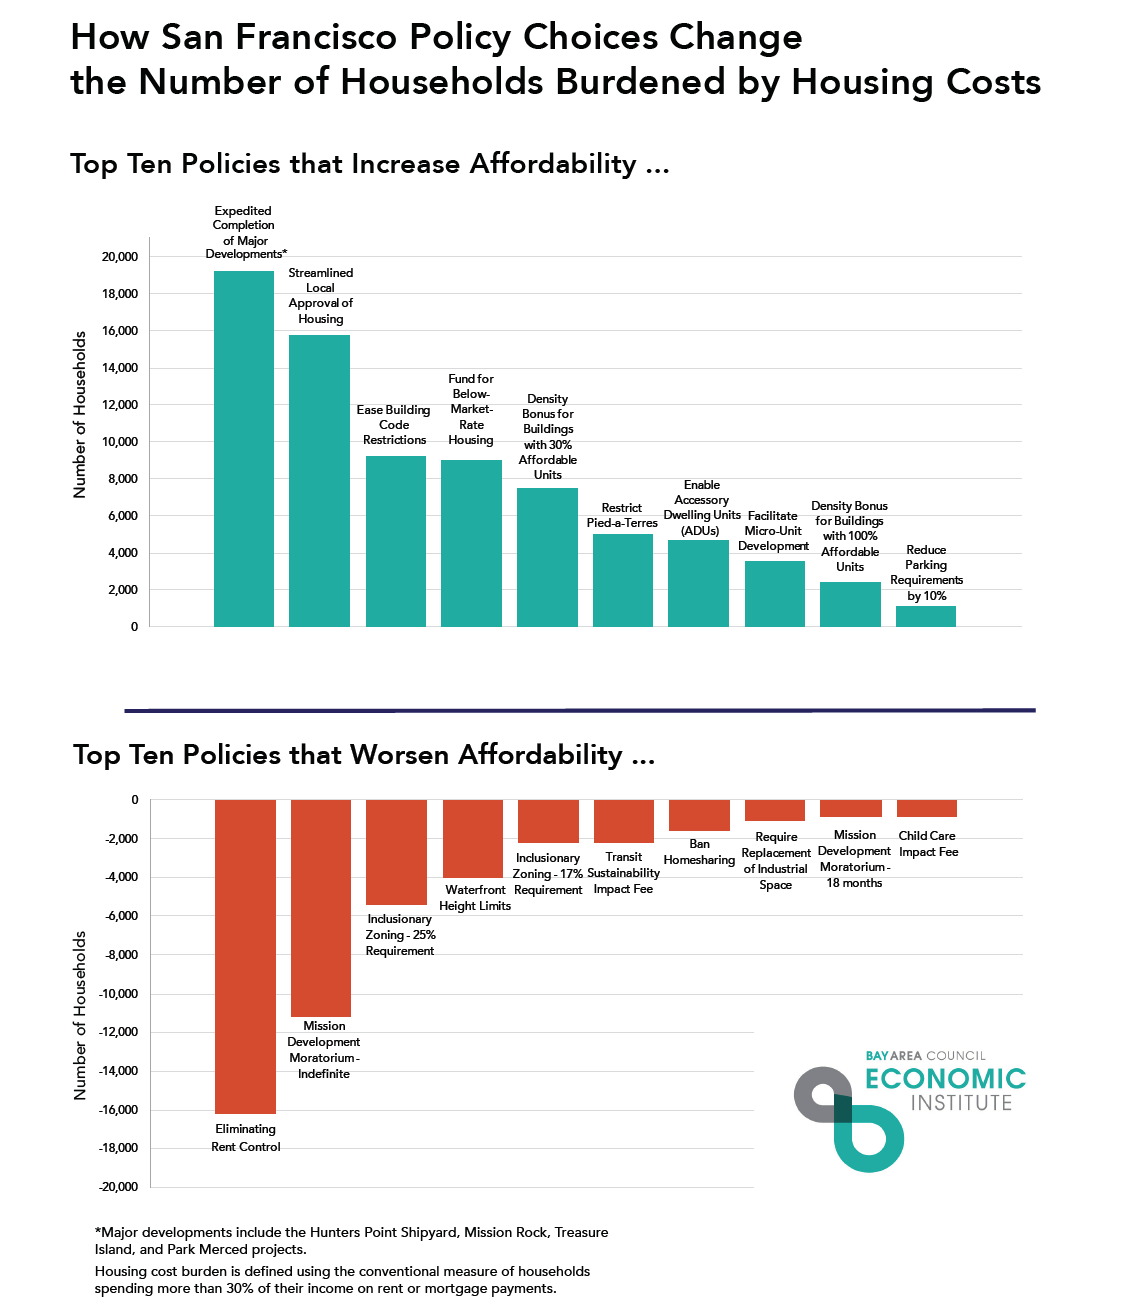


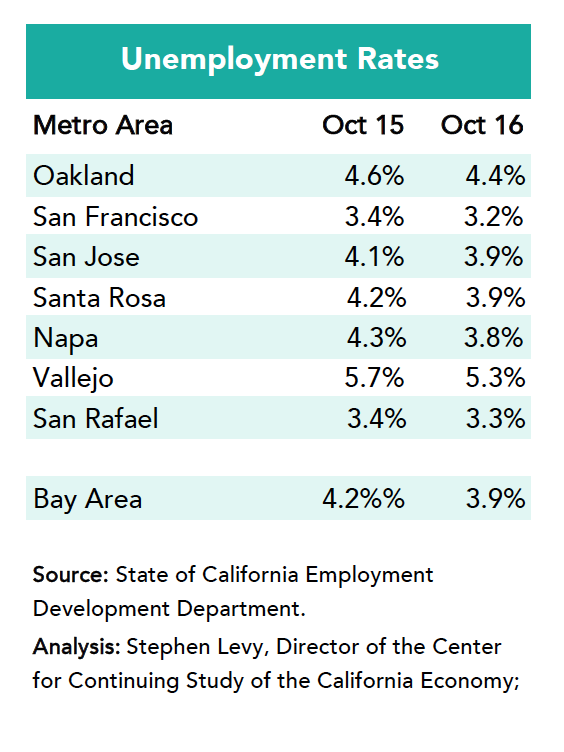
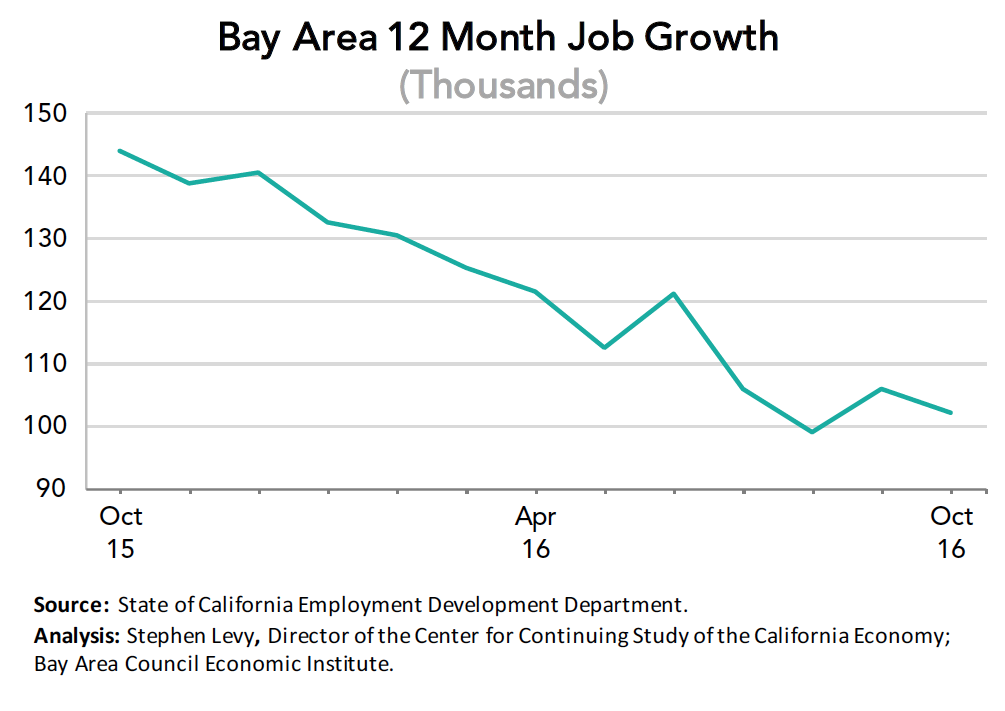
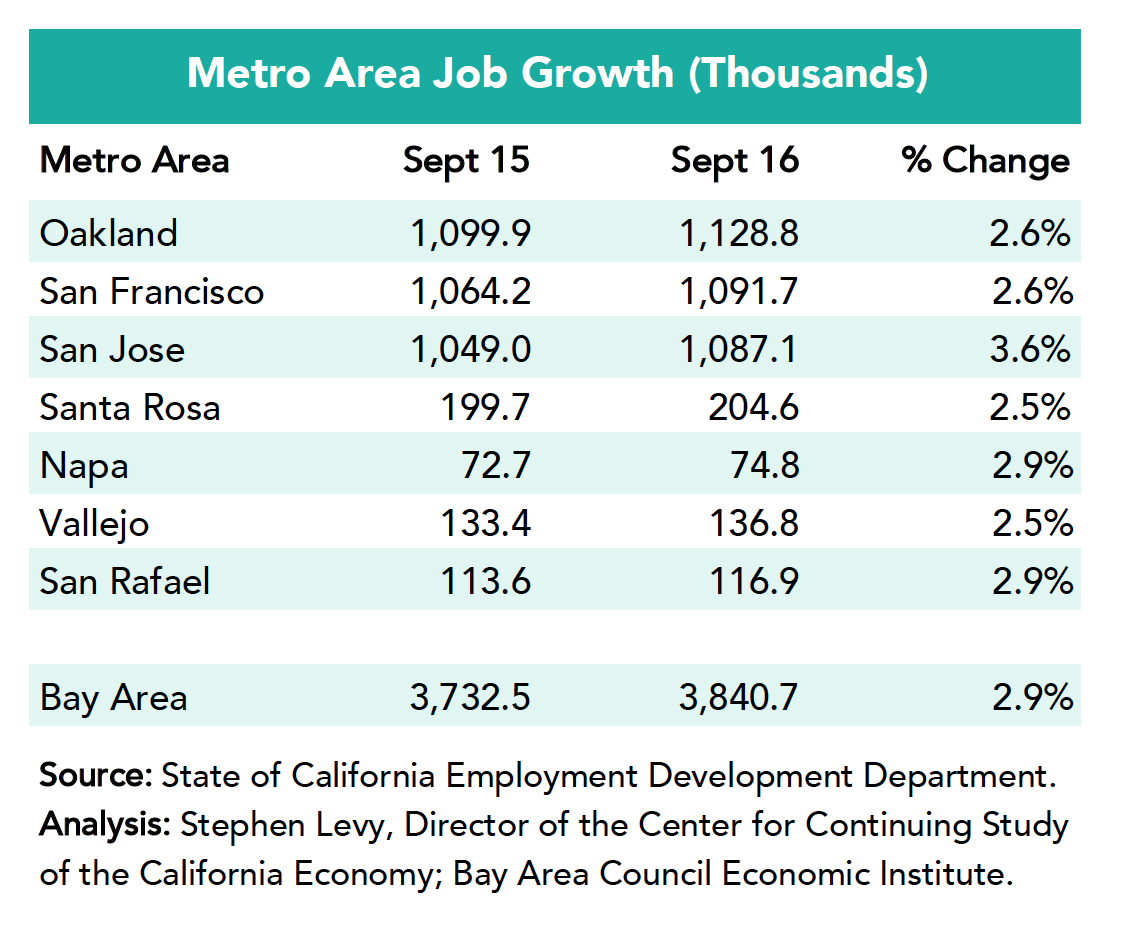
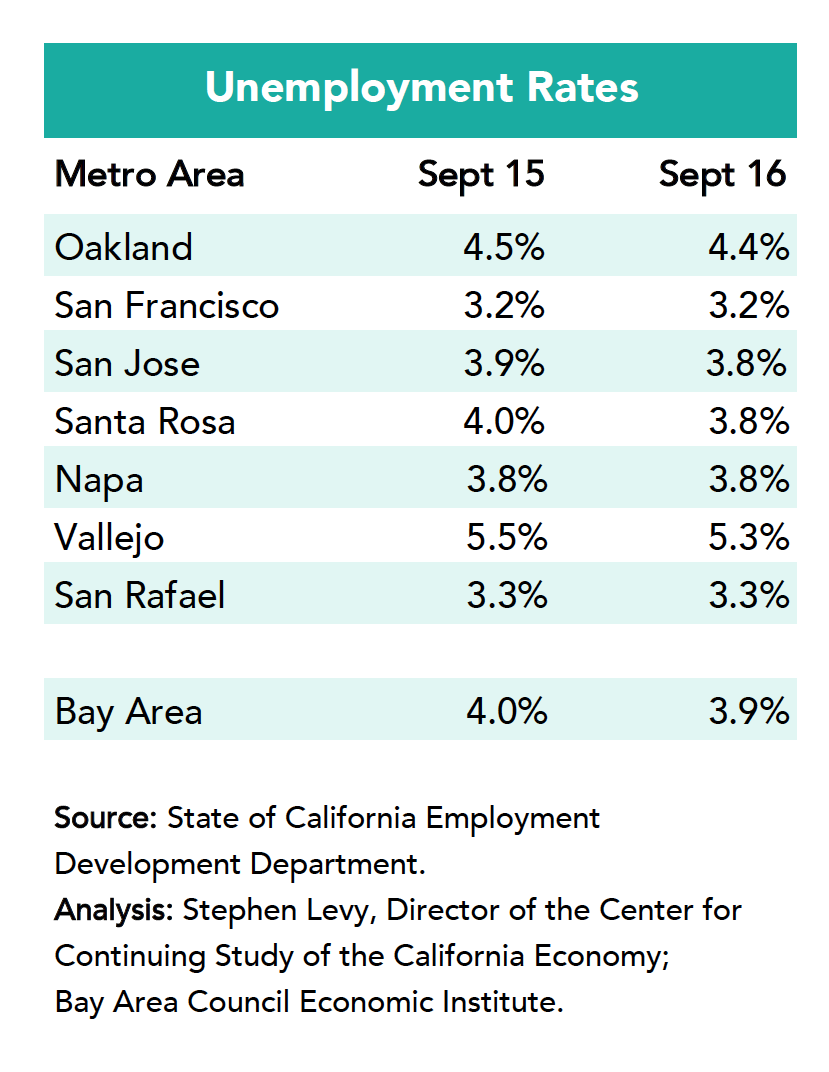
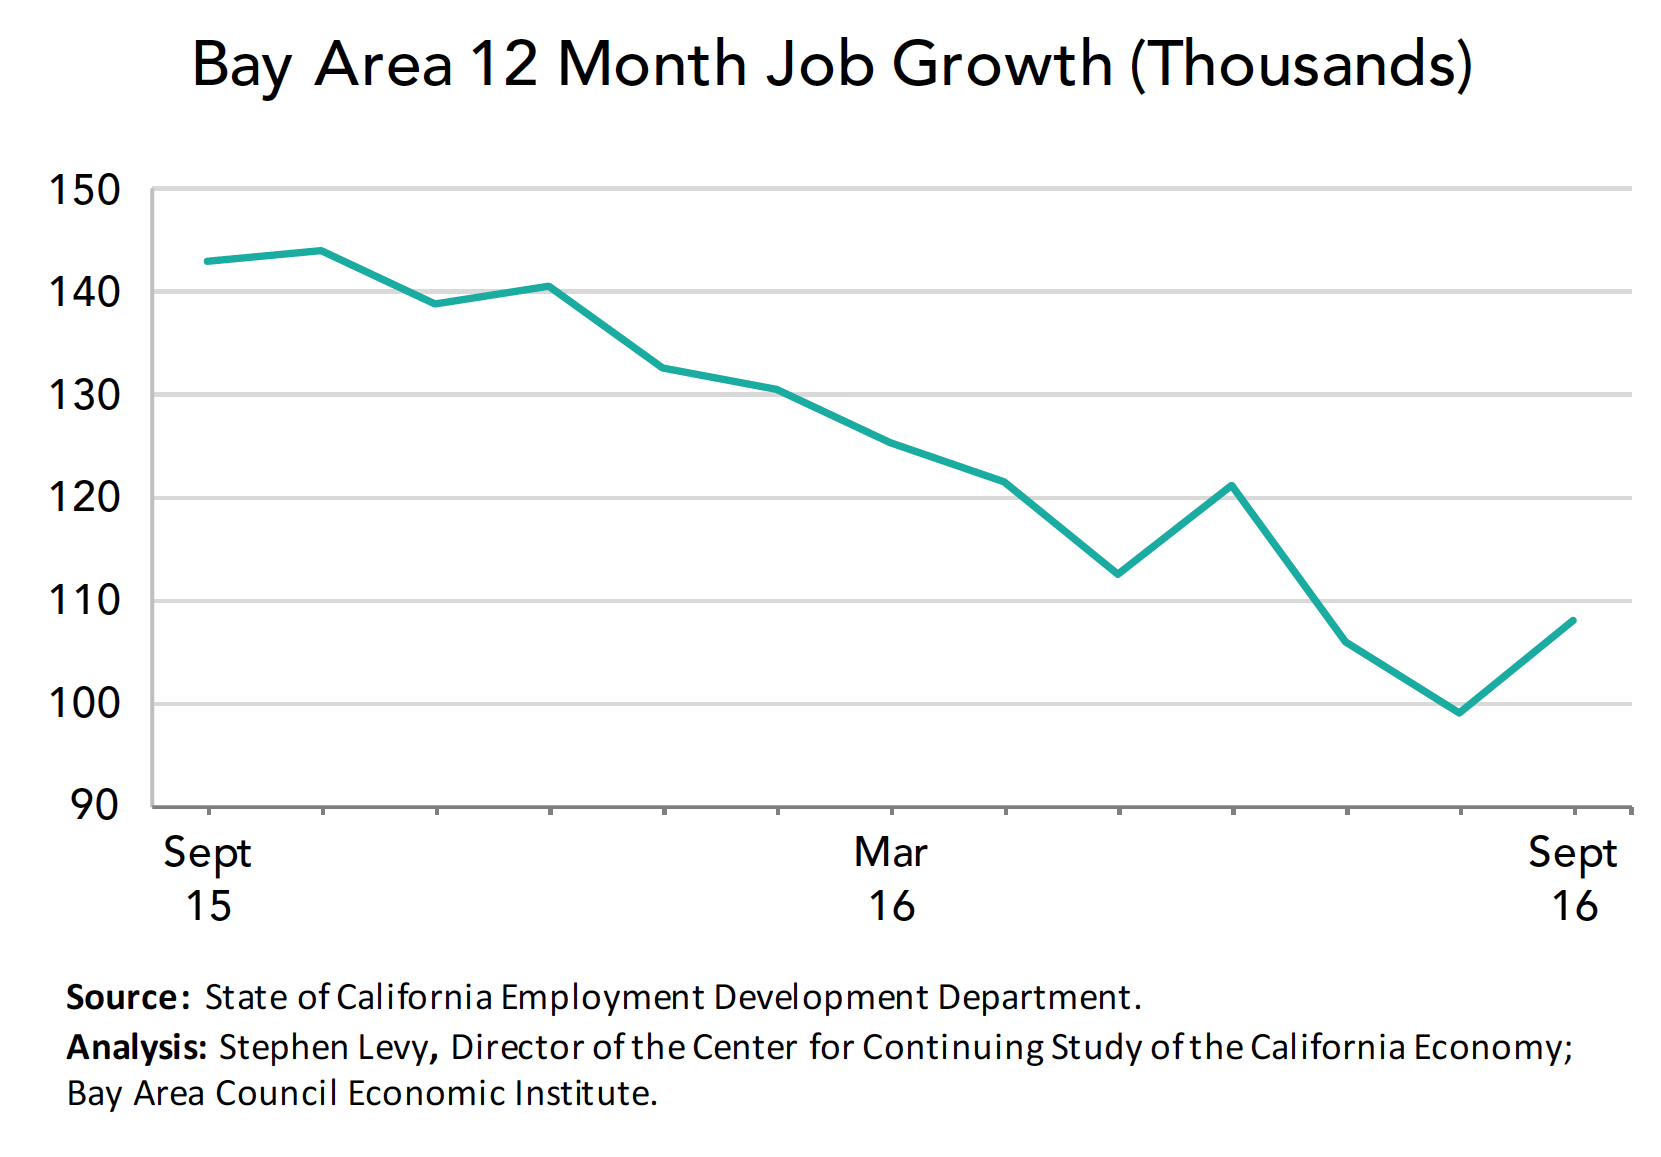
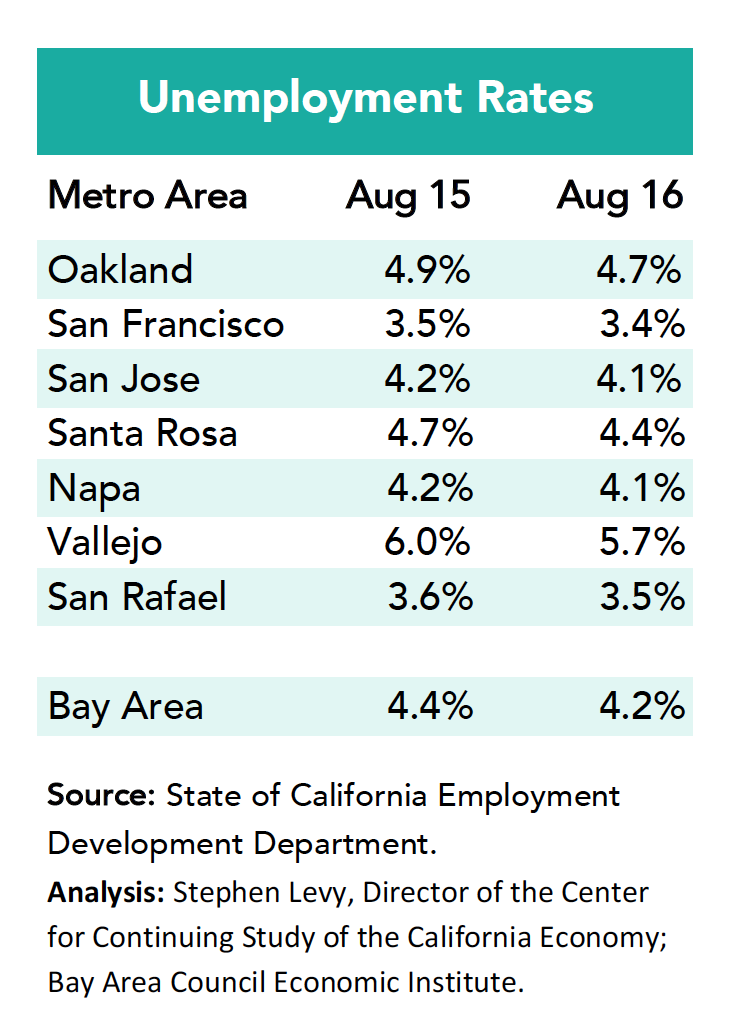
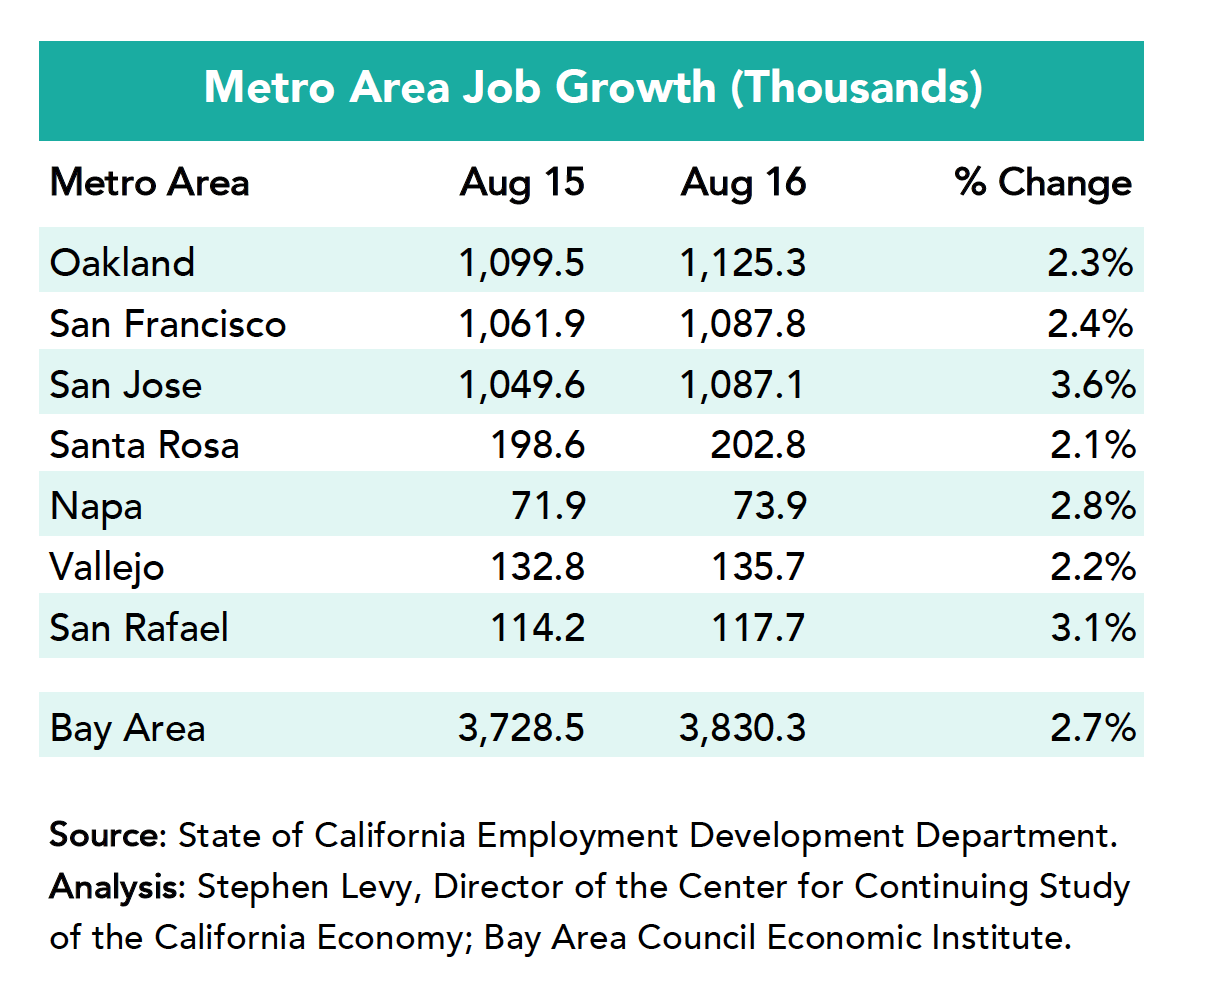
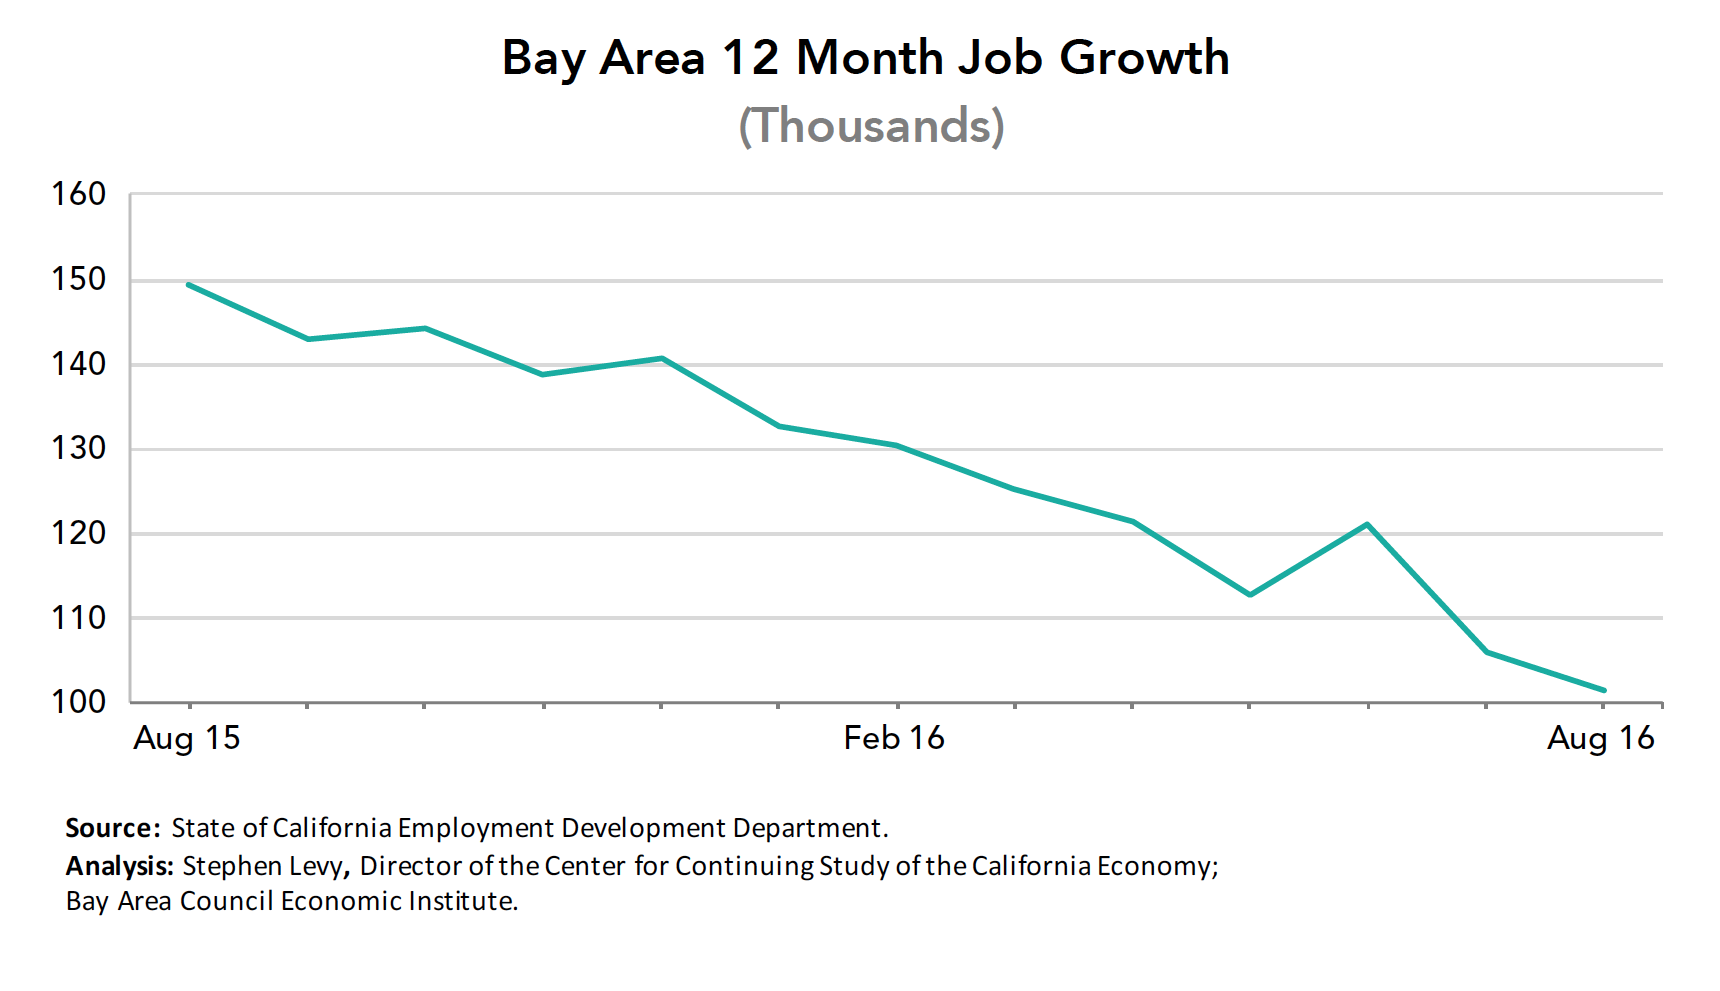
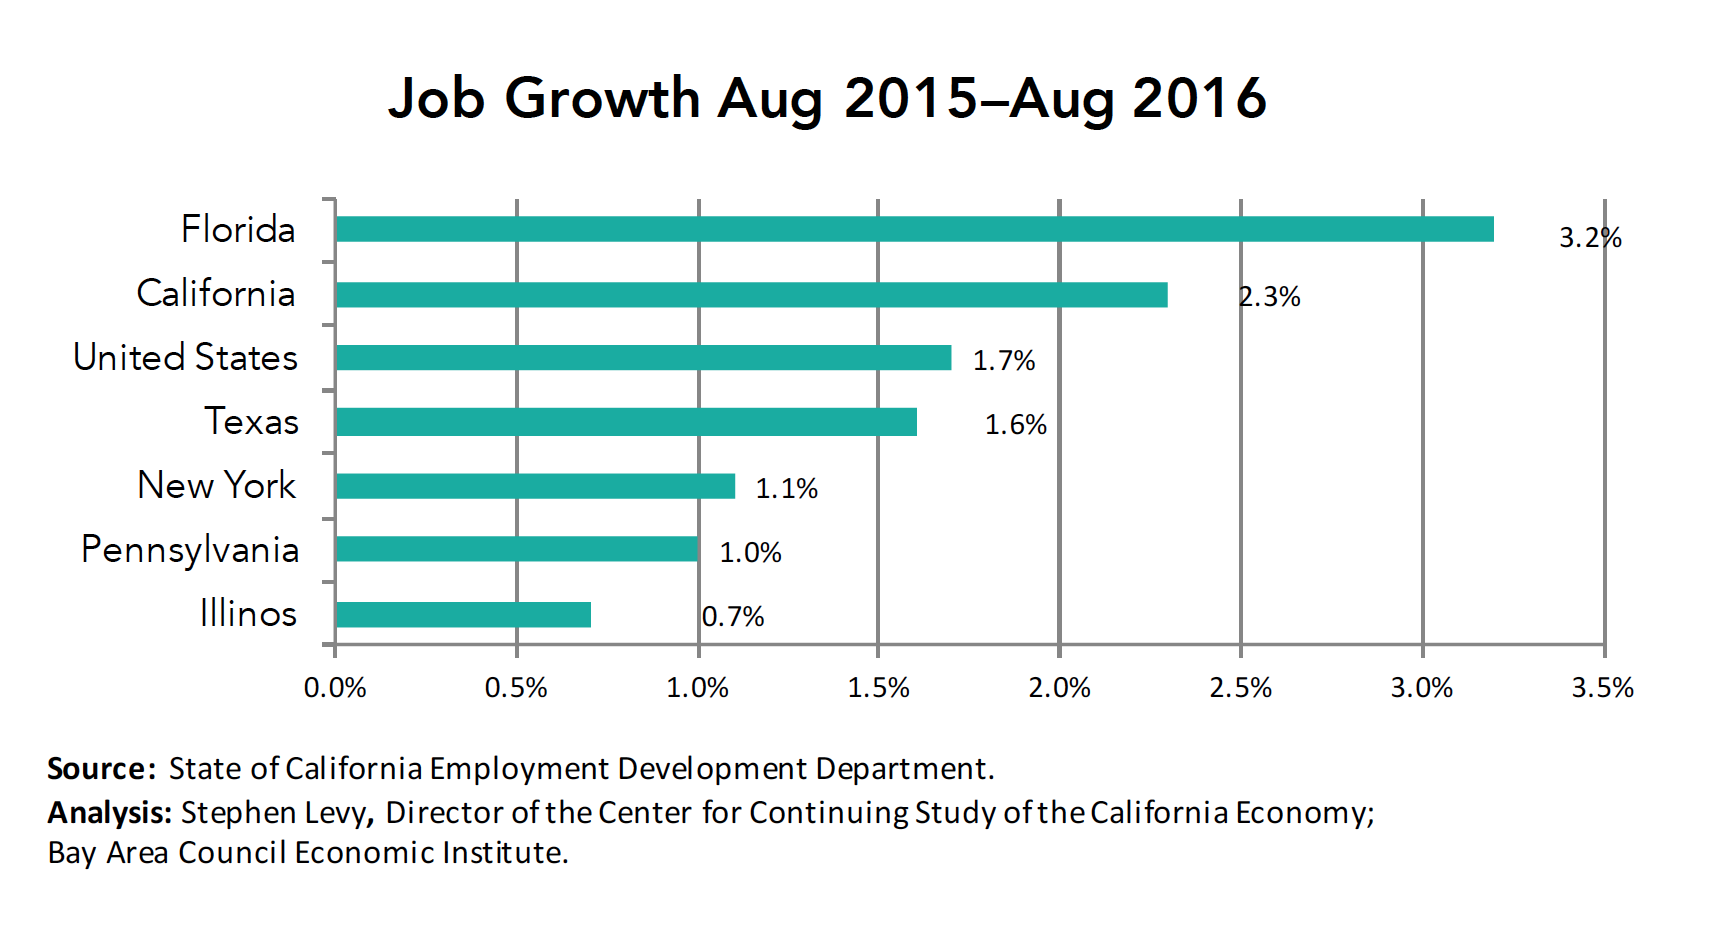
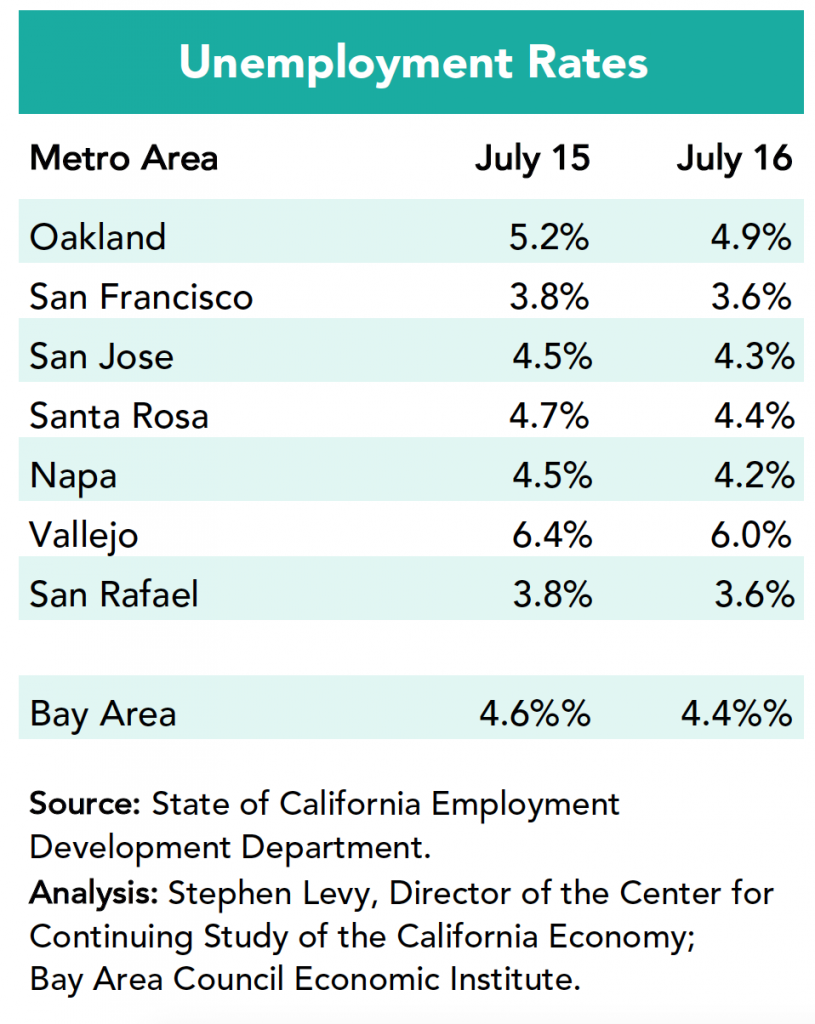
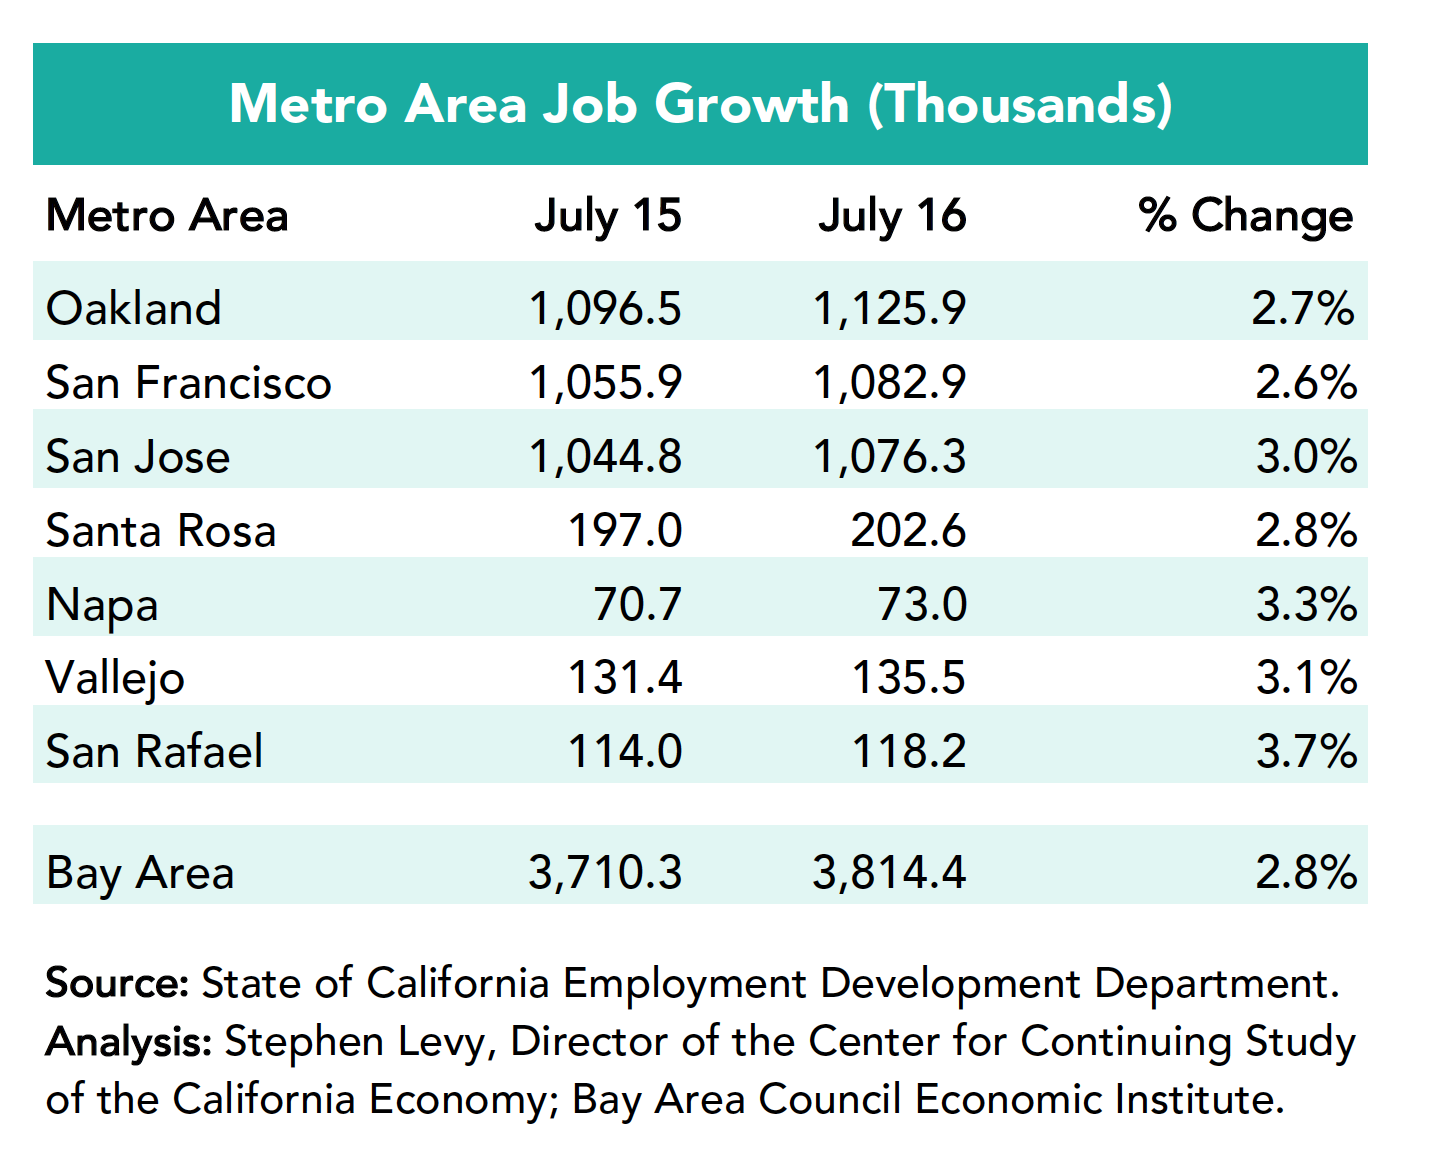
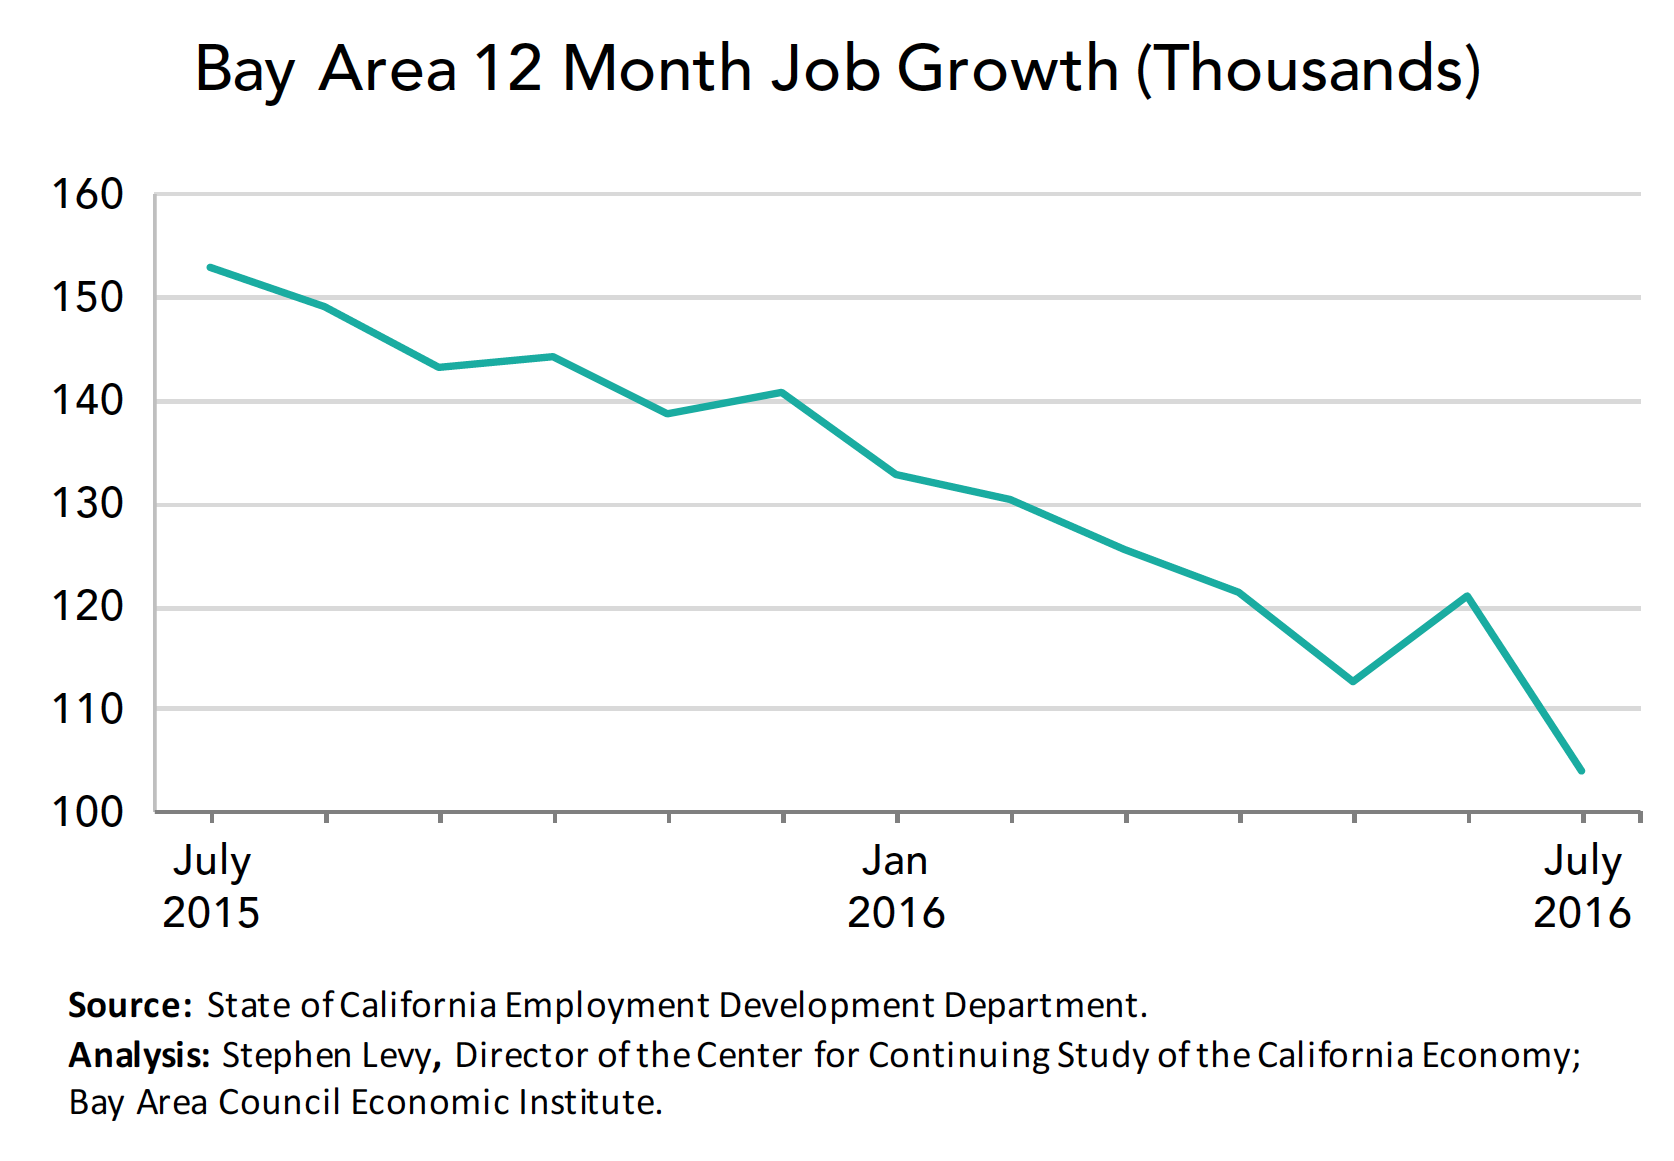
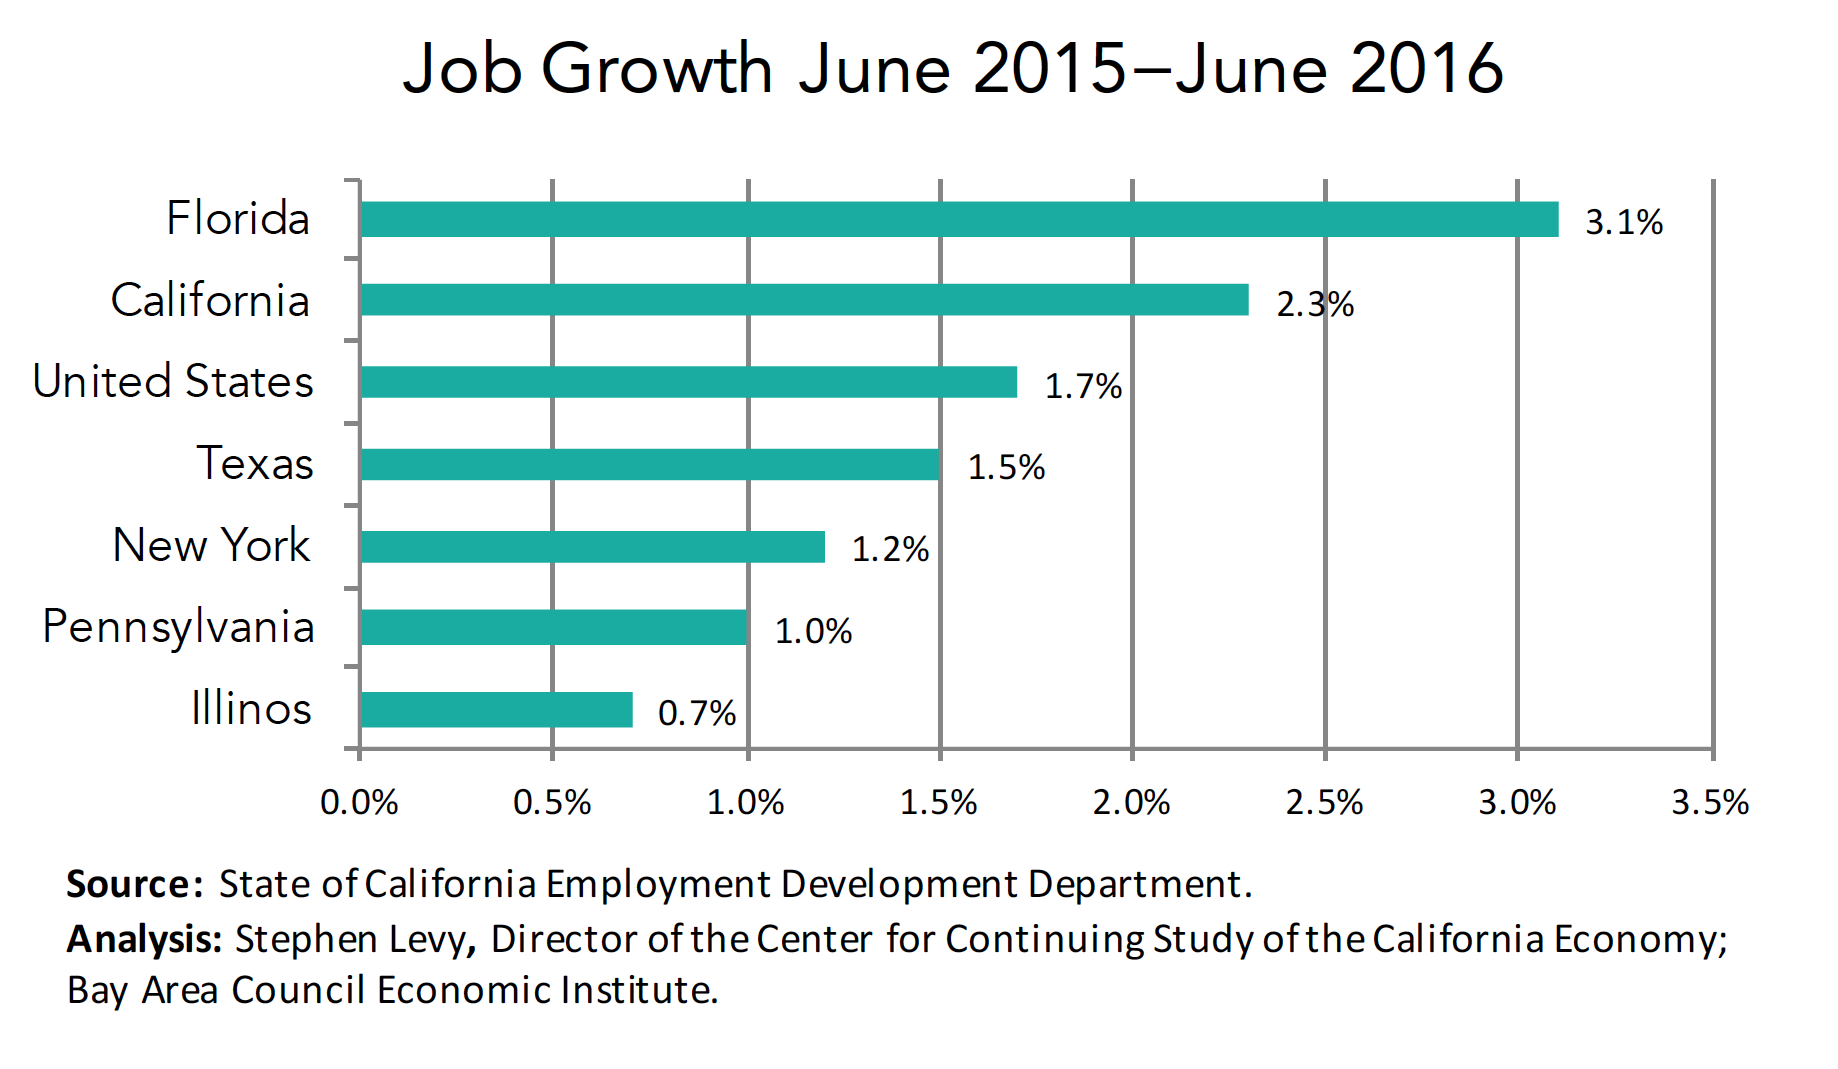
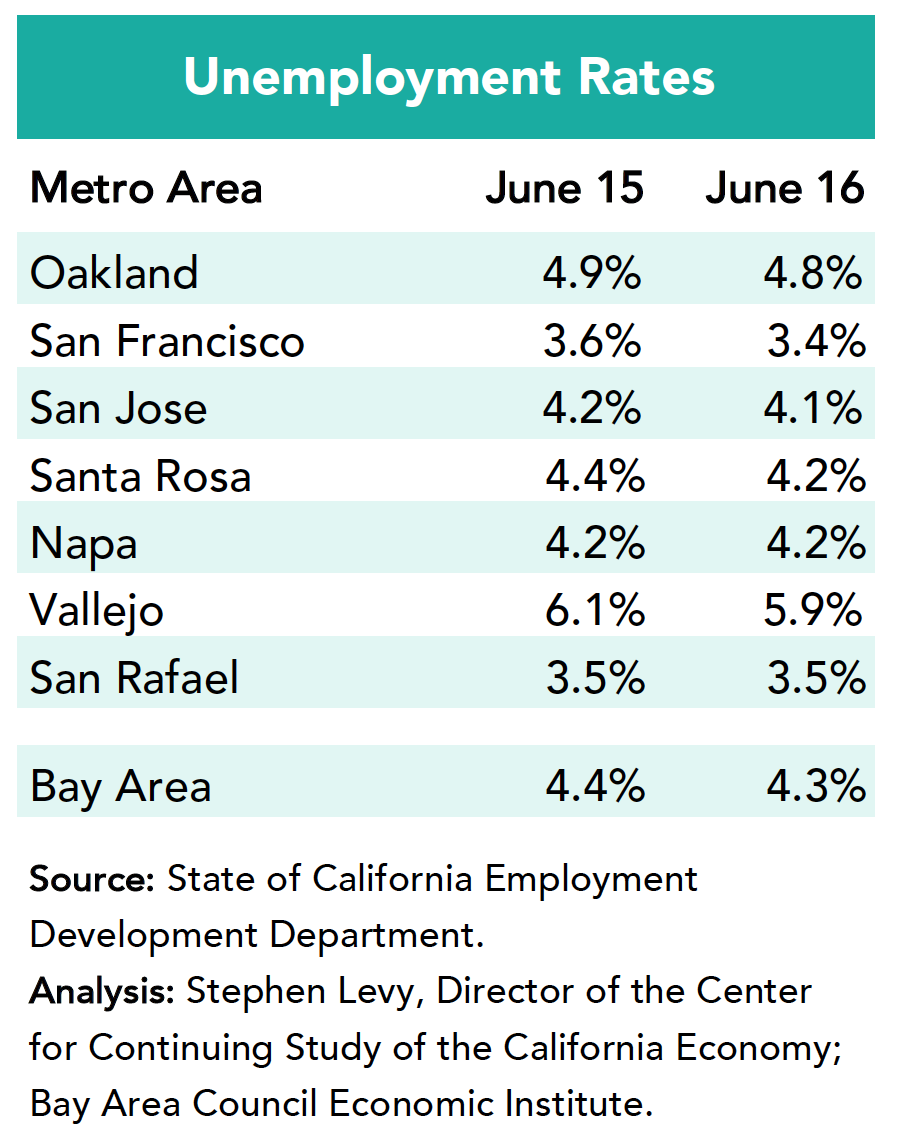
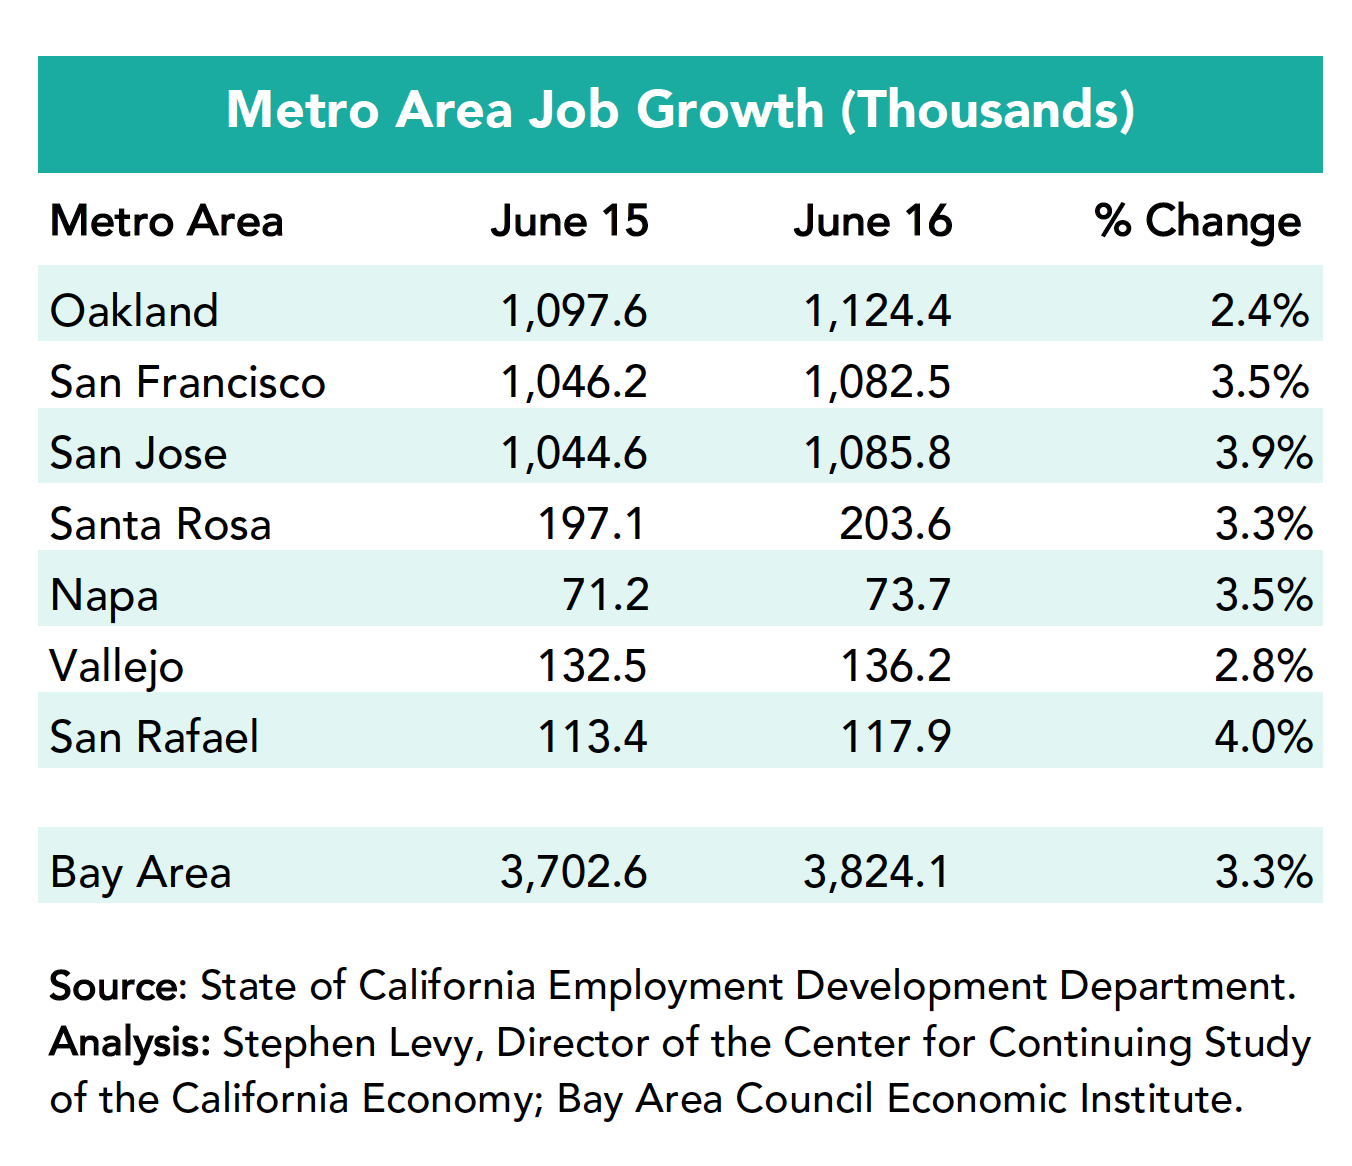
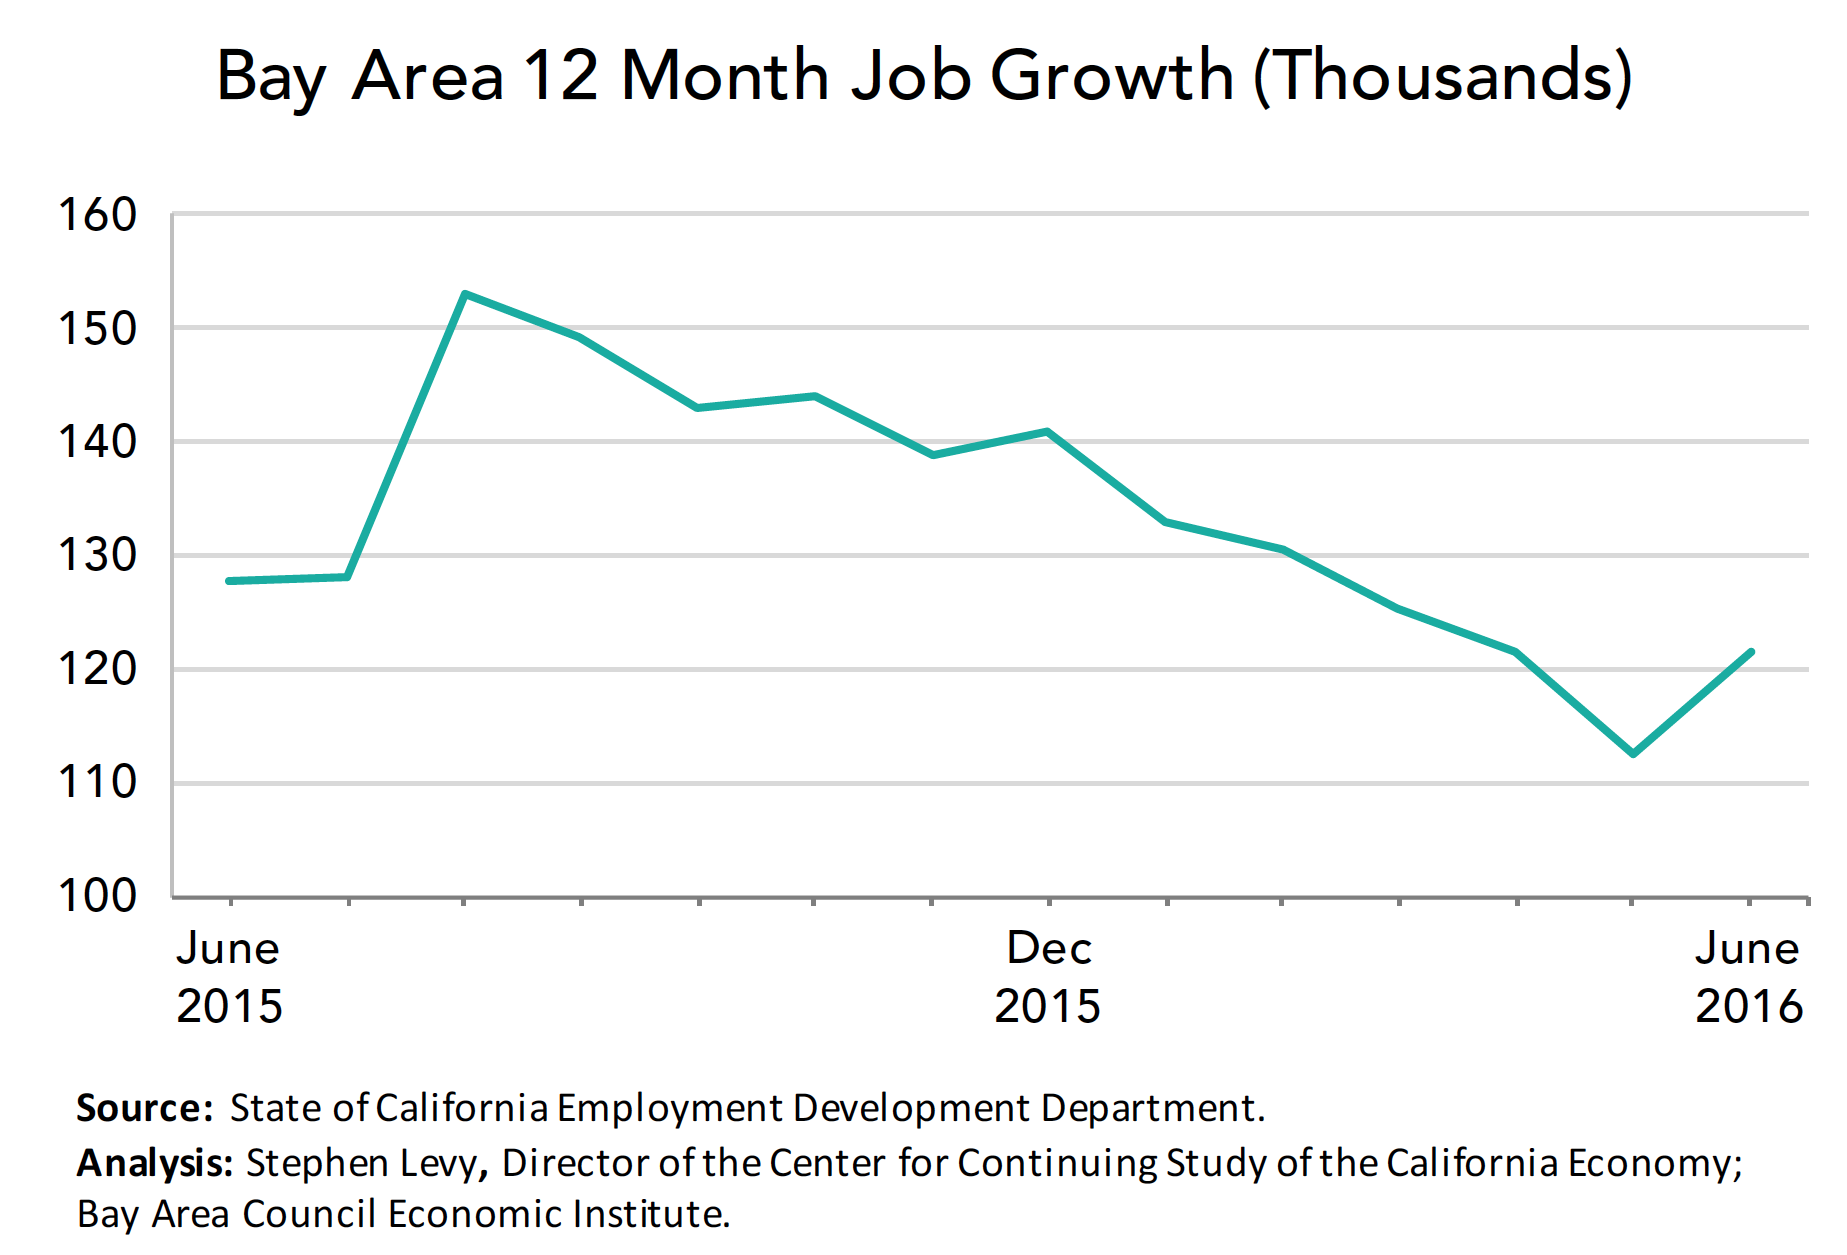
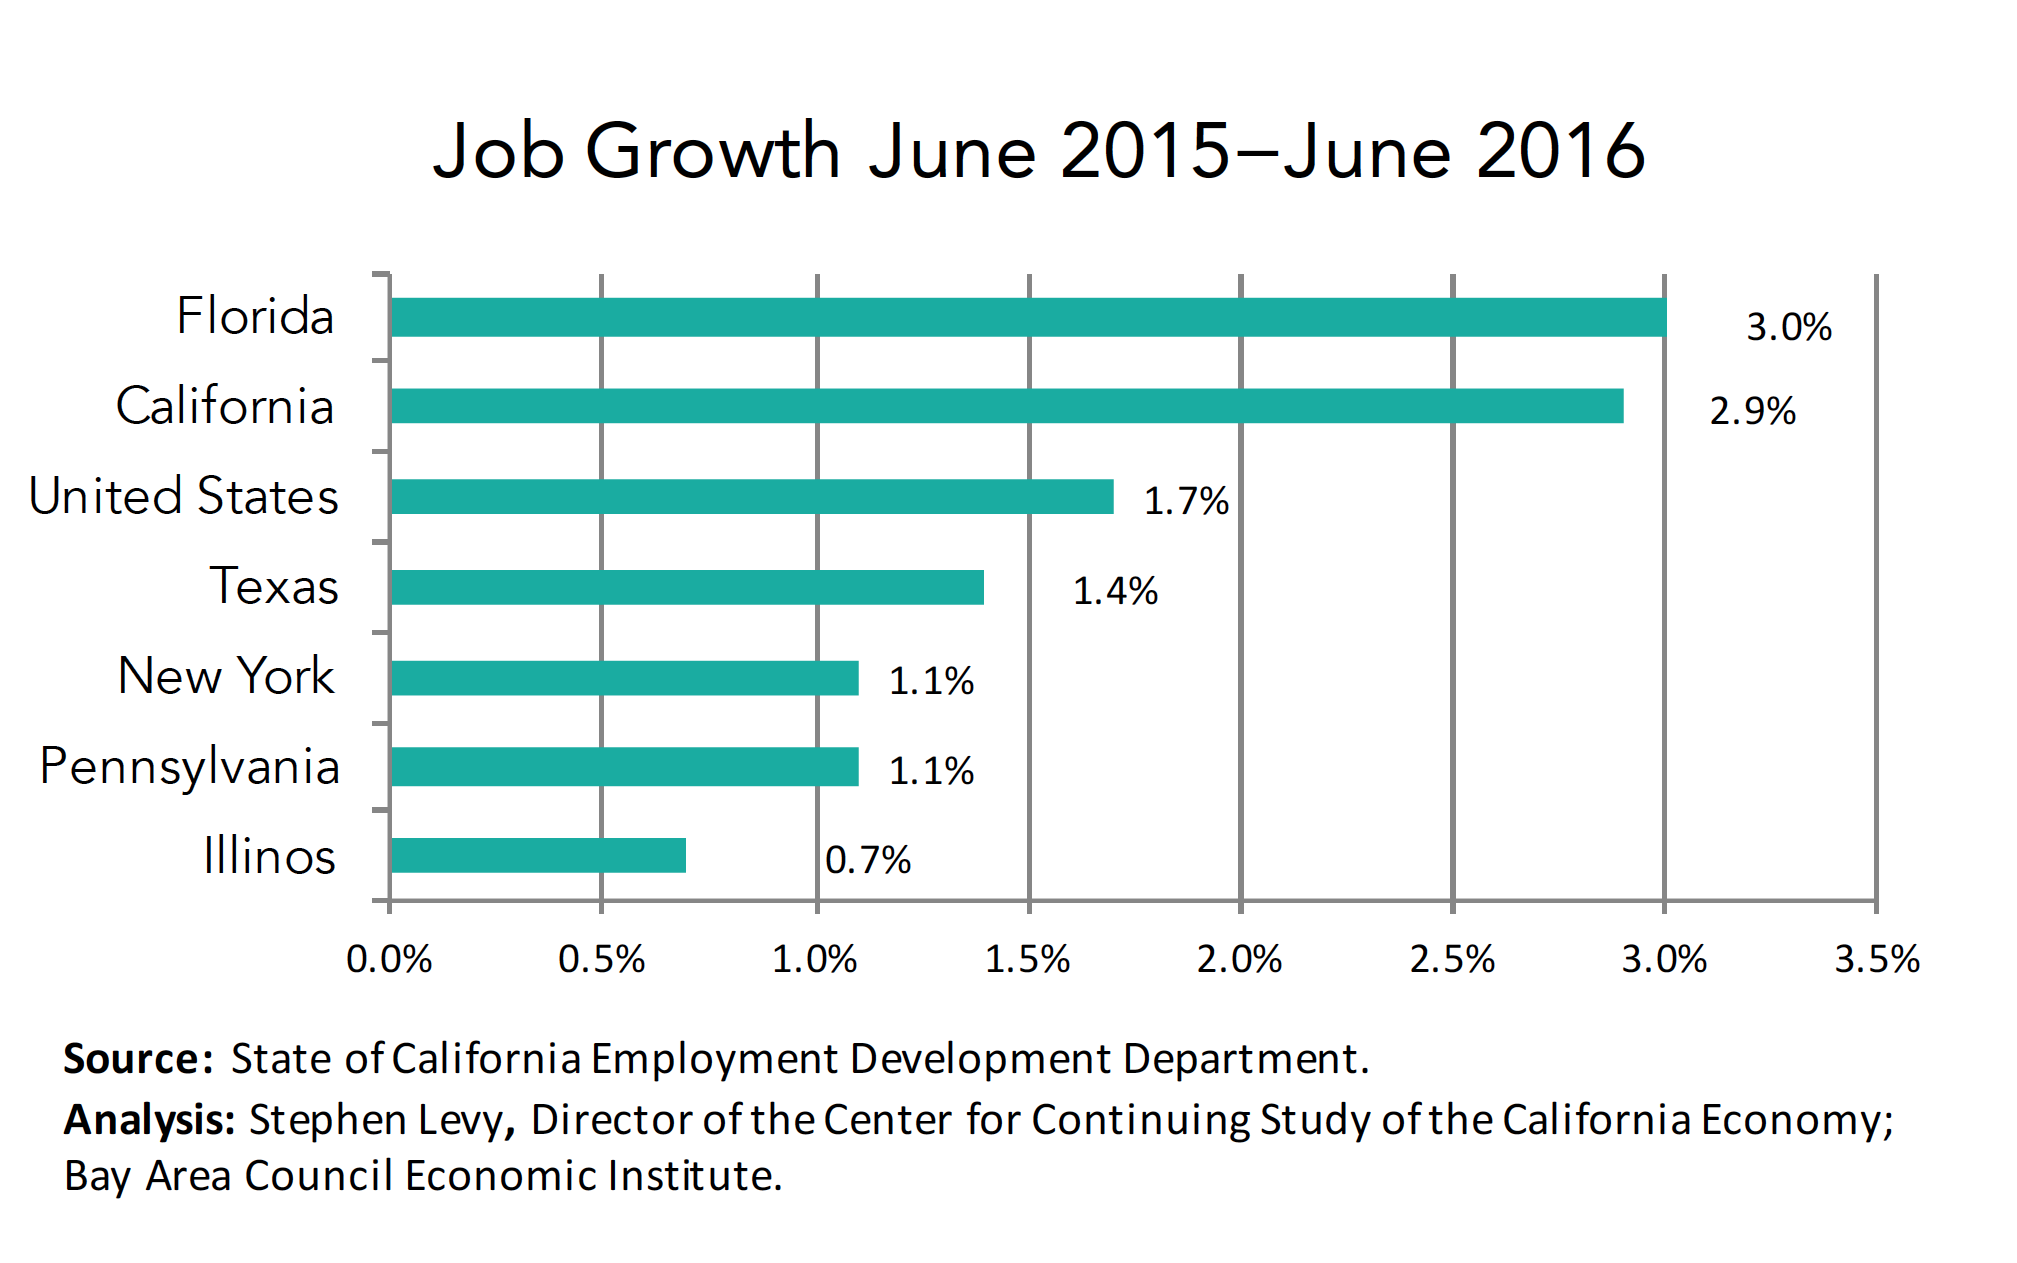
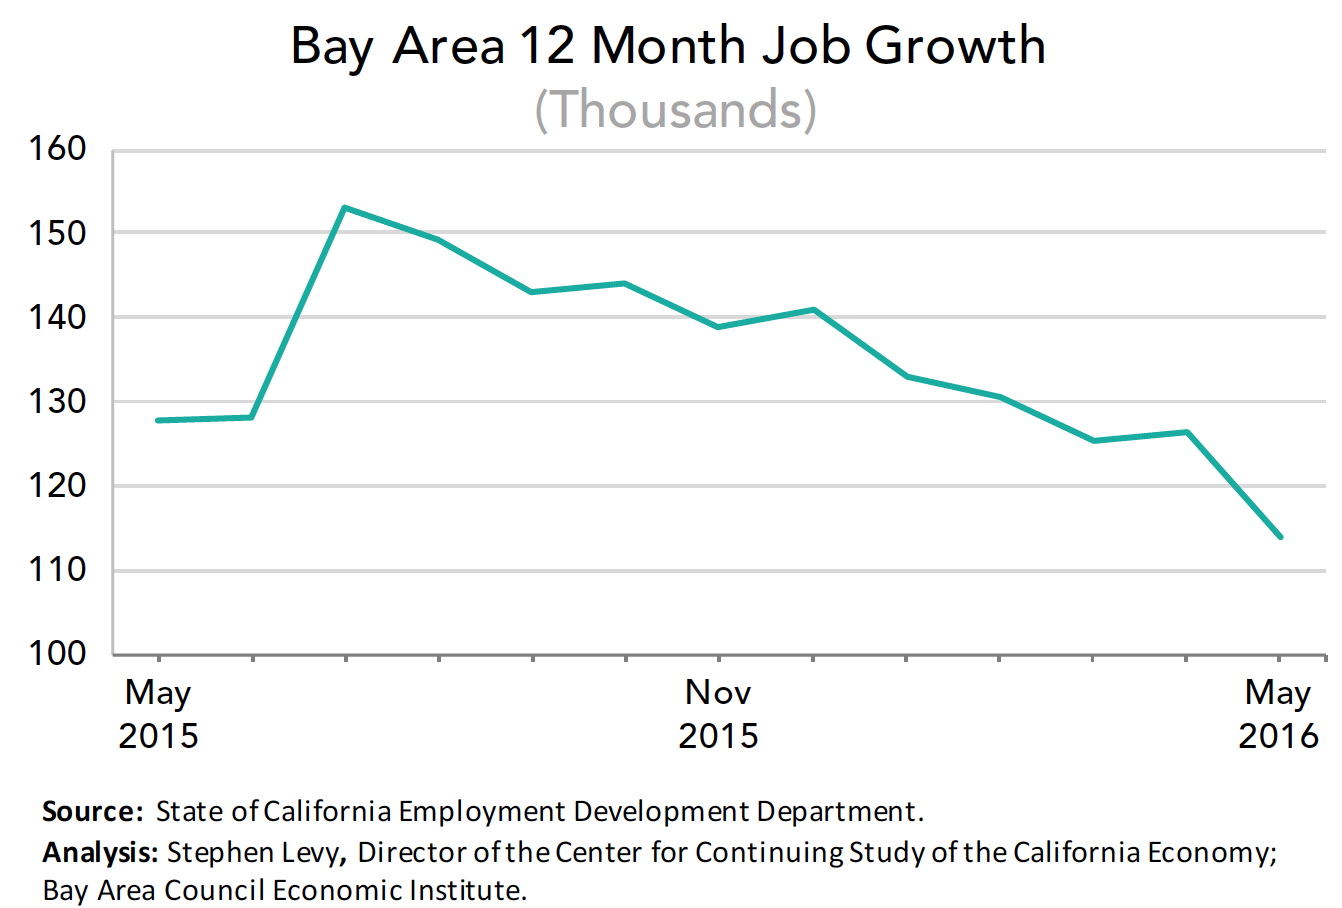
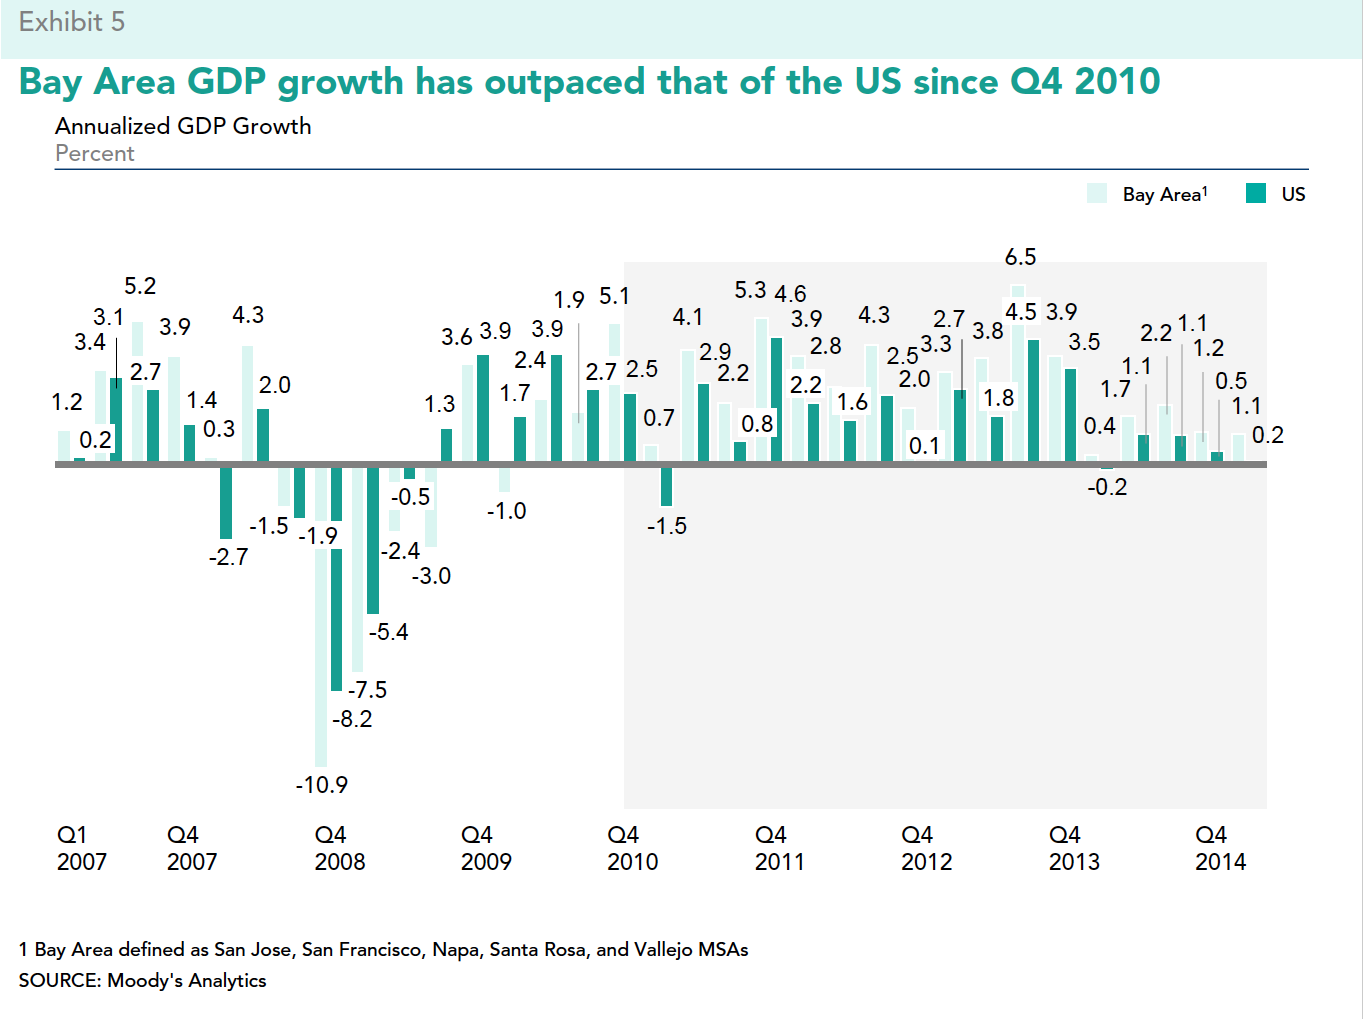
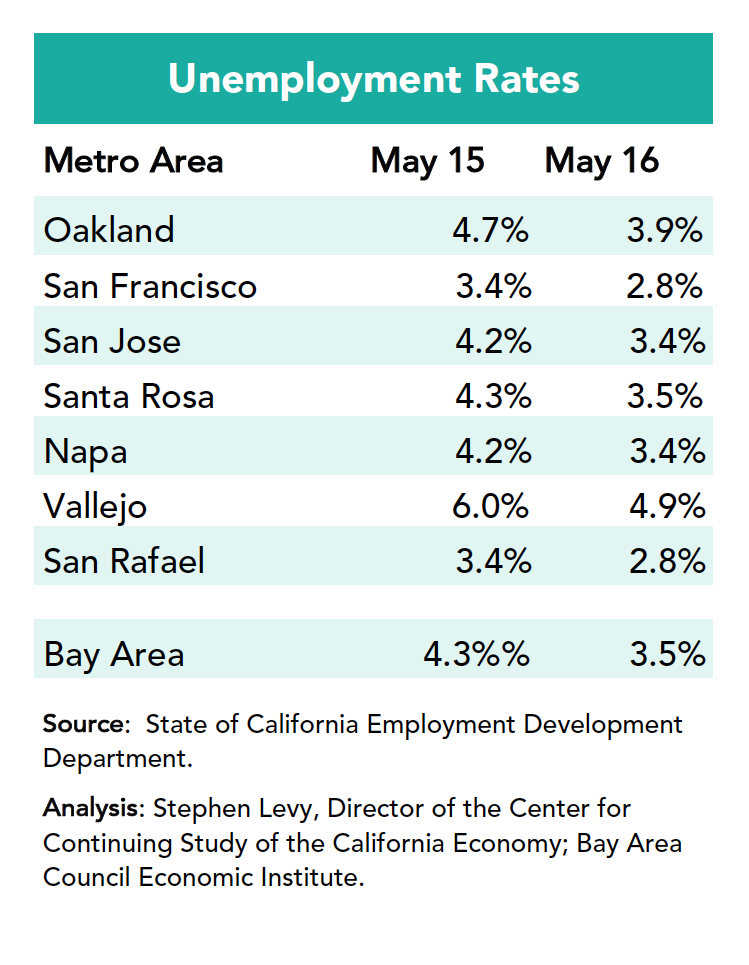
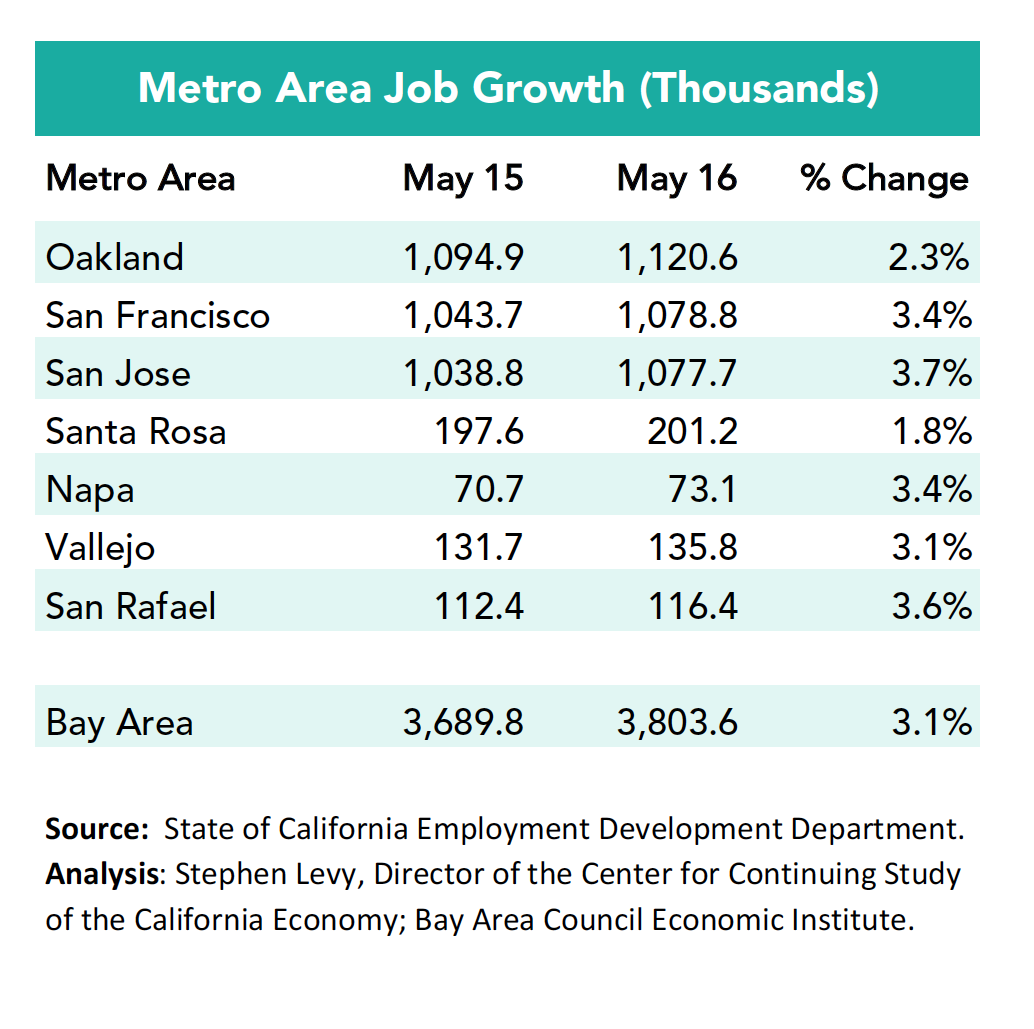
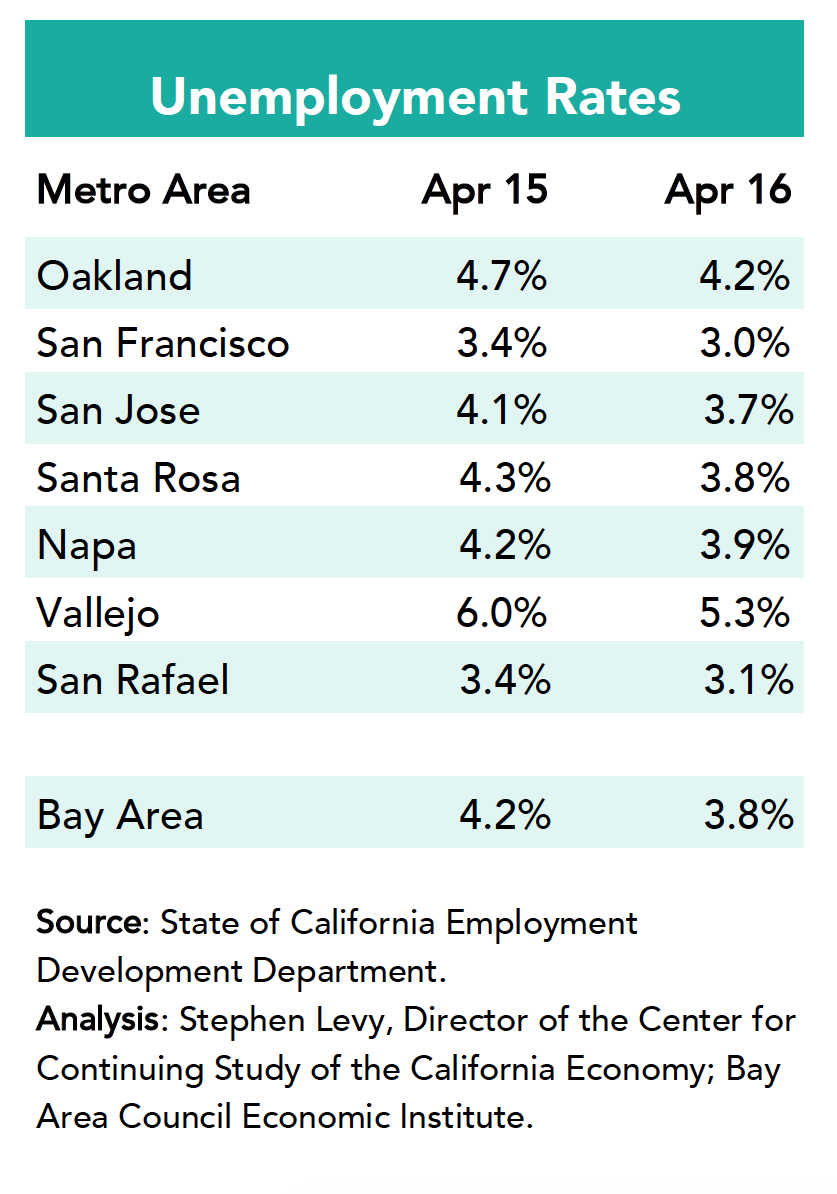

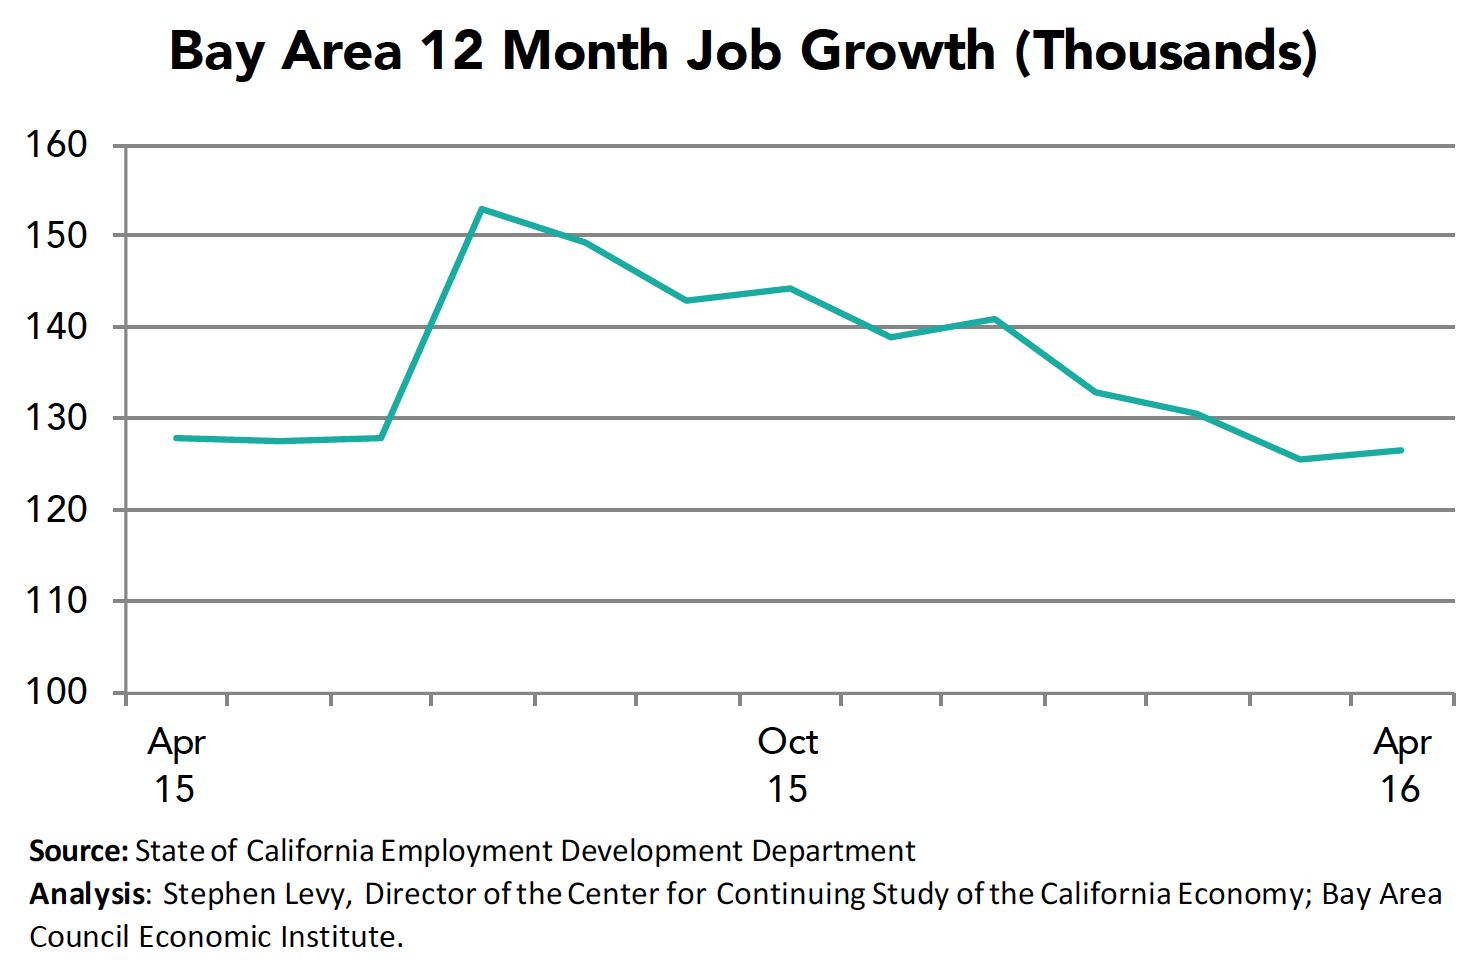
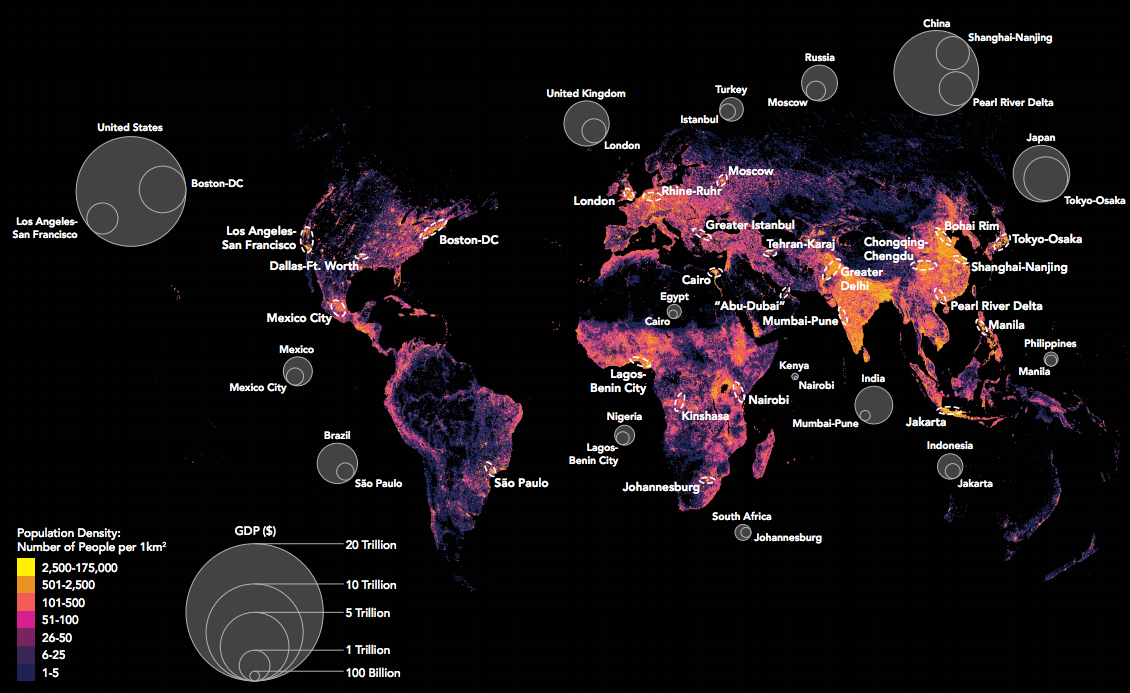
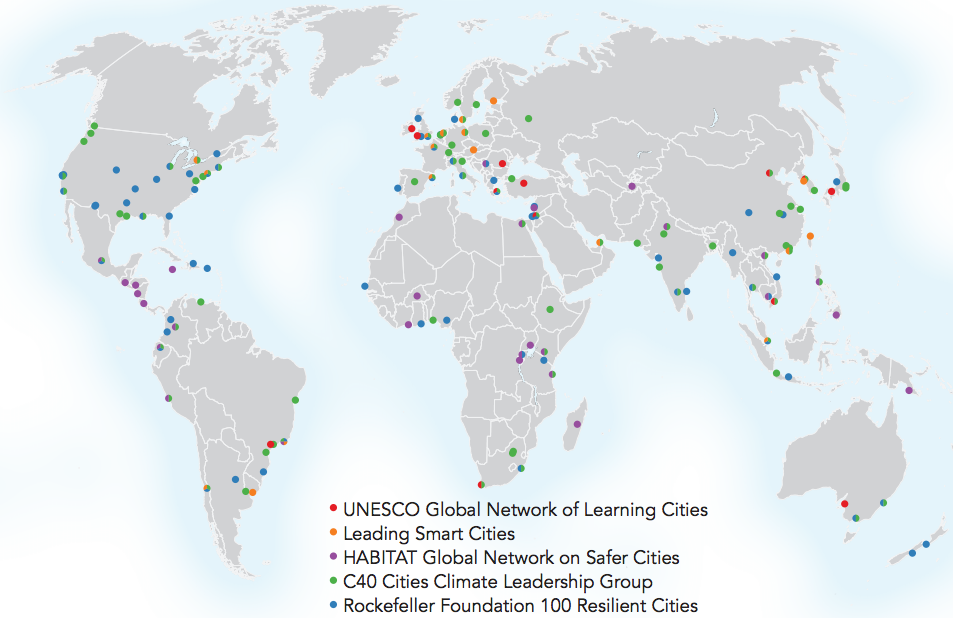
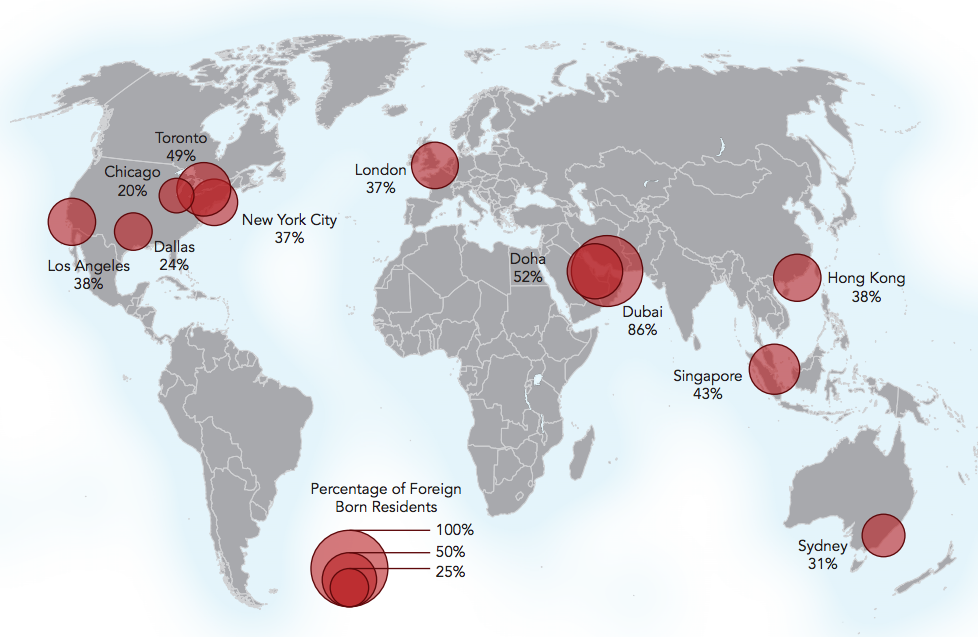
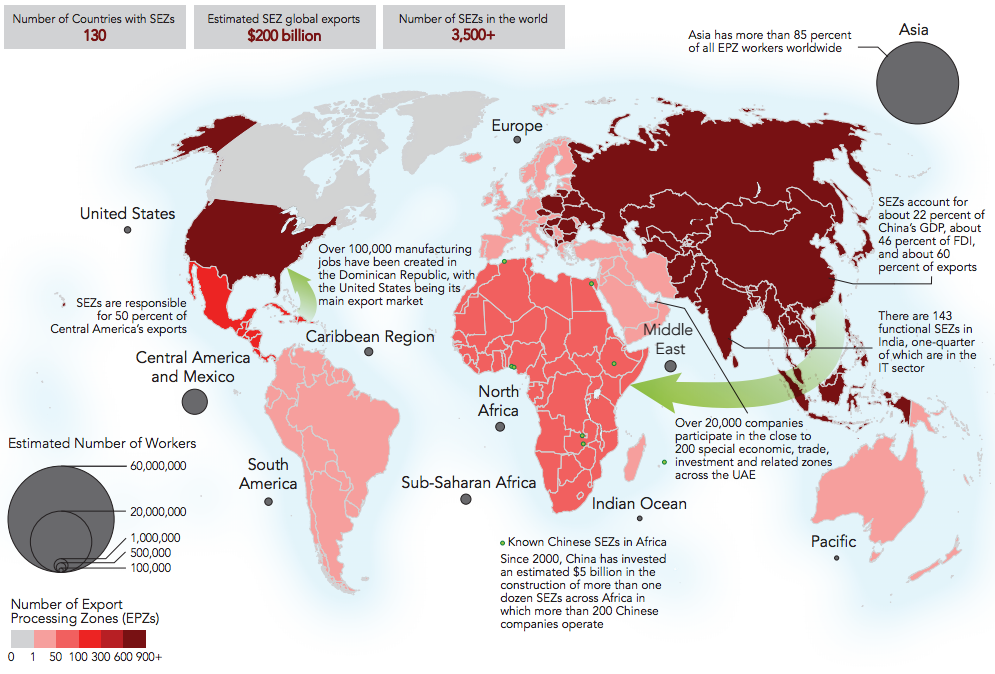
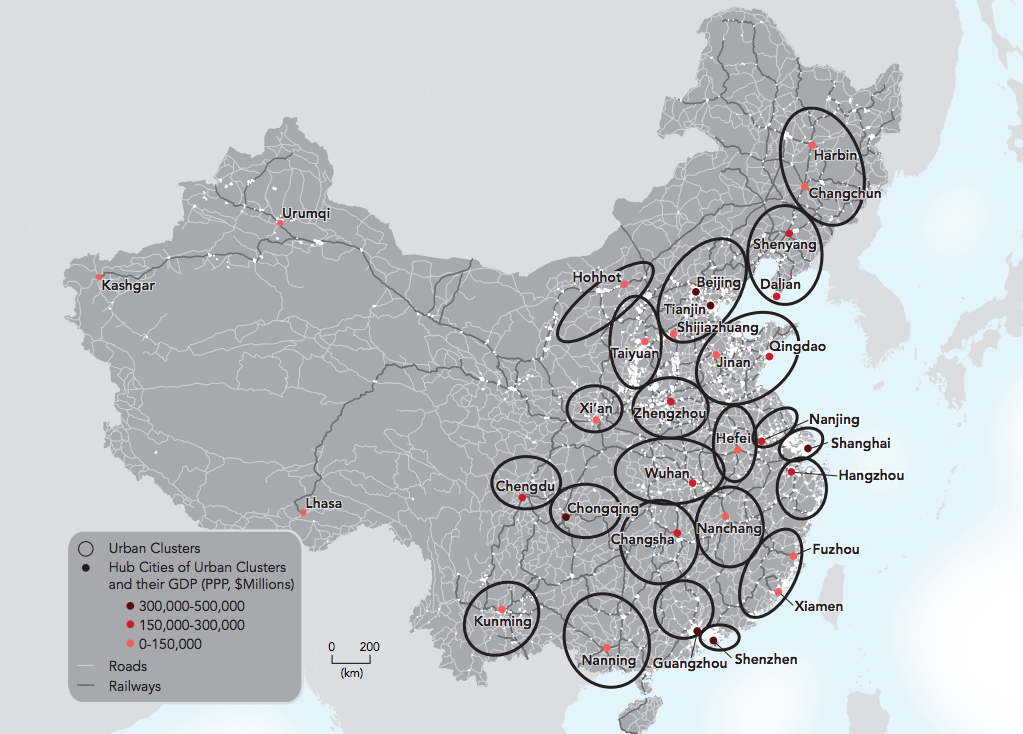
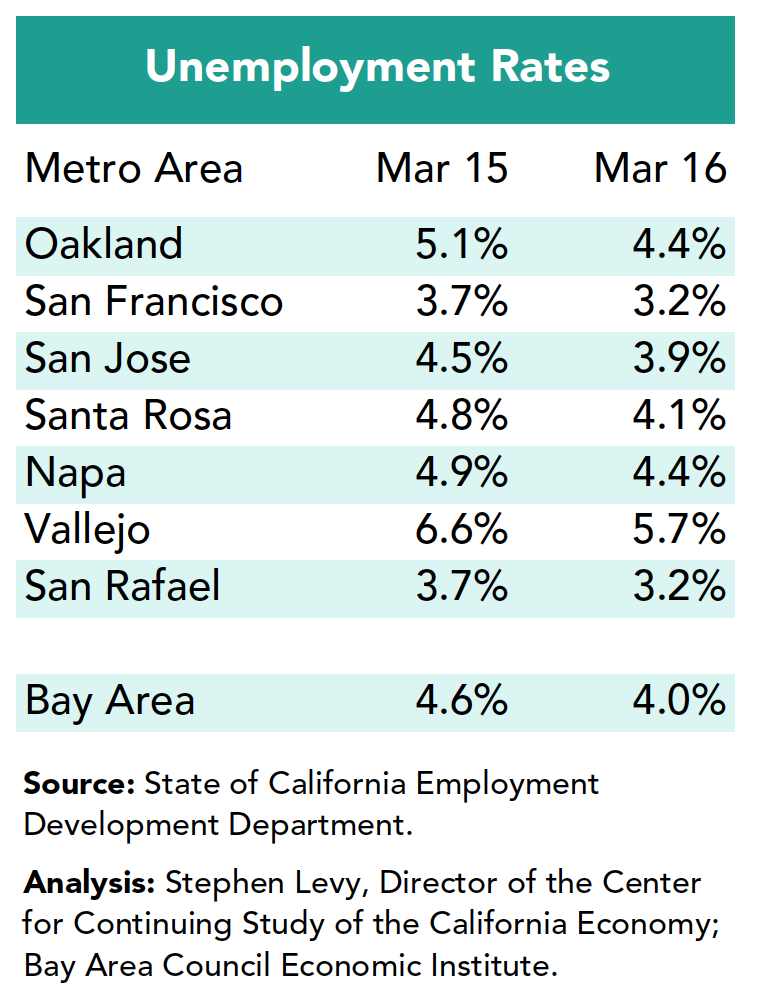
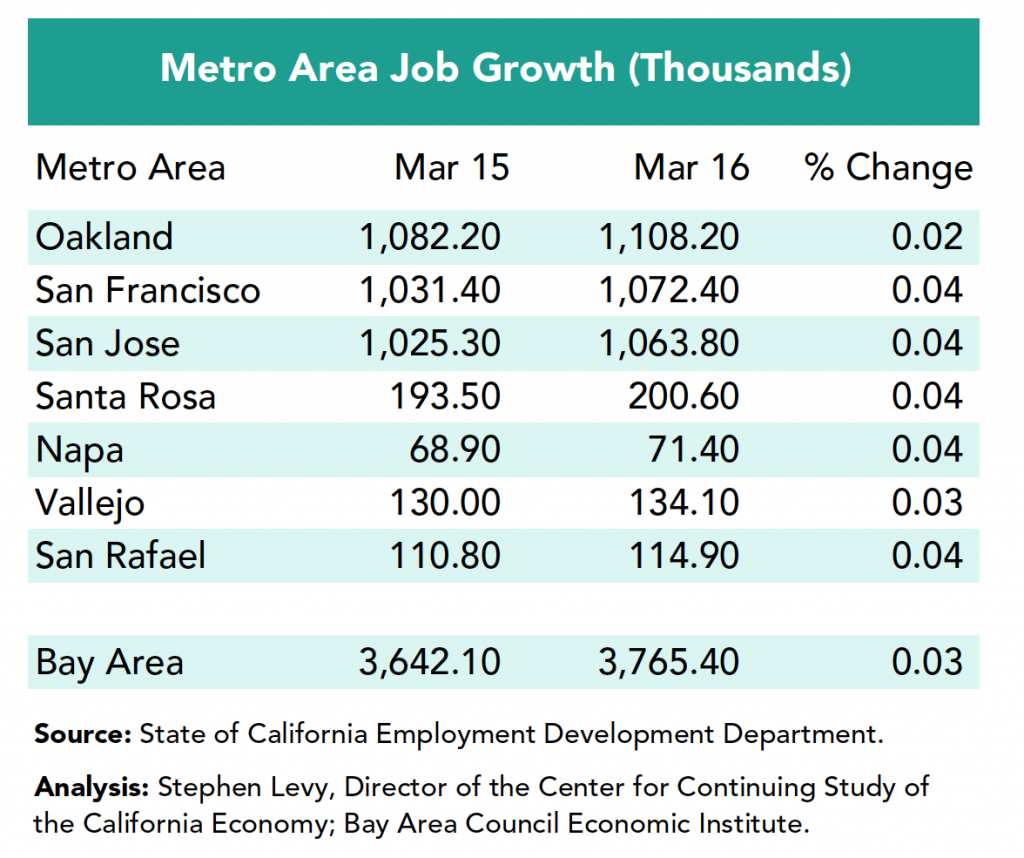
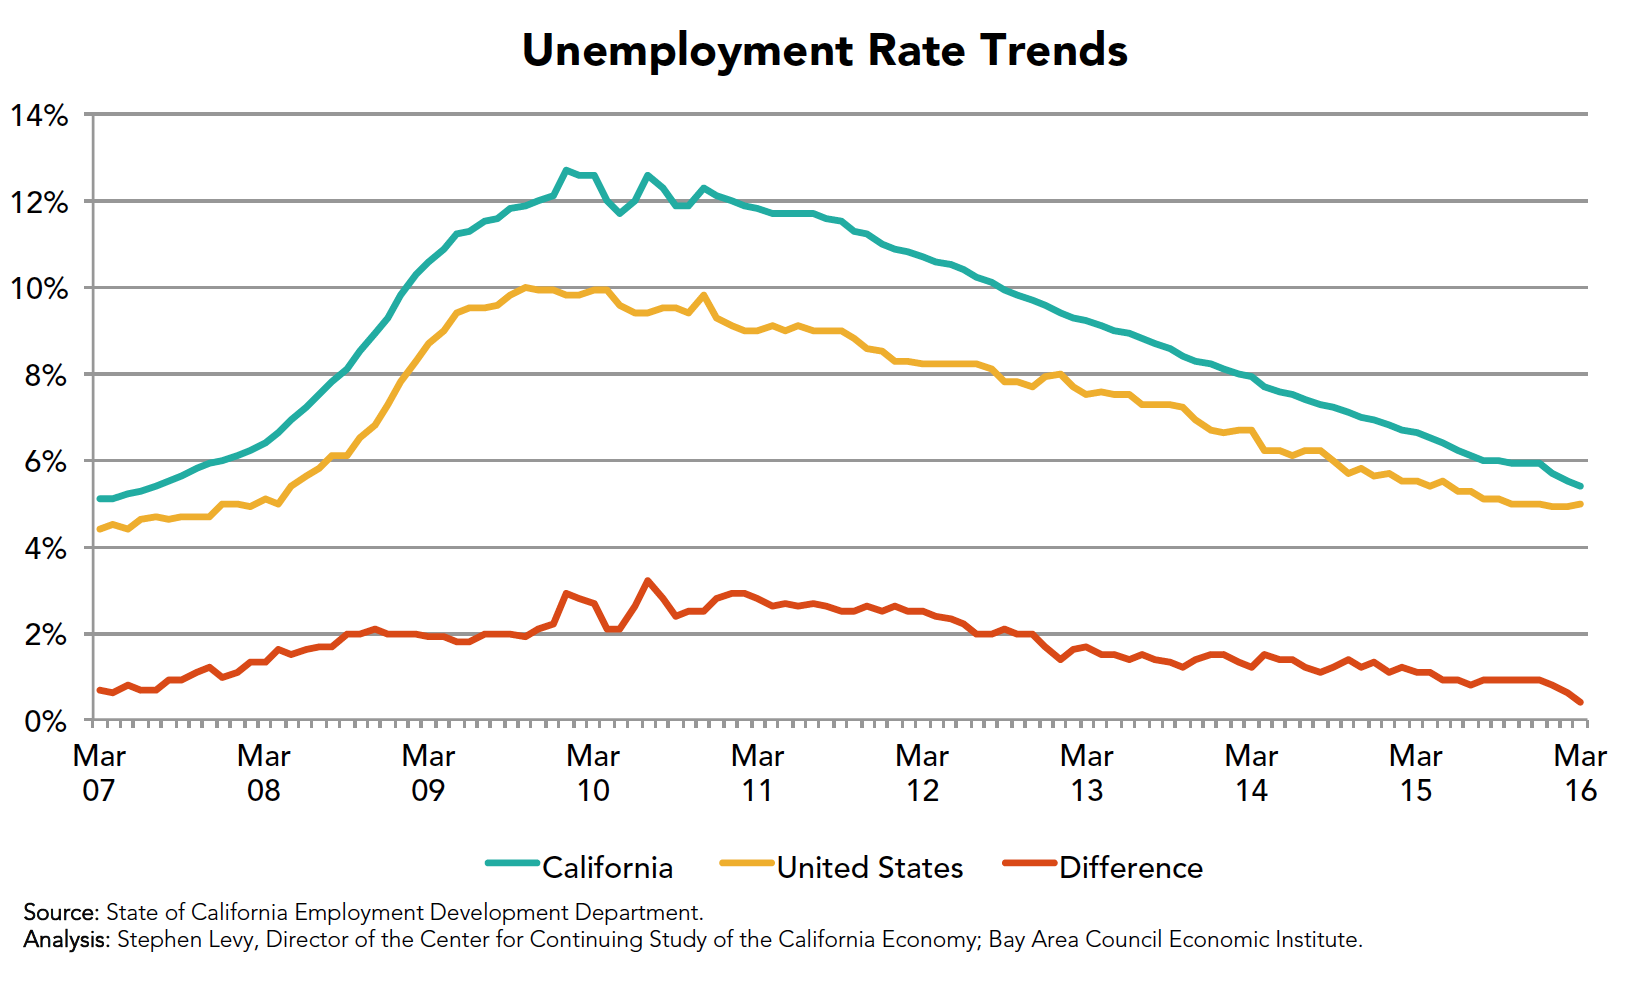
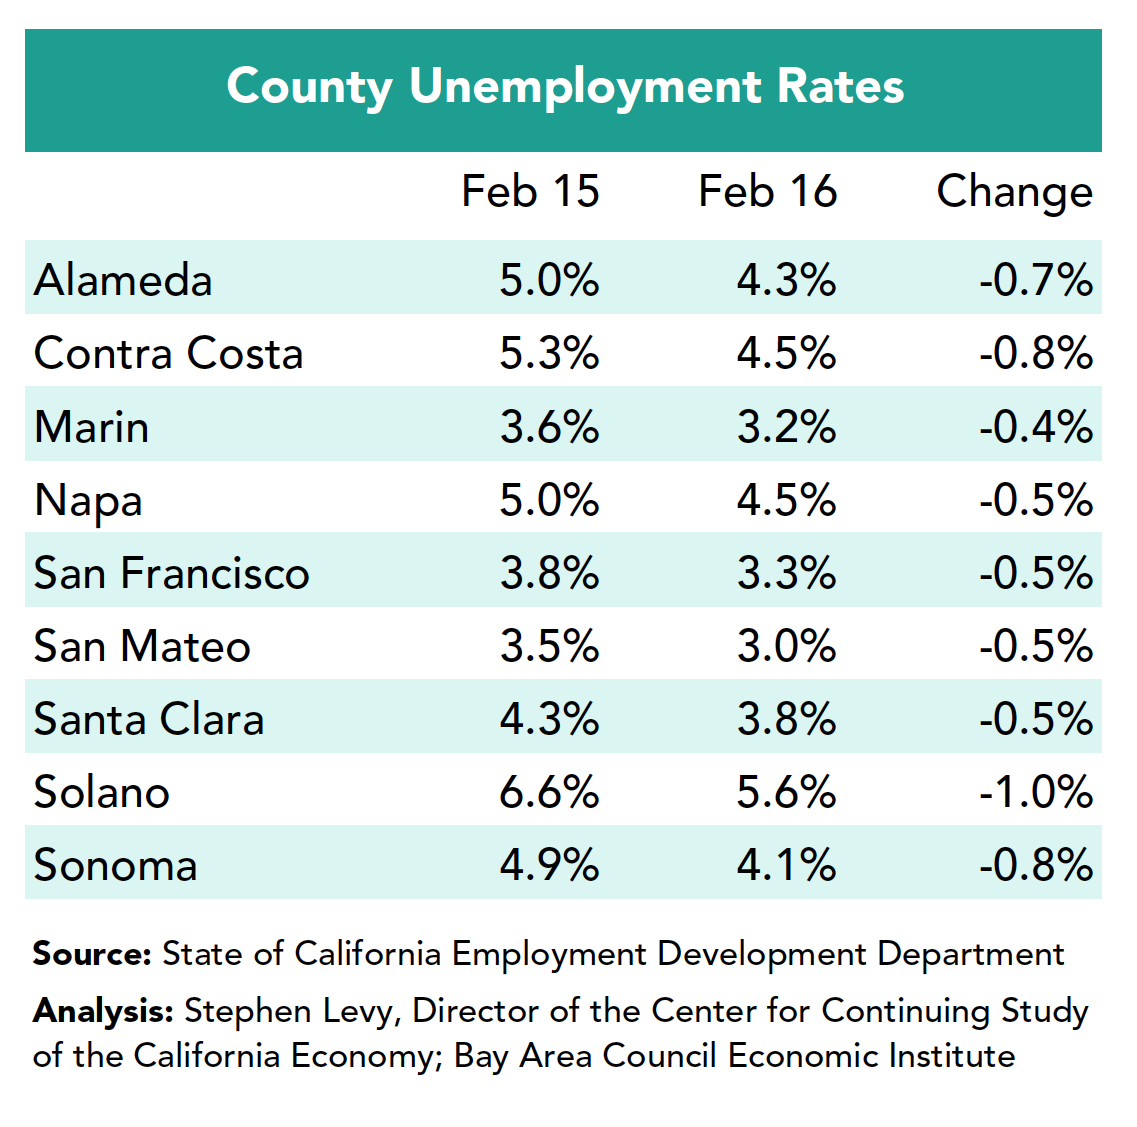
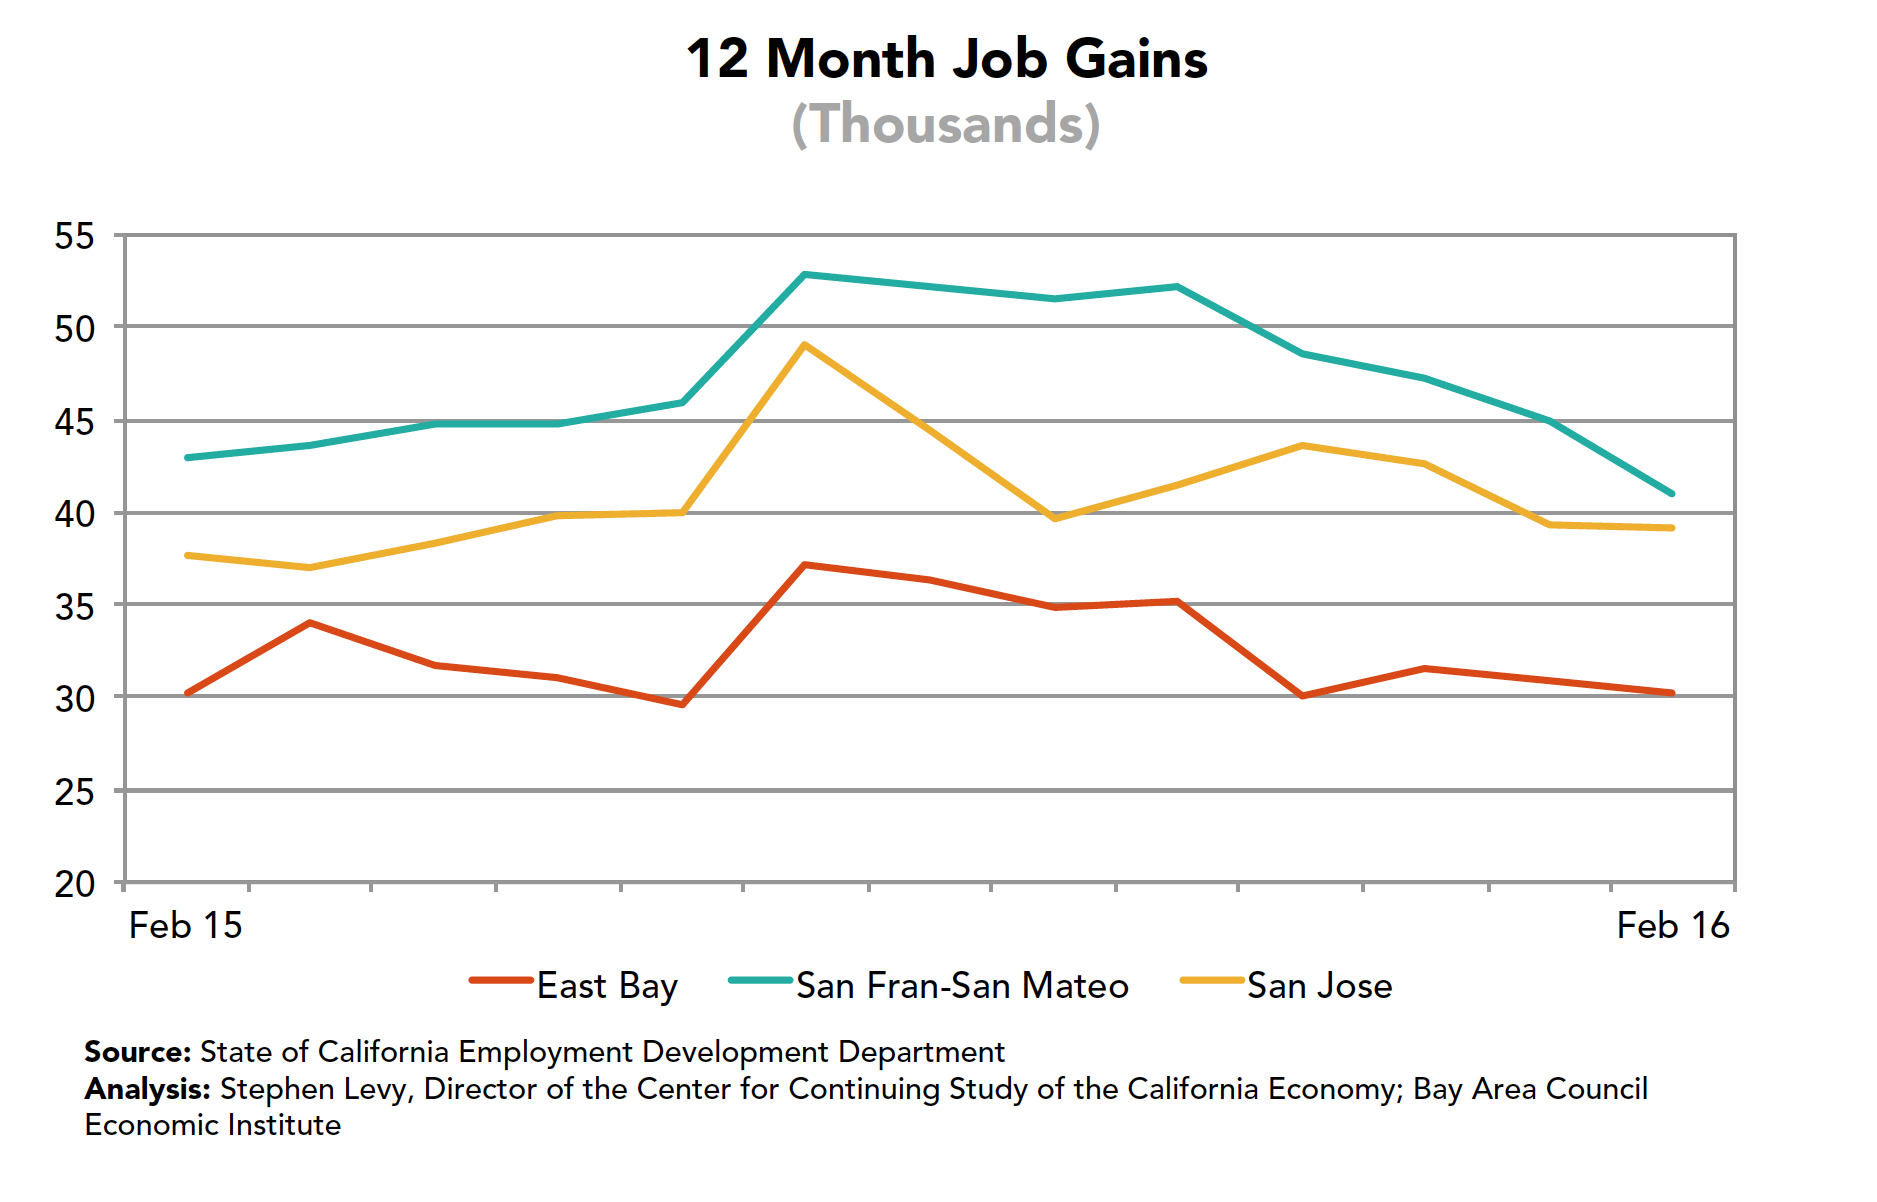
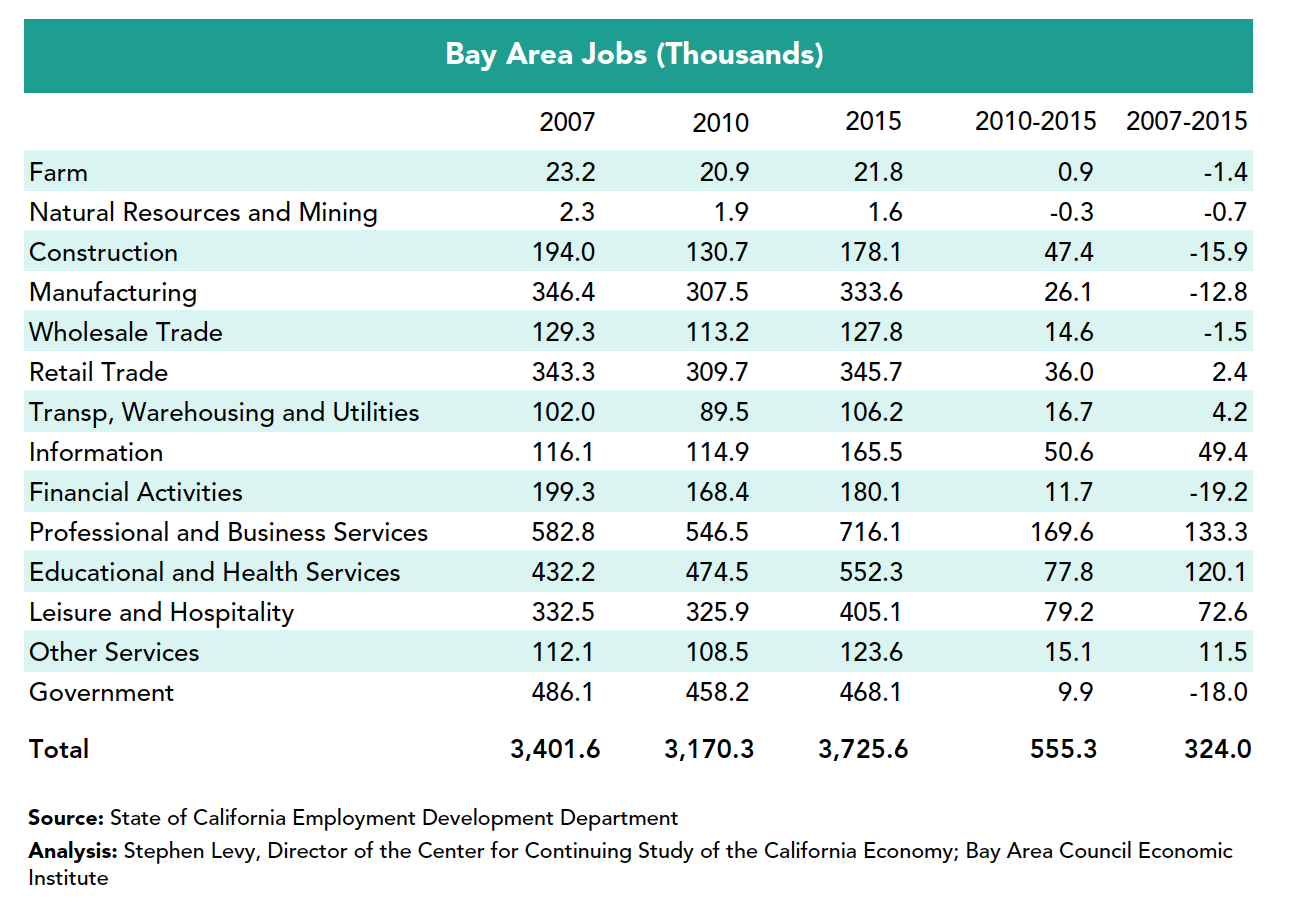
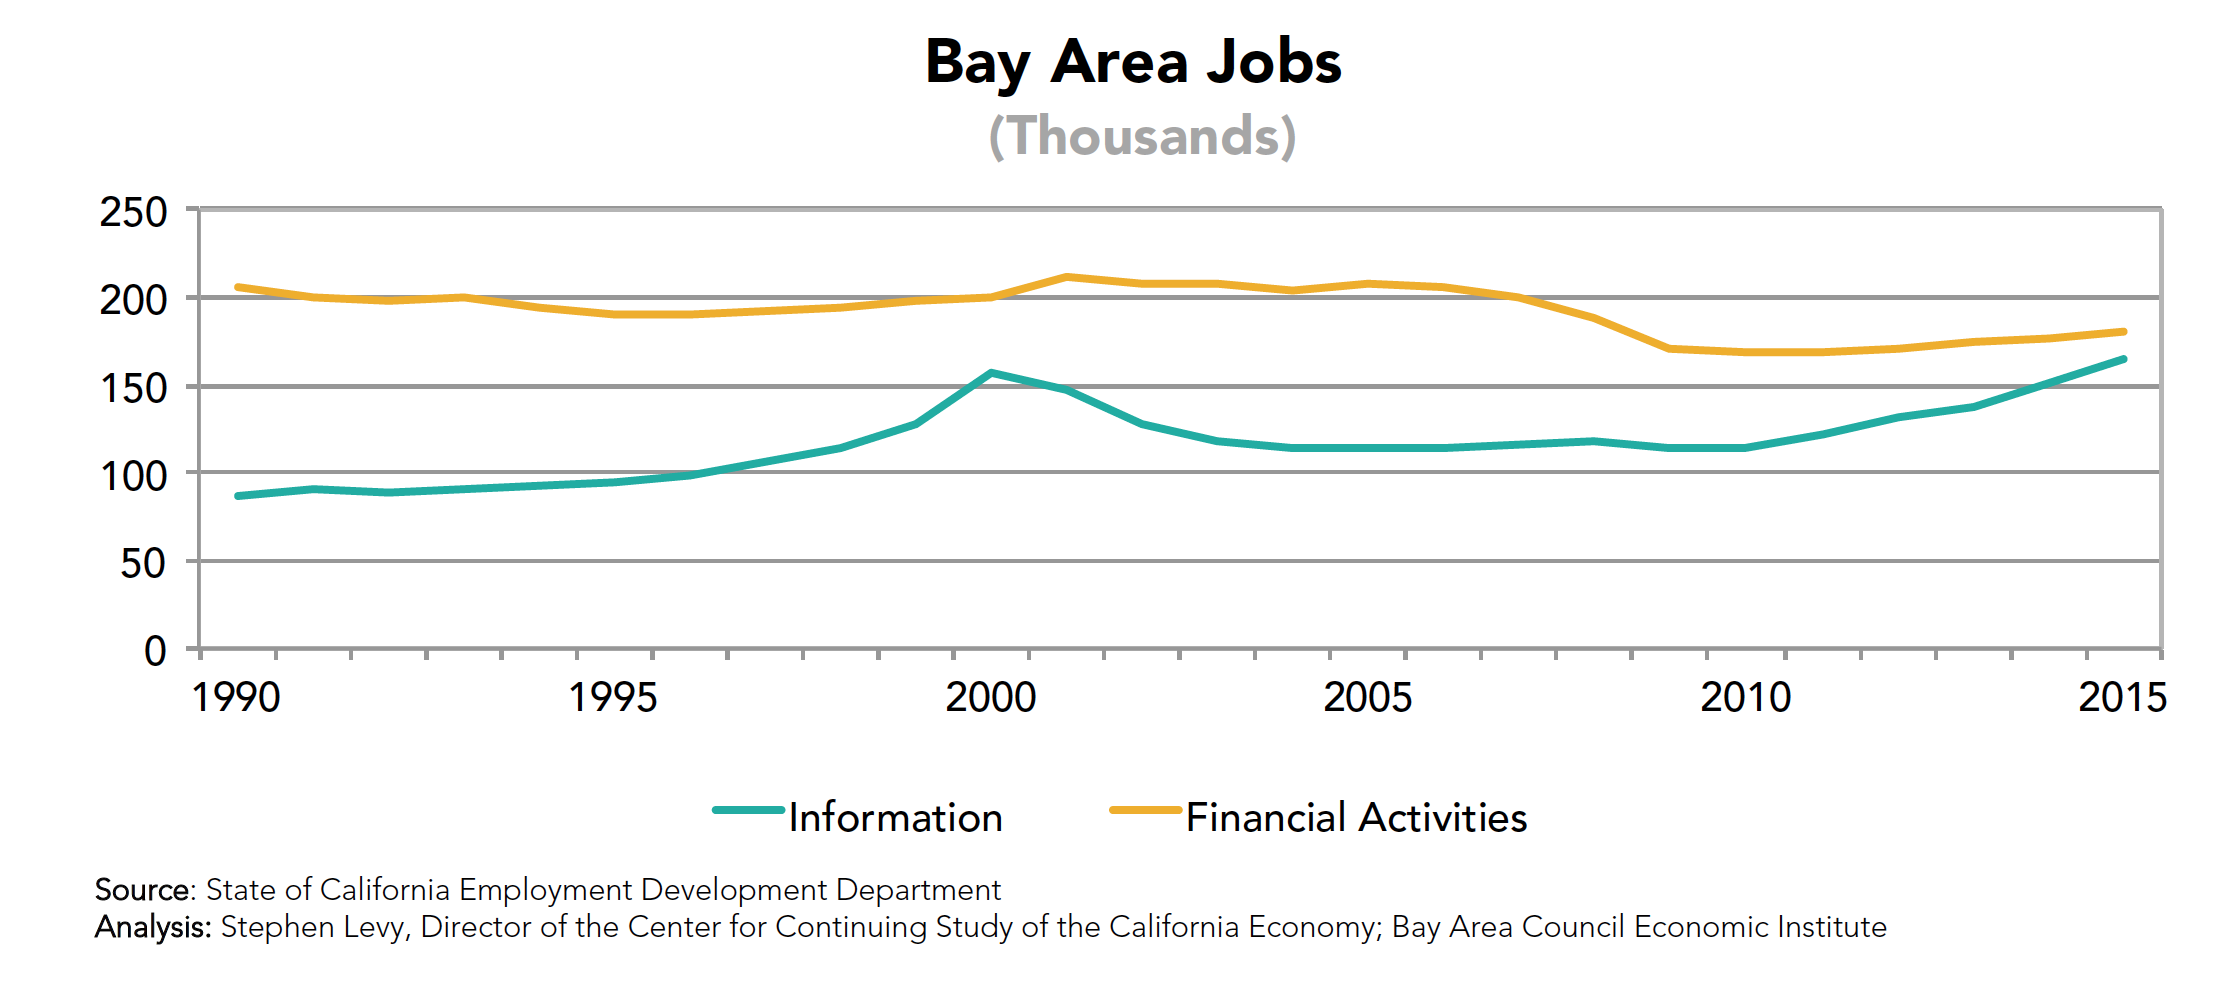
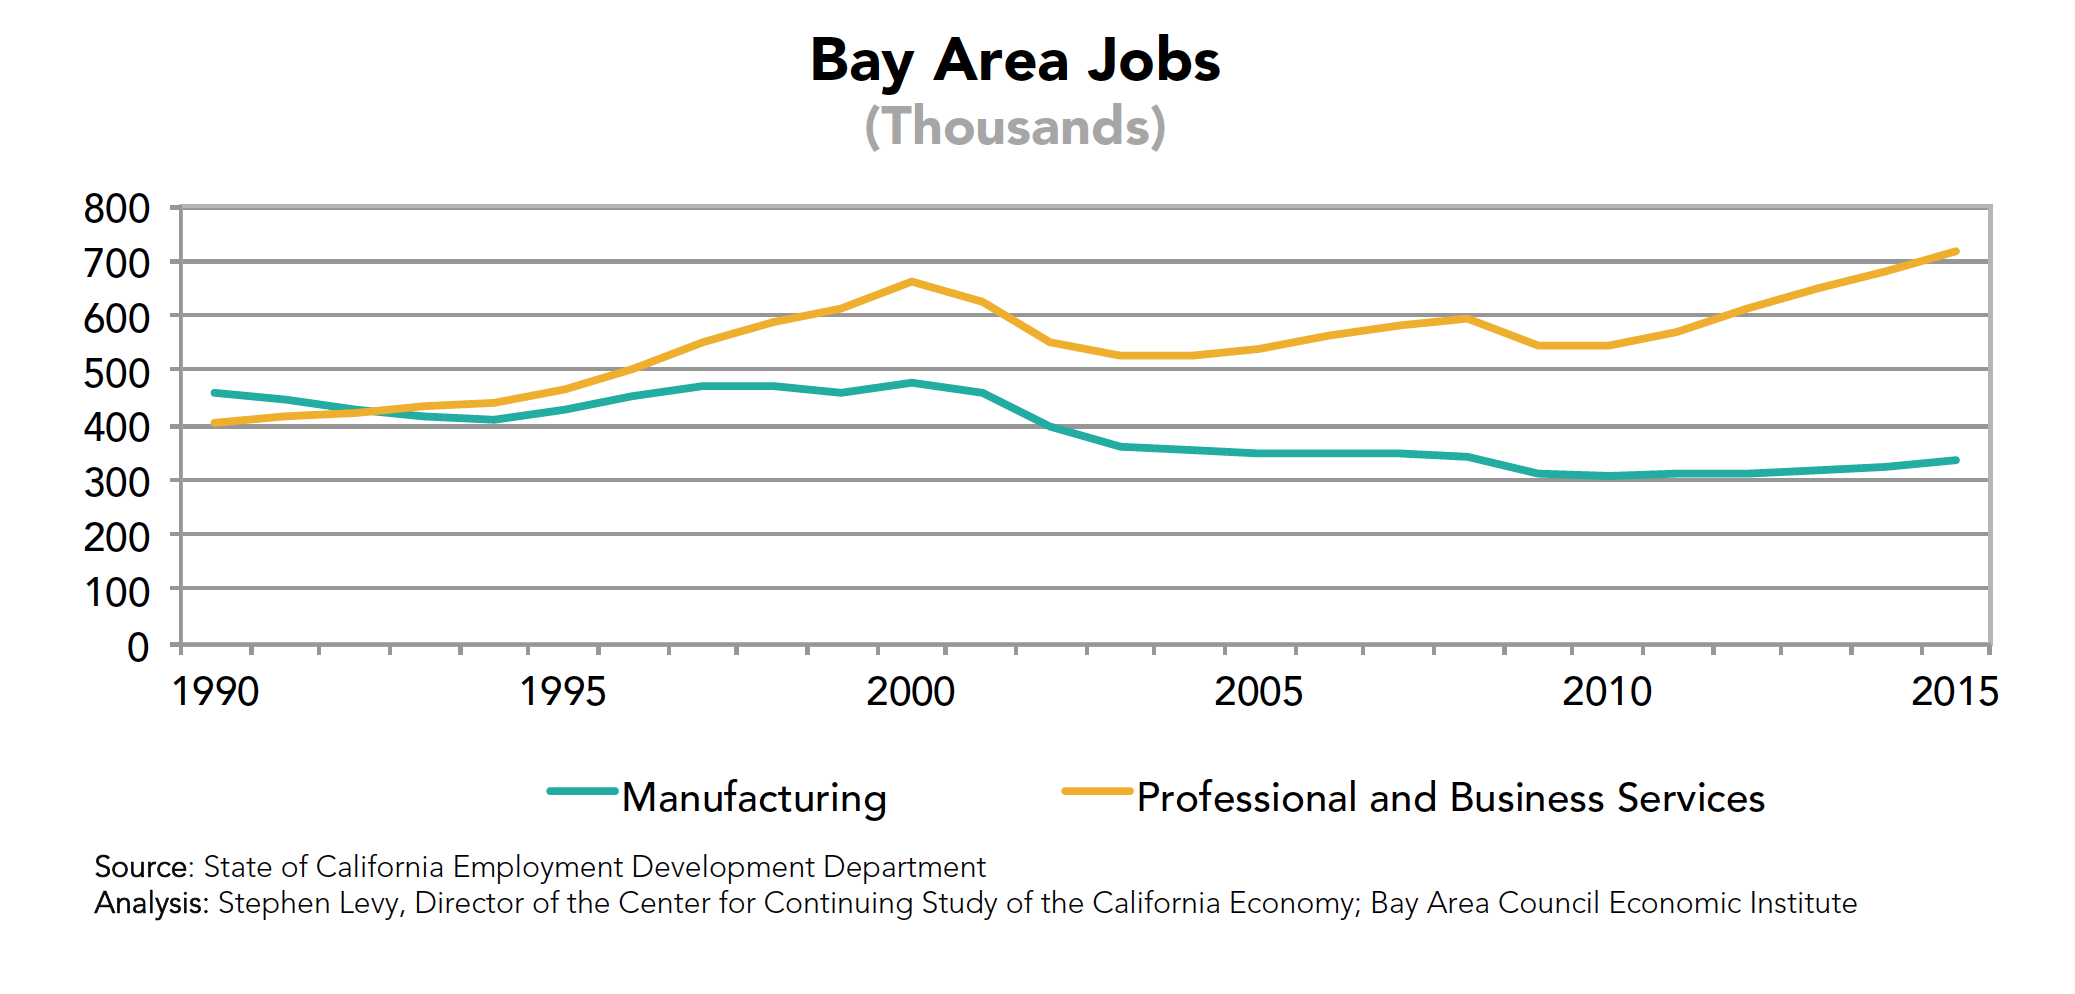 Below we see another major transition in the region’s industry structure.
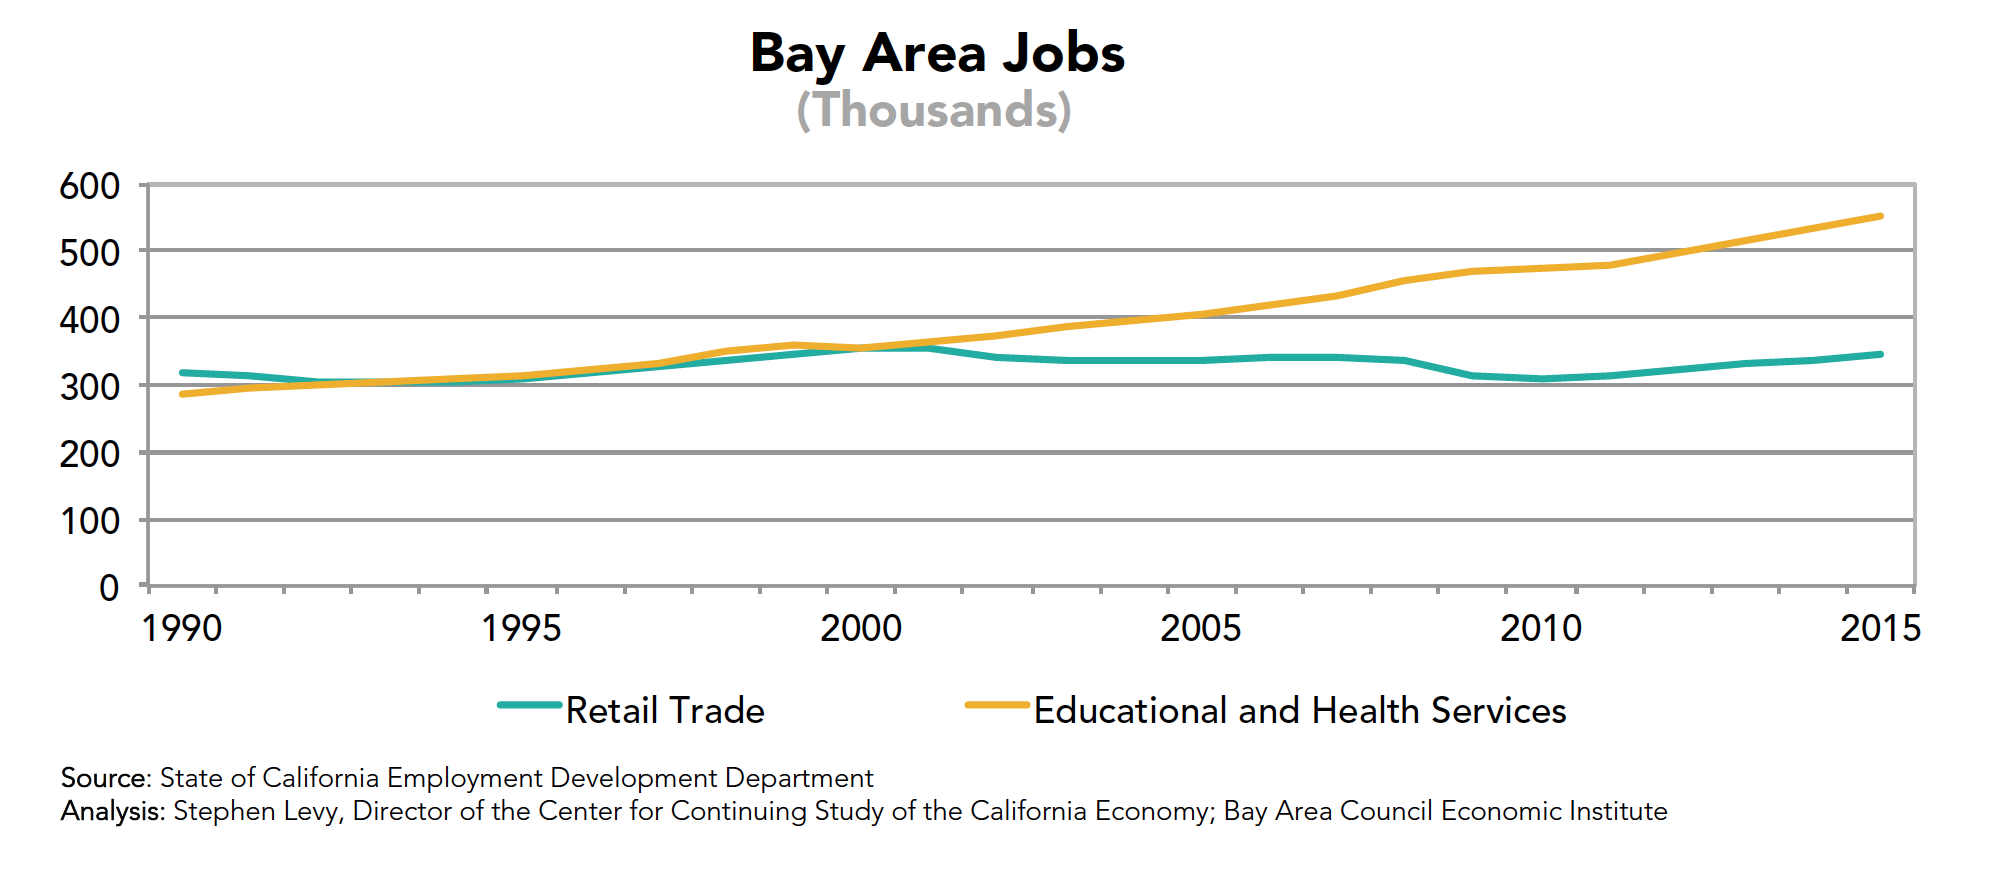 In 1990 there were more jobs in Retail Trade than in Educational and Health Services. Since then retail jobs have hardly changed while jobs Educational and Health Services (mainly in health care) have nearly doubled.