June 11, 2020
The COVID Economy
As the Bay Area completes its 13th week since the original shelter-in-place order was put in place, the policy discussion has shifted from coordinating emergency response to COVID-19 toward questions about reopening and economic recovery. On Tuesday, May 26 Governor Newsom announced California would begin moving into Phase Three of the state’s four-step reopening program. Many Bay Area counties have been more cautious to reopen—some still not allowing restaurants with outdoor seating—as health experts fear opening quickly could cause a new wave of infections.
The economic damage wrought by almost three months of lockdown has been staggering. By May 14, California’s Employment Development Department had processed 4.94 million unemployment claims since mid-March. This amounts to an estimated 25 percent of the state’s pre-pandemic labor force. The state government also faces an untenable $53 billion budget deficit, and projections indicate US GDP may have fallen by up to 12.4 percent since the beginning of 2020.
Facing this daunting outlook, the central question remains whether there is a rapid rebound for the economy in store, or if high unemployment rates and slower economic growth will continue for some time. The difference between a rebound that takes only a few quarters versus many years is stark, and the economic trajectory that California and the U.S. follow will be heavily determined by the federal and state policy responses and future virus transmission rates.
While this crisis is unprecedented in human history in terms of the speed of economic destruction, this short analysis looks for insights on the path forward.
Looking to the Past
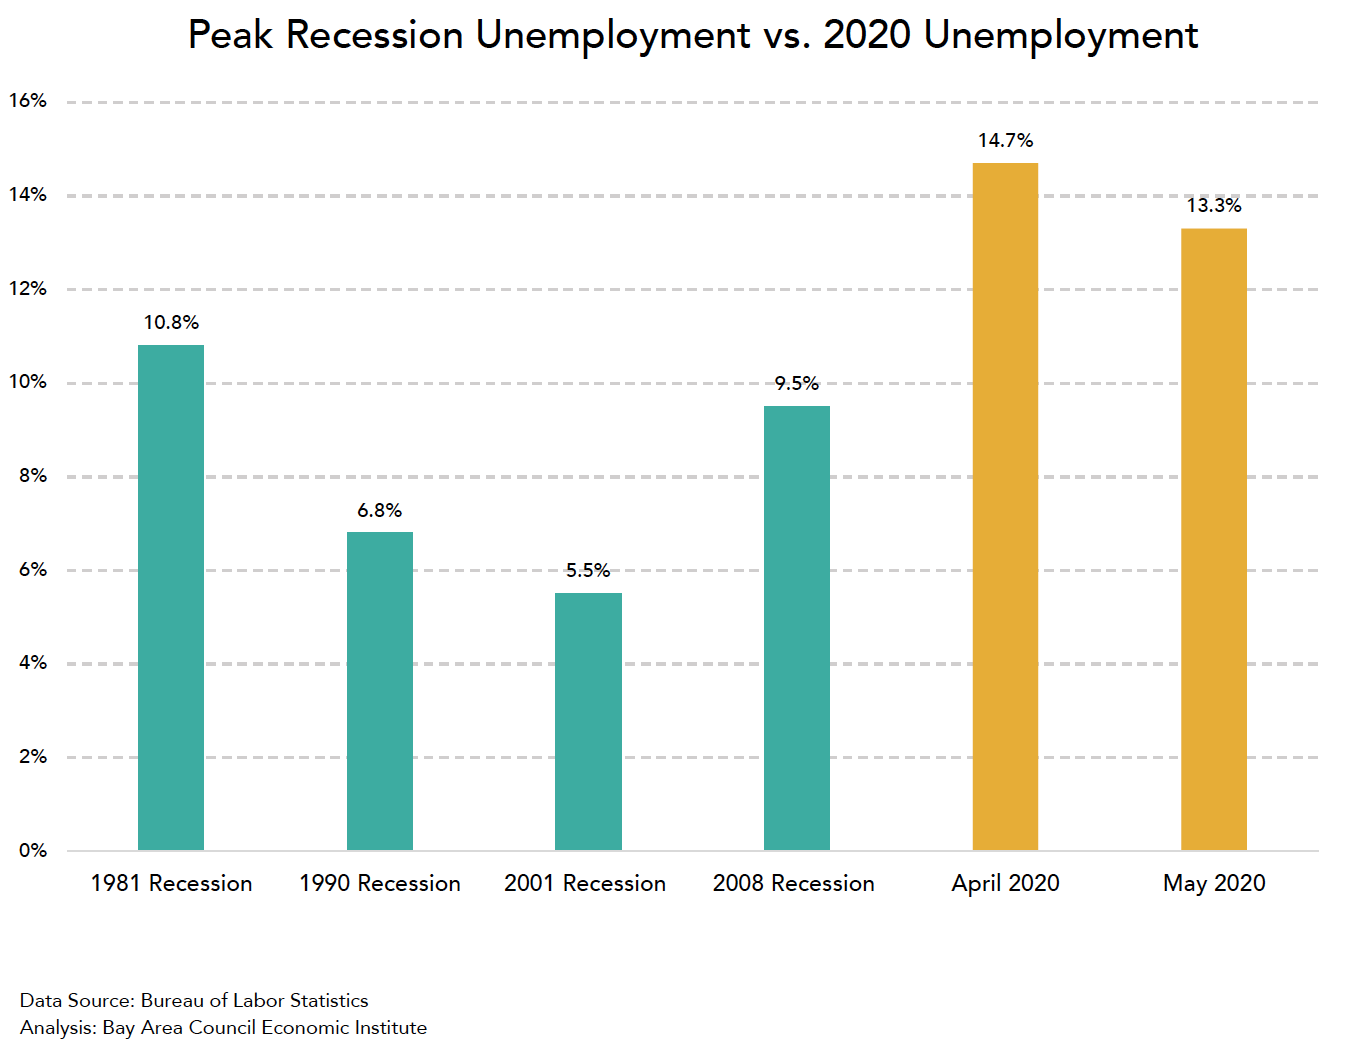
Among comparable economic downturns, the Great Depression bears the only real resemblance to the coronavirus fallout. Today’s unemployment estimates—ranging between 14 and 20 percent in most states for April 2020—are similar in scale to the 25 percent unemployment rate at the height of the Great Depression. It is instructive to note that the Depression economy was eventually stabilized by public works projects and government-sponsored employment in the New Deal.
More recently, the recessions of the last four decades have shown the increased power of monetary policy in driving economic change. The 1981 Recession was primarily a human-made contraction designed to curb inflation at the cost of jobs, though economic rebound was fast and job losses were mitigated relatively quickly. The 1990 Recession was much milder than its 1981 counterpart and resulted in a shallow divot in employment levels. However, though the recession ended in mid-1991, it would take an additional year for unemployment levels to begin falling.
The 2001 Recession is harder to attribute to any one factor. However, while it was relatively inconsequential from a GDP perspective, the recession caused a severe drop in employment that failed to fully recover through the early 2000s and peaked at 6.3 percent in June of 2003.
Policy intervention during the Great Recession closely mirrors the types of economic response implemented during the current pandemic. Then, as now, the Federal Reserve announced a series of interest rate reductions meant to keep the economy from free fall. The American Recovery and Reinvestment Act of 2009 also channeled money to affected businesses, predominantly banks, and individuals in the same way as the CARES Act aid package passed in March does. However, the 2009 policy response was largely meant to stimulate economic growth—in fact, the recession was technically over by June 2009—while the CARES Act of 2020 was largely a lifeline to small businesses and unemployed individuals meant to replace some lost revenues and wages.
Notwithstanding the 2001 contraction, a general trend can be found in each of these examples that is supported by economic theory. Namely, a more severe decline in output tends to lead to a greater and more prolonged drop in employment levels.
Looking at Potential Shapes of Recovery
Most downturns have also been the results of several identifiable economic factors. However, the pandemic means consumer confidence, community health, and supply-chain stability will be intimately connected with economic recovery.
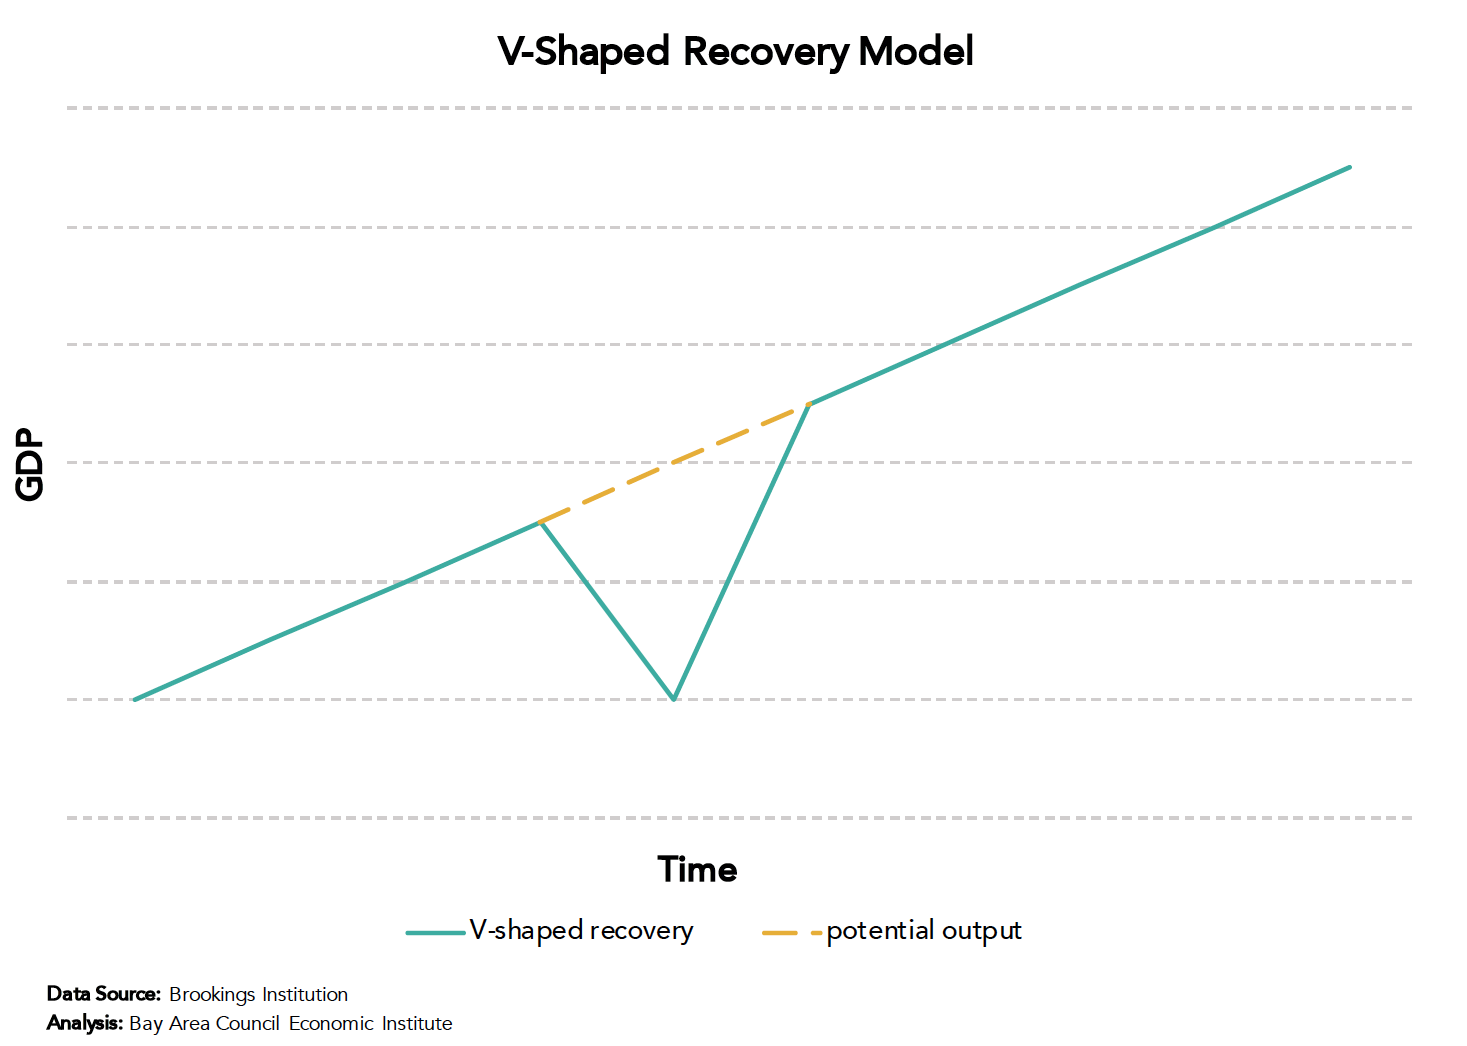
What will recovery look like then? Economic optimists—including those in the White House—hope for a “V-shaped” recovery. Proponents of a V-shaped recovery point primarily to fast public response in the form of stimulus and the temporary nature of shutdown as reasons to believe in a rebound. As the economy reopens, a V-shaped recovery depends on consumers returning to—and potentially exceeding—their pre-COVID buying patterns and businesses hiring back significant percentages of employees that have been furloughed or laid off. The stock market rally through April and May, with the S&P 500 erasing its yearly losses on June 7, combined with declining unemployment filings is positive evidence of a potential V-shaped recovery.
The question of the permanency of furloughs and lay-offs may be the most pivotal unknown that will determine the shape of the recovery. Today, many workers currently unemployed remain optimistic about their prospects of returning to work after the pandemic. A Washington Post-Ipsos poll conducted indicated 77 percent of furloughed workers expect to return to their previous jobs, but a University of Chicago study anticipates only 42 percent will find this expectation fulfilled. The uncertainty of employment, as well as of consumer and business demand, as economies reopen makes understanding the long-term scope of economic fallout difficult.
A longer recovery path points to a form of U-shaped recovery. U-shaped recovery models incorporate slow rehiring trends and future infection fears that reduce economic growth for multiple years. In a report on June 1, the Congressional Budget Office projected potential lost economic output from coronavirus to top $7.9 trillion, with the economy finally returning to potential output in 2029. Early indications of a U-recovery or some combination of U and V-shapes are visible in some post-lockdown countries, including China.
The case for slow recovery has some precedent. Historically, most recessions and downturns in the 20th and 21st century resulted in some form of U-shaped or “swoosh” recovery that endured low output and high unemployment levels for several quarters.

More concerning evidence for slow recovery points to pre-pandemic business weakness as a reason to believe in economic stagnation. A report from the World Economic Forum found that “40% of all US corporate debt was rated BBB, just above junk, going into the crisis” before coronavirus. Rates of business default and bankruptcy due to credit down-rating may therefore rise due to the pandemic. Corporate instability could slow the pace of rehiring even once the economy itself finds a footing. Small businesses have seen ever greater impacts, as their limited cash reserves and concentration in service industries have made them the front line for COVID-19-related permanent business closures.
Conclusion
The fluid nature of the COVID-19 pandemic makes predicting the trajectory of the US economy hypothetical at best. Placing the coronavirus crisis in the context of historical recessions provides some insight into government response to the current downturn. Predicting the post-COVID economy will also be reliant on understanding the virus’s progression—and responses to it—in the coming months. While a rebound recovery and “back to work” economic model may be achievable, a prolonged recovery increasingly appears to be America’s economic future. If a slow recovery becomes the economic reality, policymakers and businesses will need to both draw on the past and innovate for the future to develop effective responses to limit long-term economic damage.