
Key Findings:
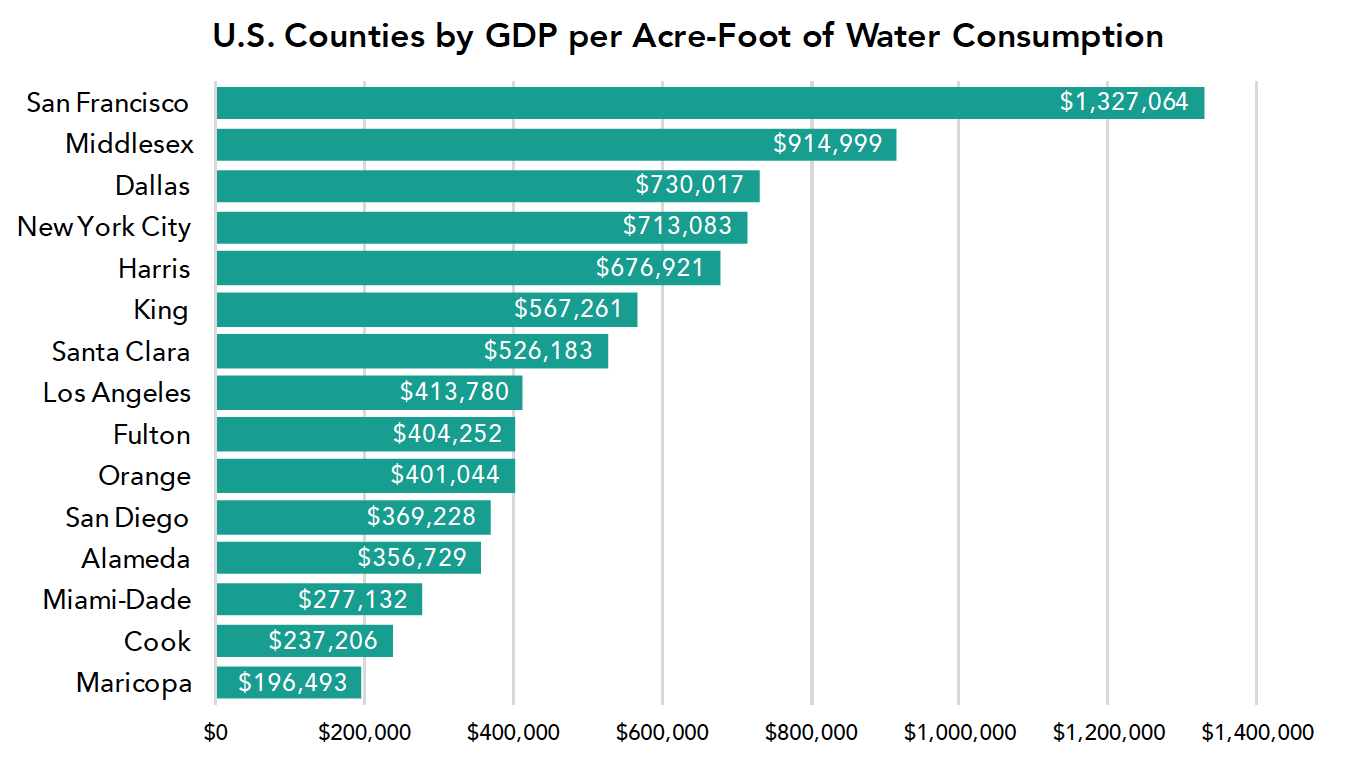
- San Francisco tops U.S. counties in economic value created per unit of water consumed.
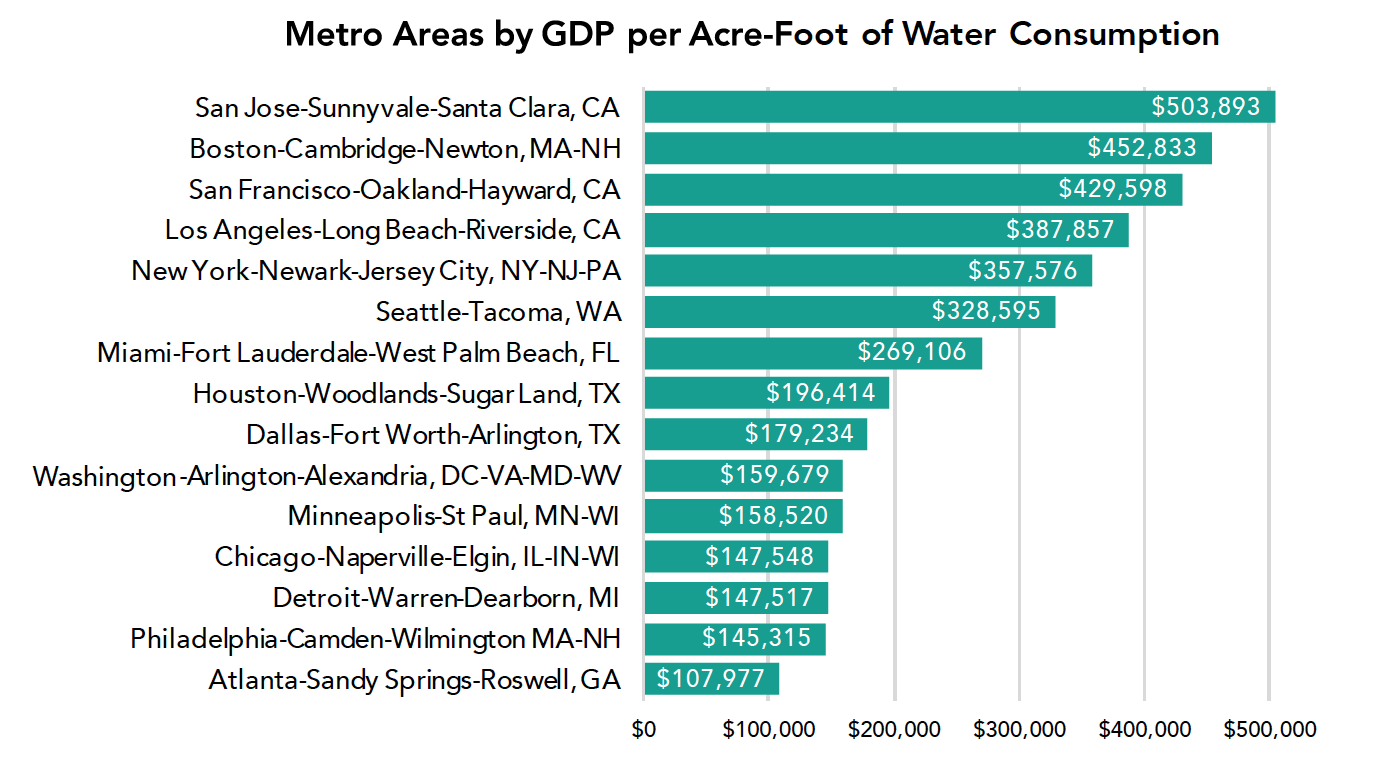
- San-Jose-Sunnyvale-Santa Clara tops U.S. Metropolitan Statistical Areas in economic value created per unit of water consumed; San Francisco-Oakland-Hayward has third highest, followed by the Los-Angeles-Long Beach-Riverside area.
California’s large metropolitan regions, especially the San Francisco-Oakland-Silicon Valley Bay Area, generate more economic value per unit of freshwater consumed than other regions in the United States. The findings result from analysis done by the Bay Area Council that compared annual water consumption data among the top 15 counties and Metropolitan Statistical Areas by gross domestic product (GDP) in the United States.
San Francisco tops U.S. counties in economic value created per unit of water consumed
The City and County of San Francisco produces $1.3 million in economic value for every acre-foot of water consumed, more than any other county in the top 15 metropolitan statistical areas, and 31 percent more value than is created by the next highest value county, Middlesex, Massachusetts. One acre-foot equals 325,851 gallons, approximately the amount of water used by 11 Californians per year. San Francisco’s water efficiency can be credited to its cluster of high value professional services and technology sectors, combined with high-density land use policies which limit outdoor irrigation (which accounts for approximately half of all domestic water use in California). During water year 2016, San Francisco residents consumed 41 gallons-per-day compared to the California statewide average 82 gallons.
The San-Jose-Sunnyvale-Santa Clara Metropolitan Statistical Area tops U.S. regions in economic value created per unit of water consumed.
The San-Jose-Sunnyvale-Santa Clara Metropolitan Statistical Area produces $504,000 in economic value for every acre-foot of water it consumes. The metro area, which includes Silicon Valley, has one of the most productive economies in the United States, and consumes about 467,000 acre-feet of water per year, less than a quarter of the average across all metropolitan statistical areas (2,217,352 acre-feet).
Methodology
We examined the top 15 Metropolitan Regions, as defined by the United States Office of Management and Budget, and ranked by gross domestic product by the United States Department of Commerce Bureau of Economic Analysis. Individual county GDP figures were sourced from Moody’s Analytics.1 County water consumption was obtained from the United
States Geological Survey (USGS) data on total public supply withdrawals and self-supplied and industrial withdrawals.2 The water data represents urban water use only (all households, commercial, and industrial), and does not include water for agriculture, livestock, or grazing. Economic value per acre-foot was determined by dividing county GDP by county water use.
Notes
1. Moody’s Analytics, Economic Data: Forecast and Historical https://www.economy.com/products/data
2. United States Geological Survey. Estimated Use of Water in the United States County-Level Data for 2010. https://water.usgs.gov/watuse/data/2010/