The Economic Impact of the Affordable Care Act on California

The Patient Protection and Affordable Care Act (“the ACA”) is the most sweeping piece of social legislation in a generation. It is expected to expand healthcare coverage to roughly thirty million more Americans, undo some of the more unfair elements of our system — such as the ability of health insurers to deny people coverage for “pre-existing conditions”— and continue the move toward paying healthcare providers for quality rather than quantity. As with any piece of federal lawmaking, the ACA was the product of political compromise among parties and interests. Hence, it is not the dramatic change its supporters had hoped for, and it goes much further than its detractors would prefer. The focus of this analysis, though, is not on the policies embedded in the ACA, but rather on their cumulative economic impact.

Screen Shot 2015-11-01 at 10.58.31 PM

One of the most important questions — in both substantive and political terms — relates to the ACA and its consequences for the economy. The comprehensive analysis in this report generates an estimate of that economic impact, weighing factors that will generate jobs and enhance growth — such as additional spending within the personnel-intensive healthcare sector and fewer sick days due to poor health — against those that will have a contractionary impact—such as the requirement that large firms offer health insurance or pay a penalty.

A Bay Area Council Economic Institute Report by

Jon Haveman, Chief Economist

Micah Weinberg, Senior Fellow

Acknowledgements

The authors would like to acknowledge the helpful feedback and input of Ken Jacobs, Terry Gardiner, Sean Randolph, Pam Winter, John Grubb, Richard Figueroa, and Marlon Cuellar on early drafts of the study as well as the generous support of The California Endowment for this report. Dr. Weinberg would also like to thank his co-authors for the report on the economic impact of the ACA on Colorado which provided the framework for this analysis: Len Nichols, Julie Barnes, Sarah Axeen, and the team at the University of Denver Center for Colorado’s Economic Future, as well as the funders of that study, The Colorado Trust and the Colorado Health Foundation.

Special Thanks

The Bay Area Council Economic Institute extends its thanks for generous support from the California Endowment.

Jobs by Region
Share on Twitter
ACA Implications: Value Added
Share on Twitter
Medicaid
1.9
million low-income, uninsured individuals resided in the state of California in 2010.
1/3
are expected to enroll in state-sponsored coverage.
Share on Twitter

This report provides an assessment of how the California economy might have been different in 2010 had the ACA been fully implemented in that year. On net, this analysis suggests that upon full implementation in California, the Affordable Care Act will have a positive impact on California’s economy with variation across regions based largely on their socioeconomic makeup. Full implementation of the Affordable Care Act as compared to the non-reform scenario in 2010 would have resulted in 98,861 new jobs in California (a 0.6% increase in total employment) and $4.4 billion in additional gross state output.

These results vary significantly by region, however. The bulk of the new jobs, 57,699, would be created in the Greater Southern California region, where employment would increase by 0.7% as a result of the law. The largest increase in percentage terms, a 1.3% boost in employment, would be in the Sacramento Valley, the region centered on the state capital. The smallest increase in both absolute and percentage terms would be in California’s Bay Area. Even in this region, however, a 2010 full ACA implementation would have generated 7,653 new jobs for a total increase in employment of 0.2%. The projected impacts on total output also vary across regions.

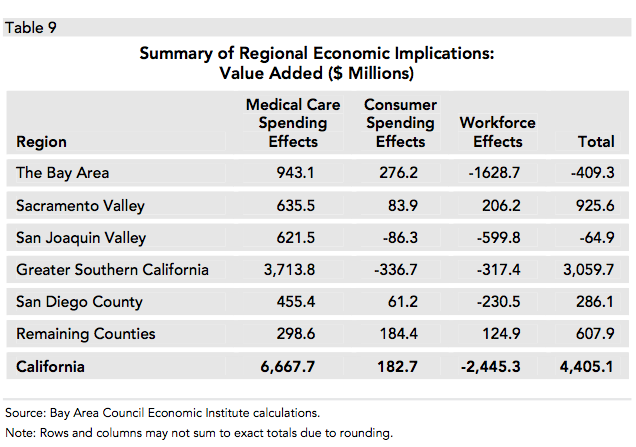
Again, the Bay Area would benefit the least from reform, experiencing a $409 million contraction in its regional economy. The Greater Southern California region, though, would see its economy expand by $3 billion as a result of reform. All of the elements of the model that generate these results are described in much greater detail below and in the technical appendix to this report which is available online (at http://www.bayareaeconomy.org/files/pdf/ACATechAppendix.pdf).

The ultimate impact of healthcare reform, though — both in terms of its true economic implications and whether it achieves its substantive policy goals — depends heavily on implementation, which will require close partnership between the federal government, the states, and the private, charitable, and non-profit sectors. Significant changes to policy have been and will continue to be made throughout the process of putting the law into effect and engaging in the broader essential project of health system transformation. The decision of the U.S. Supreme Court regarding the constitutionality of major provisions of the law also has the potential to have a dramatic impact on this process.

This study provides a framework for understanding only what we should expect the economic consequences of this specific law to be. Its results call into question whether there is a solid evidentiary basis for the claims that the Affordable Care Act will have an overall negative impact on the economy. But it will remain critical to implement the ACA and craft follow-on policies with an eye to improving the health of Californians, controlling healthcare costs, and enhancing the quality of the delivery system. The Affordable Care Act is simply one step in that ongoing process.

I. Introduction

With nearly one fifth of our gross national product spent within the healthcare sector, healthcare reform has significant and quantifiable implications for the California economy. This report presents a model for evaluating the likely economic impacts of the federal Patient Protection and Affordable Care Act (“the ACA”) on California and its regions. Using an analytical model of how the California economy might have been different in 2010 had the ACA been fully implemented in that year, it gauges the consequences of changes in the financing of and spending on healthcare as prescribed in the law. The model compares to the status quo or non-reform scenario the impacts of net new healthcare spending, net new non-healthcare spending, the contractionary effect of financing reform, and the cumulative reverberations of all these flows throughout the California economy. The report focuses on well-established metrics of total state employment and statewide economic output (measured as gross state product or “GSP”).1

Though the results presented here are specific to California, there is no reason to believe that the direction and scale of the predicted impacts would be unique to this state. The methodology of this study is broadly comparable to an analysis done for the state of Colorado, which generated similar results.2 In fact, to the extent that California is a relatively more affluent state, the positive economic impacts of this law may be more modest than they will be elsewhere, since more federal dollars will flow to states with lower per capita incomes.

Economic Implications of Reform Provisions

Neither the funding for the ACA nor the additional spending within the healthcare industry that it will induce occurs in a vacuum. Rather, each has a ripple effect within the larger state and regional economy. These effects are commonly referred to as “multipliers.” The additional funds that will flow to doctors and hospitals will allow them to buy more medical equipment; the makers of medical equipment pay salaries to their employees; these employees purchase goods from businesses in their hometowns; and so the initial injection of funds circulates throughout the economy. The economic effects of financing reform have similar reverberations. This figure provides a graphical explanation of how these funds flow through the economy and multiply.

Provisions of the ACA will also impact the way that many of the economy’s participants act, and their actions will have follow-on or secondary implications. However, attempting to pick apart the various effects of an individual provision can be difficult and, if not done with care, misleading. A good example is provided by the individual mandate, which is the requirement that people have health insurance coverage or pay a fine.

Whether through the purchase of insurance or the payment of a fine, this new mandate implies significant changes in the way that money is spent. In a direct sense, it will increase the amount of money that will be spent on medical care, which will have a positive economic effect, and it will decrease the amount of money that will be spent on non-health goods, which will have a negative economic effect. It also has an impact, however, on the price of insurance, particularly in the individual market. There are many reasons to require people to demonstrate evidence of healthcare coverage, including the salutary effect that it has on the risk pool of the individual market. In a regulatory environment that eliminates medical underwriting and ties premiums largely to the utilization patterns of an entire market segment, the size and makeup of that pool is of critical importance. Bringing a larger number of healthy people into these pools will result in insurance premiums that are somewhat lower than they would have been otherwise.3

The presence of the individual mandate will also be one factor that changes the set of incentives that exists for individuals in ways that will influence their behavior. The individual mandate may, for example, increase the value that people place on employer-sponsored insurance.4 And in an environment with a greater proportion of the population being insured, in part due to the individual mandate, there will also be greater labor force participation. Also, to the extent that people are employed, the implication is that there will be less time away from work or out of the labor force for reasons related to health.5 The elements of this report’s economic impact analysis that require an account of individual behaviors rely on a detailed microsimulation, produced by researchers at the University of California, Los Angeles and the University of California, Berkeley, that gauges the expected impact of this new decision environment on choices in the California market.6

For each element of the ACA, therefore, this model attempts to capture the full range of its implications as well as how it interacts with the consequences of the other provisions of the law.

II. Methodology

Though each provision of the law will have multiple primary and secondary effects, this report separates the effects of the Affordable Care Act into three distinct sets.

Medical Care Spending Effects

This set includes an evaluation of the results of increased Medicaid spending, since the Affordable Care Act expands Medicaid coverage to Californians whose incomes fall below 133% of the federal poverty level. Also included is the induced healthcare spending that is a result of expansions of both public and private healthcare coverage. Medical care spending will also be higher as a result of new targeted taxes embedded in the law.

Consumer Spending Effects

These effects include the extent to which non-healthcare spending is reduced as a result of the individual mandate, but also the extent to which it is increased due to the increases in disposable income that are a result of enhanced labor market flexibility. When people can change jobs they do, and these movements generally result in higher income.

Workforce Effects

This set includes the positive impacts on employment from better health through increased insurance coverage, as well as the positive and negative impacts on the labor force of mandates and tax credits available to large and small businesses, such as the employer mandate and the small business tax credit.

Medical Care Spending Effects

Increases in healthcare spending as a result of the ACA include those that result from the expansion of the state’s Medicaid program, the new purchase of insurance by previously uninsured individuals (both eligible and ineligible for subsidies from the federal government), and the additional spending which is induced by this expansion and these subsidies.

Medicaid Expansion

More people with lower levels of income will become eligible for coverage through Medicaid. In 2010, there were approximately 1.9 million low-income, uninsured individuals in the state of California, about one-third of whom are expected to enroll in state-sponsored coverage.7 Along with this enrollment comes a considerable increase in healthcare spending on these individuals. Estimates suggest that healthcare expenditures on insured individuals roughly double from their level in an uninsured state.8 On average, roughly $2,506 is spent each year on healthcare for those without insurance, while healthcare spending is roughly $4,791 for those with insurance. 9 Accordingly, it is likely that healthcare expenditures on these individuals would have been more than $1.7 billion higher in 2010 if the ACA had been fully implemented in that year (Table 1). More than half of this spending would have taken place in Greater Southern California, with a considerable increase in the San Joaquin Valley as well.

Screen Shot 2015-11-02 at 8.03.54 AM

Private Coverage Expansion

The individual mandate and sizeable subsidies to lower-income individuals will also result in more people having health insurance. With more insurance, there will again be greater expenditures on healthcare. The net increase would be just over $3.4 billion (Table 2). Increases in healthcare spending vary significantly across regions, and are highly correlated with the size of the population and the proportion currently uninsured. Again, it is the San Joaquin Valley and Greater Southern California that stand out, both in terms of the percentage increase in healthcare spending and in the overall increase in spending. In Greater Southern California, this spending represents an infusion of over $1.9 billion into the local economy.

Screen Shot 2015-11-02 at 8.04.38 AM

Consumer Spending Effects

Increased healthcare spending has a stimulative impact on the economy. However, that spending crowds out spending on other goods, thus creating a contractionary impact. To the extent that the focus on the cost of health-care reform is on tax policy exclusively, that focus is misplaced, as financing the coverage expansion will require both public and private dollars.

Individual Mandate

The ACA imposes a responsibility on individuals to maintain insurance coverage. If they are not covered by a public program or through their employer, they must purchase insurance from a state-sponsored exchange or on the private market, or face a fine. The majority of those currently uninsured individuals will not have access to employer-provided insurance so will need to make premium payments on their own. Those payments will reduce the dis-posable income of those new premium payers and hence their consumer spending on other things.

The economic effects of the requirement to carry insurance coverage are significant. Even factoring in government subsidies, our estimates suggest that premium and other out-of-pocket healthcare expenses for those currently uninsured would increase statewide by nearly $4.3 billion (see the first two rows of Table 3). Though to put this figure in perspective, this is roughly 0.29% of current estimated income in the state of California, or 0.41% of disposable income. These shares vary significantly across the state, with a disposable income decline of only 0.19% in the Bay Area and declines that are nearly double that in the San Joaquin Valley and Greater Southern California (due to the higher proportion of currently uninsured individuals in these regions). It should be noted that not all currently uninsured people are assumed to obtain coverage. Rather, it is assumed that nearly 60% of those currently uninsured will continue to be without insurance.10

Screen Shot 2015-11-02 at 8.06.40 AM

There is a flip side to the impact of the individual mandate, though. It also brings down the cost of insurance on the individual market by eliminating “free riders” and spreading the costs of healthcare services across a broader and healthier risk pool. Specifically, we have relied on estimates that project individual market healthcare premiums to be 12.6% lower than they would be in the absence of the individual mandate.11 When combined with the premium tax credits that are available through the ACA, the overall effect on premium payments — and hence disposable incomes — is negligible at just $350 million. This overall figure masks differences around the state. Even these differences, however, are not large. In particular, the Bay Area would experience a decline in premium payments of $127 million, while Greater Southern California would experience an increase of more than $560 million. Relative to the overall size of either economy, these differences are small.

Reduction of Job Lock

There are also provisions of the law which will have effects that increase the disposable income of Californians and hence consumer spending. Elements of the ACA may reduce the extent of “job lock” in the California economy. Job lock is the reluctance on the part of an employee to seek or perhaps to consider a better employment situation because of uncertainty about switching health insurance coverage. Due to the accessibility of health insurance regardless of health status, the risks posed by the gaps between jobs are mitigated, so the incidence of job lock will likely be reduced.12

Because the ACA creates an insurance market where the switches between jobs are less risky due to the elimination of medical underwriting, more job switches are likely to occur. The provisions regarding pre-existing conditions and waiting periods when starting a new job are key to reducing job lock. It is also possible that insurance premium subsidies and lower-cost individual insurance through the exchanges will allow switches to jobs that are more productive or facilitate the start of new small businesses by reducing the costs of striking out on one’s own.

The projections in Table 4 provide estimates of the gain in income that might have been realized in 2010 had the ACA been in effect. These income gains are assumed to come from job switches made possible by provisions of the ACA that reduce job lock. The job switches discussed here are employee-driven, and thus nearly always reflect an effort on the part of the employee to find a better job match. A better job match can have a variety of implications, but here it has been assumed that a better job match results in increased income. Evidence suggests that voluntary job switches increase income by an average of $1,500 per year for the job switcher. This increase in income is assumed to reflect a more efficient use of resources. Individuals will be paid more in jobs where they are valued more. Accordingly, the increase in total income that is a result of increased voluntary job switching represents a productivity improvement for the economy and also provides additional income which will increase individuals’ consumer spending. Table 4 indicates that this increase in productivity would have had a value of roughly $562.7 million in 2010. Although this is a relatively small amount, it is a valuable increase for the affected individuals that would most likely not be possible without the implementation of the ACA.

Screen Shot 2015-11-02 at 8.08.59 AM

Workforce Effects

In addition to the effects on total healthcare spending and on consumer spending, the ACA will impact the cost of labor and hence the total size of the workforce. There are both positive and negative dynamics here as well. It is notable that the element of the ACA that has the largest negative impact on employment, when examined in isolation, is the mandate that large employers offer healthcare coverage or pay a fine. However, the employer mandate is also a crucial tool of the coverage expansion that, on net, is a job creator in the state.

Employer Mandate

A key reform of the healthcare system included in the ACA is the requirement that many businesses that do not currently offer insurance to employees make healthcare coverage available or pay a fine. The fine, however, only applies to full time employees (FTEs) not receiving insurance and to busi¬nesses with more than 50 FTEs on the payroll. At just $2,000 per employee, the fine is far less than the cost of reasonable health insurance for employees. As a result, some businesses that are subject to the mandate will instead choose to pay the fine. Paying a fine raises the cost of employing workers.

There are several ways in which employers can respond to the increased costs of either providing health insurance or paying the fine. In general, the result will be some combination of higher prices, lower profits, and lower wages. All of these effects generally involve a revision of the number of workers hired — usually downward — and we have assumed that lower hiring will be the average response of businesses that choose to pay the fine. In particular, we have assumed an employment elasticity factor with respect to labor costs of -0.1. For a one percent change in the cost of labor, the number of workers is reduced by 0.1%.13 Overall, we have estimated that the employer mandate alone will reduce employment by just under 55 thousand workers (Table 5). We have also assumed, for the purposes of this analysis, that the cost of the penalty will be split evenly between employer and employee in the form of higher cost for the employer and lower wages for the employee.

Small Business Tax Credit

The ACA also provides for significant tax credits for small businesses that provide healthcare coverage for their employees. These tax credits started in 2010 and will begin to phase out in 2016. However, since the tax credits can be carried forward and backward many years and are quite significant — up to 50% of the cost of covering health insurance on a sliding scale with the maximum tax credit being available for businesses with fewer than 10 employees and $25,000 in average wages — we expect these tax credits to have a discernible positive impact on the labor market. Excluding the categories of self-employed persons (who are eligible instead for premium tax credits) and two-person establishments, there are nearly half a million businesses in California that will be eligible for the credit, and take-up of the credit has accelerated rapidly after a slow initial period.14 To be consistent with the methodology for calculating the tax credit, we have assumed that half of the injection of federal tax credit funds will go to employees in the form of higher wages and benefits, and half will reduce labor costs for these firms, leading to an increase in employment. We have estimated that these tax credits will facilitate an increase in employment of nearly 30,000 workers.

Labor Force Participation

Under the ACA, the proportion of the population that is uninsured is expected to drop significantly. With more people having health insurance, the overall level of health of the economy’s labor force will improve, as will its size. Having insurance leads to better health outcomes, including reduced mortality and morbidity.15 There are a wide variety of benefits that stem from better health outcomes, including greater worker productivity and the value of a longer life. Many of these benefits, though significant, are not easily quantifiable.

The estimates in this report focus on the relationship between having health insurance and working. As the ACA increases the likelihood of having health insurance, and having insurance has a positive impact on an individual’s health from one year to the next, health insurance increases the likelihood of an individual’s participation in the labor market. Thus, more people become available to work in the state as better health outcomes lead to higher levels of labor force participation. Estimates of these linkages suggest that an additional 47,185 people would have been available for work in 2010 (Table 6).

Of the increase in the labor force, more than 40%, or 19,629, will be in Greater Southern California. Another 8,755 will be in the Bay Area, with the remainder spread throughout the state. Table 7 provides an indication of the industries in which these individuals might be employed. Given the demographics of the currently uninsured, the largest numbers would be employed in Accommodation and Food Services (7,316), Retail Trade (5,960), and Construction (5,455). Given the location of these jobs around the state and the average wages of those currently uninsured but employed, the right column indicates the increase in spending that would result from income that is generated by the increase in employment in each industry. Because the analysis compares a reform model with an equilibrium state without reform, it has been assumed that employment is a direct function of labor force participation, as it is in a normal economy.

Taxes and Fees

Additional policy elements of the ACA involve efforts to raise revenues from industry to help offset the premium subsidies and other higher costs associated with reform. In particular, new taxes would be assessed on pharmaceutical manufacturing companies, on health insurance companies, and on makers of medical devices. To the extent that these taxes would have a discernible impact on the economy, that impact would come in the form of higher healthcare spending by consumers (and the consequent lower spending on non-healthcare goods).

The first two taxes (on pharmaceutical and health insurance companies) are essentially annual fees. As such, they will have very little effect on either the prices or supply of these products to the market. Instead, they will reduce the return to company shareholders. At its peak, the tax on pharmaceutical manufacturers would bring in $4.1 billion in 2018. With potential nationwide shipments of roughly $350 billion in 2018, this represents a tax of roughly 1.2%. Of those shipments, 14.3% originated in California in 2007.16 This reflects a share of production that is very close to California’s share in the U.S. GDP, suggesting that production of pharmaceuticals is not heavily concentrated in the state.17 That implies that California’s pharmaceutical industry will not be disproportionately affected by this tax. Similarly, the revenue from the tax on health insurance providers peaks in 2018 at $14.3 billion. In 2007, total revenues in the sector were $497.6 billion. Having more than doubled over the course of the previous 10 years, these revenues could be expected to be much higher in 2018. Should they double again over the course of the next 10 years, the effective tax rate would be just 1.4%.

Standard economic reasoning implies that taxes such as these, which are essentially a reduction in overall profitability, will have no effect on business decisions related to either pricing or quantity supplied. Those decisions are based on per unit variable costs, regardless of the fixed costs associated with production, which these taxes closely mirror. Assuming that the taxes are not sufficient to change the overall market structure — which they are not in these reasonably profitable sectors of the economy — they will not affect the market for these products. However, they will affect the return to shareholders. This change in return does have the potential to affect other markets through changes in consumption related to changes in income. As data is not readily available on the geographic location or the incomes of shareholders, and these changes are likely to have only a very small effect on consumption, their impact has not been included in this analysis. At the same time, this effect would serve to reduce the overall job creating impact of the ACA, but by a very small amount; disposable income in California would likely fall by less than one-tenth of one percent.

The tax on medical devices, on the other hand, has the potential to influence the market. As it is a 2.3% tax on sales of taxable medical devices, and not a lump sum, it will likely affect prices. However, given that the market for these devices is quite inelastic, this increase in prices is likely to be passed on to consumers through higher prices for insurance which have been factored into our model directly through the estimated changes in insurance premiums.

The ACA also includes taxes and higher premiums for high-income Medicare recipients. High-income Medicare beneficiaries pay higher premiums for Part B and prescription drug coverage. The ACA freezes the threshold for being categorized as high-income at 2010 levels until 2019, rather than allowing it to adjust for inflation. Currently, just 5% of Medicare recipients are subject to these higher premiums. This percentage will surely grow between now and 2019, but because it is such a small share and the consumption patterns of high-income individuals are much less affected by this relatively small increase in premiums, we have not attempted to model this policy change here, other than to point out that it may marginally reduce the positive economic implications of the ACA reported below.

Prior to the passage of the ACA, there was a 1.45% tax on wages for high-income Medicare recipients. The ACA would raise this tax to 2.35%, with revenues going into the Medicare Part A Trust Fund. Again, because this tax affects a relatively small part of the population, and because such taxes are less likely to affect the consumption patterns of high-income earners than those of low- or middle-income earners, we have not attempted to model the impact of this policy change. It is likely to be small, but it would reduce the overall positive impact presented below.18

A new tax on net investment income of high-income individuals and couples will be introduced with the ACA. This tax is 3.8% applied to net investment income of individuals with a modified adjusted gross income over $200,000 or $250,000 for those filing jointly. Data limitations have prevented us from evaluating the effects of this new tax, but the overall effect on consumption is again likely to be small.

Modeling the Overall Implications

The ACA will result in a complicated set of changes in employment patterns and expenditures. These changes won’t occur in a vacuum, but will instead reverberate throughout the economy. Additional expenditures in the healthcare sector will result in additional purchases of equipment, thus leading to more production and hence employment in manufacturing, and to the hiring of additional employees, who will then spend more money on food, clothing, and shelter, among other things. These reverberations are generally modeled as increasing the economic significance of a single economic change — i.e., the multiplier effect.

This analysis is no different. In particular, increases in expenditures in a single part of the economy will lead to increased employment and output in a variety of other parts of the economy. In a symmetric way, reductions in employment or spending in one part of the economy will lead to reductions in spending in virtually every other part of the economy.19

This report has made use of the IMPLAN 3.0 (IMpact analysis for PLANning) system to evaluate the overall effect of healthcare reform on the California economy. This software has been used by many federal and state government agencies and is one of the most commonly used frameworks for analyzing a variety of policies and economic issues. Common analyses include the impact of new businesses, the income generated by tourism, the importance of spe¬cific sectors of the economy, and the costs and benefits of resource manage¬ment. Within California, IMPLAN has been used to measure the implications of changes in welfare policy, the economic impact of hosting the America’s Cup, and the potential benefits of a World Expo. Studies of the economic impacts of colleges and universities also commonly use this framework.

III. Results

Statewide Results

Since the Medical Care Spending Effects in the model are uniformly positive—they gauge the economic impact of additional spending which is a result of the Medicaid expansion and the individual mandate, plus the subsidies for the purchase of private insurance and the induced spending caused by both of these elements of the coverage expansion — these effects are responsible for the vast majority of the job growth that will be a result of the ACA. Of the 98,861 jobs created in the state, 87,821 (fully 89% of the total increase in employment) are attributable to Medical Care Spending effects (Table 8).

Screen Shot 2015-11-02 at 8.23.19 AM

The picture is more muted as it relates to Consumer Spending Effects and Workforce Effects. Though there are positive impacts on consumer spending, such as the lower premiums for private insurance that will be a result of reform and the additional disposable income that will come from employee-driven job switches, there are also negative impacts. In particular, the total number of new jobs created by consumer spending outside of new medical care spending is only 2,061, a negligible number when compared to the total workforce in the state of California. Similarly, the impact of Workforce Effects is positive but is an order of magnitude smaller than Medical Care Spending Effects. Again, there are positive impacts on the workforce, but they are coun-terbalanced almost entirely by the effects on the price of labor that are the result of provisions such as the employer mandate. It is important to caution again, however, that this conclusion presents itself only when the effect of the penalty is examined in isolation. The employer mandate to provide healthcare coverage for employees is one of the drivers of increased insurance coverage and hence of higher levels of medical spending as well as lower insurance premium rates for those currently insured, particularly in the individual market.

Overall, therefore, the employment picture is positive as it relates to the three broad sets of effects that the implementation of the ACA will have on the California market. The impact on Gross State Product (GSP) is also positive when examined in the aggregate (Table 9). There will be an additional $4.4 billion of GSP as a result of reform. However, the impact of the different classes of effects varies. Again, Medical Care Spending Effects are the largest positive contributor to output growth. Examined in isolation, the new medical care spending that is a result of reform will increase GSP by $6.7 billion. Consumer Spending Effects on output are negligible ($182 million net positive). The Workforce Effects of the law, however, will have a negative impact on total output for the state, reducing state GSP by $2.4 billion. The total net effect of the law, though, is positive. The extent to which the employer mandate, in particular, will lower output through increasing the cost of labor is far more than balanced out by the positive impacts on output that will be a result of increased medical care spending and, to a much smaller degree, consumer spending effects.

Screen Shot 2015-11-02 at 8.24.56 AM

Regional Results

The Bay Area

California’s Bay Area is relatively affluent and has high rates of insurance, in part due to San Francisco’s passing of its own version of healthcare reform, Healthy San Francisco. In this region, the proportion of uninsured individuals is only 11.9% as compared to 18.1% statewide. One of the major implications of this situation is that the Bay Area will benefit more from the individual mandate than other regions. Fewer people — particularly fewer people with higher incomes — will be purchasing insurance that they would not have otherwise purchased, and hence there will be less of a crowding out effect on consumer spending. Additionally, since many people in the region will be continuing to purchase insurance — particularly in the individual market — in larger and healthier risk pools than those existing before reform, their premiums will be lower, allowing their consumer spending to increase in other areas. Thus, the imposition of the individual mandate will actually increase the Bay Area’s consumer spending, which is a major driver of regional employment growth. The region, however, will experience a modest contraction in total output, primarily as a result of the imposition of the employer mandate, which has a greater effect on the Bay Area since it has a higher proportion of larger businesses than many other regions.

Sacramento Valley

Overall, this region will witness a real boost in employment. The region has a high proportion of individuals already covered by health insurance, with only 13.5% uninsured. Nonetheless, it will experience a disproportionate jump in additional medical care spending and about a 20% higher employment bump than population alone would predict, but it will not see a significant increase in Medicaid spending on a population-weighted basis. The employer mandate will have a smaller effect in this region largely due to its high proportion of government employment and hence its higher proportion of people already covered by employer-sponsored insurance. This region also will see a significant uptick in output: $925 million.

San Joaquin Valley

The San Joaquin Valley will see proportionately smaller job growth than many other regions. As expected given its level of income, this region will benefit disproportionately from the Medicaid expansion. However, as a region, the San Joaquin Valley will benefit less from lower premium rates for individual insurance that would result from an expansion of the risk pool since, in comparison to the rest of the state, it currently has a higher proportion of uninsured individuals who are not already paying for insurance in the individual market. It also will be more greatly affected by the employer mandate than much of the rest of the state, due to its relatively lower levels of employer-sponsored insurance. On the other hand, due to its relatively lower annual wages, this region will benefit more from the small business tax credit than most other regions of the state. On net, although over 3,600 new jobs will be created as the result of ACA reform, the region will experience a modest contraction in its total output of approximately $65 million. As in the Bay Area, this means that even though the total economy will have contracted somewhat, a larger proportion of total output will be going to workers in the form of wages, benefits, and other forms of compensation. This is notably distinct from the nationwide trend over the course of the past two decades, in which national economic growth has largely climbed upward while the real wages of workers have remained stagnant or declined.

Greater Southern California

Overall, the job gains in this region will be 30% greater than its population would suggest, in part because its higher proportion of currently uninsured individuals means that additional Medicaid and federal subsidy dollars will be flowing to this part of the state. As with the San Joaquin Valley, the individual mandate will have a net negative effect on jobs in this region since its higher proportion of currently uninsured individuals means that it will be more greatly affected by the crowding out effect of spending on insurance premiums money that would otherwise be spent elsewhere in the economy. And this region will also benefit less than the Bay Area, for example, from the relative decreases in insurance premium rates in the individual market that will be a result of reform. Another reason that job growth will be so robust in Greater Southern California is that the effect of the employer mandate will be much smaller in this region than in other regions of the state. This region has a higher proportion of smaller businesses that will either be entirely exempt from the mandate if they have fewer than 50 employees, or will see only a modest increase in their overall labor costs. Other effects related to, for example, increased labor force participation due to better health, will be proportional to the population of the region. In addition to robust job growth, Greater Southern California will see a substantial increase in output, with a regional economy that will be over $3 billion larger as a result of the full implementation of the ACA.

San Diego County

Since San Diego County is relatively affluent in comparison to the rest of the state, it will receive fewer benefits from the Medicaid expansion. Compared to the rest of the state, it has a high proportion of individuals already covered by health insurance, with only 17.0% uninsured. As in the Bay Area, San Diego County residents will benefit disproportionately from the expansion of the risk pools for insurance in the individual market that will make premiums lower than they would be in the absence of reform. San Diego County, however, has fewer large firms than the Bay Area, and therefore will not be affected as much by the employer mandate. It will also receive its expected share of positive benefits from decreased job lock and increased labor force participation due to improved health. Overall, there will be more than 6,500 new jobs in San Diego County as a result of reform, and the economy of the region will be $286 million larger as compared to the non-reform scenario.

Remaining Counties

The remaining counties in California are those in the north part of the state and those along the central coast and along the eastern border of the Sierras. Collectively, these counties have proportions of individuals already covered by health insurance that are comparable to those at the state level, with roughly 18.0% uninsured. However, they do differentiate themselves in two important respects: first, they are relatively low-income counties, and second, business establishments in these counties tend to be smaller. As they are relatively low-income, they will benefit disproportionately from the insurance subsidies that are a part of the ACA. With relatively smaller establishments, they will benefit both from a greater potential to exploit the small business subsidies that the ACA makes available and also from a smaller set of establishments that are subject to the employer mandate. Accordingly, the Workforce Effects in these counties will be substantially reduced relative to other regions of the state.

Results by Industry

Unsurprisingly, the largest proportion of the new jobs that will be created through the expansion of insurance coverage for, and hence access to, medical services are within the Health Care and Social Assistance industry sector. The 46,671 new jobs in that industry represent 47% of the total jobs created (Table 10). However, this means that fully 53% of the new jobs that will be generated by full implementation of the ACA are outside of this sector. That is due primarily to the multiplier effects of the money spent within the healthcare sector cycling through the economy. It is also a result of higher consumer spending that comes from the employee-driven switches in jobs that will be a result of reduction of the job lock effect and other aspects of insurance market underwriting and pricing that often tie Californians to jobs that they would otherwise leave.

The second largest job growth will be in Accommodation and Food Services, a sector in which 21,089 new jobs will be created, some of which will directly service the healthcare industry. Other major areas of job growth will be Retail Trade (9,240 jobs), Services (8,211 jobs), and Support and Waste Management (7,503 jobs). The effect of the law, however, will not be uniformly positive across industries. The IMPLAN economic impact model predicts that as a result of reform, there will be 3,546 fewer jobs in the Manufacturing sector, 2,064 fewer jobs in Educational Services, 1,290 fewer jobs in the Mining industry, and 1,026 fewer jobs in Wholesale Trade. These are industries that will be more greatly affected by the employer mandate and that play a relatively small role in providing healthcare and will receive relatively small benefit from expanded purchases by those who will have higher dis-posable incomes as a result of the ACA. More specifically, these are the industries that will take the brunt of the redistribution of jobs across many industry sectors that will come about as a result of the implementation of the ACA.

Screen Shot 2015-11-02 at 8.30.28 AM

IV. Conclusion

Potential Impact of Bending the Healthcare Cost Curve

This report assesses the most likely economic impacts of the Affordable Care Act for California. However, that focus omits two significant elements of the potential impact of the ACA that could have a large positive impact on the economy but that are not analyzed here. The first is the impact of the ACA on the federal budget and, hence, on the tax burden of individuals and businesses throughout the nation. The second is the as yet unrealized potential of the delivery system reforms embedded in the act to bend the cost curve of healthcare spending.

The Congressional Budget Office initially estimated that the ACA would reduce the federal deficit by more than $100 billion over 10 years.20 There is strong reason to believe that a number of the health system reforms embedded in the law may significantly reduce federal government spending over the long-term.21 These include investments in preventive care, such as the elimination of cost sharing for many preventive services. They also include changes to the organization and financing of healthcare, such as the investments by Medicare and Medicaid in the development of Accountable Care Organizations and Patient-Centered Medical Homes. However, whether these policy elements in fact result in lower healthcare spending depends greatly on their practical implementation. Speculating about the quality and outcomes of these prevention and public health and delivery system reform processes is beyond the scope of this analysis. At the same time, though, there is no strong reason to believe that the Affordable Care Act will greatly expand the federal deficit either. The ACA is “scored” for the purpose of this analysis, therefore, as deficit neutral. We have evaluated the economic implications of certain taxes — such as those on high-income Medicare recipients and medical device and pharmaceutical manufacturers — but we have not posited an unbudgeted increase in overall federal spending to be necessary to finance the coverage expansion in the law.

This report also has not factored in an ACA-related overall decrease in health-care spending, either by businesses or individuals, as a result of factors not tied directly to the impact of reforms on the nature of the risk pools in their respective markets. There are many elements of reform that, if properly implemented, have the potential to reduce healthcare costs, particularly over a long time horizon. It is reasonable to assume that these delivery system reforms have, at the very least, the potential to hold healthcare cost growth roughly stable as compared to the non-reform baseline. The most sophisticated analysis of reform on national health expenditures in the United States concludes that, “Average annual growth in national health spending is expected to be 0.1 percentage point higher (5.8 percent) under current law compared to projected average growth prior to the passage of the Affordable Care Act (5.7 percent) for 2010 through 2020.”22 If the public, private, charitable and non-profit sectors work together to effectively reduce the growth of health-care costs through making the medical system more efficient, this could lead to very different reform-related economic impacts: the costs for businesses and individuals would be lower, but so would spending within the personnel-intensive healthcare sector.

This report also has not cataloged the impact of these reforms on the business models and revenue streams of specific types of jobs. A good example is the implications for health insurance agents and brokers of the imposition of a requirement that insurers spend no more than 20% of premiums on administrative expenses including sales. Though this will certainly have an impact on the business model of insurance agents, the reform law also offers many new opportunities for professionals with an expertise in placing people in private healthcare coverage. Not the least of these is the fifteen million more Americans who are expected to enroll in private health insurance coverage as a result of reform. The ACA also includes funding for healthcare “navigators” through a program set up by the new healthcare benefit exchange. There are myriad ways in which private industry will reorganize to take advantage of new opportunities; these are dynamic and constantly-changing sectors of the economy. It is beyond the scope of this analysis to assess how industry, beyond its response to broad economic incentives such as those created by the employer shared responsibility requirement, will adapt throughout the process of healthcare system transformation influenced by the ACA.

Economic Impacts of Healthcare Reform

The question of what impacts on state and regional economic growth will result from the full implementation of the ACA is one that is important both substantively and politically. The results of this report show that — although there is some significant regional variation, particularly in relation to the impact of the federal healthcare reform law on regional output — on net, the ACA will be an economic boon to the state of California, creating nearly 100,000 new jobs both inside and outside of the healthcare sector and increasing total state economic activity by $4.4 billion.

However, it is important to emphasize that the Affordable Care Act was not designed to be an economic stimulus bill. The intention of the law was to redress the many market failures that left tens of millions of Americans without healthcare coverage while creating increasing cost pressures on the insured, private businesses, and government. The fact that the law also will have a significant positive economic impact is a strong corollary benefit to a policy change designed to achieve other ends. If, as there is strong reason to believe, the public program purchasing and private delivery system reforms embedded in the law improve the efficiency of the healthcare sector, the economic impact will be even more salutary.

When possible in this report, we have erred on the side of being conservative, selecting the lower end of the range of, for example, estimates of the impact of the individual mandate on lowering premiums within the individual market. This report is probably best thought of as an assessment of the lower end of the range of potential economic benefits of the ACA. As such, it musters a great deal of evidence that suggests that the predictions of economic cataclysm were the law to be fully implemented may not be evidence-based. On the other hand, the law was not intended to be, nor is it, an economic panacea.

Appendix

Region Definitions and Summary Statistics
Percent of
Region County Population Uninsured
The Bay Area Marin 9.8
The Bay Area San Mateo 10.9
The Bay Area Santa Clara 11.6
The Bay Area San Francisco 11.7
The Bay Area Contra Costa 11.8
The Bay Area Solano 12.5
The Bay Area Alameda 12.7
The Bay Area Sonoma 13.3
The Bay Area Napa 14.1
Greater Southern California Ventura 16.3
Greater Southern California Orange 17.3
Greater Southern California Riverside 20.4
Greater Southern California San Bernardino 20.8
Greater Southern California Los Angeles 22.5
Greater Southern California Imperial 23.9
San Diego County San Diego 17.0
Sacramento Valley Placer 8.7
Sacramento Valley El Dorado 10.8
Sacramento Valley Yolo 11.1
Sacramento Valley Sacramento 14.2
Sacramento Valley Butte 15.1
Sacramento Valley Shasta 16.3
Sacramento Valley Sutter 16.7
Sacramento Valley Yuba 16.7
Sacramento Valley Colusa 20.3
Sacramento Valley Glenn 20.3
San Joaquin Valley San Joaquin 17.6
San Joaquin Valley Stanislaus 17.7
San Jaquin Valley Merced 20.0
San Joaquin Valley Fresno 20.4
San Joaquin Valley Madera 21.4
San Joaquin Valley Kern 22.2
San Joaquin Valley Tulare 22.3
San Joaquin Valley Kings 23.9
Remaining Counties Santa Cruz 14.8
Remaining Counties Calaveras 15.7
Remaining Counties Mono 15.7
Remaining Counties Amador 15.7
Remaining Counties Inyo 15.7
Remaining Counties Tuolumne 15.7
Remaining Counties Alpine 15.7
Remaining Counties Mariposa 15.7
Remaining Counties Sierra 16.3
Remaining Counties Plumas 16.3
Remaining Counties Nevada 16.3
Remaining Counties San Luis Obispo 16.4
Remaining Counties Santa Barbara 17.4
Remaining Counties Lake 17.9
Remaining Counties Mendocino 17.9
Remaining Counties Humboldt 18.2
Remaining Counties Siskiyou 19.9
Remaining Counties Lassen 19.9
Remaining Counties Modoc 19.9
Remaining Counties Del Norte 19.9
Remaining Counties Tehama 20.3
Remaining Counties Trinity 20.3
Remaining Counties Monterey 21.5
Remaining Counties San Benito 24.1
Source: Bay Area Council Economic Institute calculations based on American Community Survey 2010 data.
Note: Data is reported at the PUMA (Public Use Micro Area) level, so contiguous counties in the same PUMA show identical percentages.

Endnotes

1 The implications for state and local tax revenues of changes in spending patterns are also presented in the online technical appendix. As accumulated revenues are not uniform across products and services, changes in spending patterns will have indirect effects on state and local revenues. These changes will be compared to levels that would be expected in the absence of the ACA.

2 Len Nichols, Julie Barnes, Micah Weinberg and Sarah Axeen, “The Future of Colorado Health Care: An Economic Analysis of Health Care Reform and the Impact on Colorado’s Economy,” New America Foundation, 2010, http://www.coloradotrust.org/sites/default/files/EconomicReport-Full-FINAL.pdf

3 John F. Sheils and Randall Haught, “Without The Individual Mandate, The Affordable Care Act Would Still Cover 23 Million; Premiums Would Rise Less Than Predicted,” Health Affairs 30:11 (November 2011), 2177–2184.

4 Bowen Garrett and Matthew Buettgens, “Employer-Sponsored Insurance under Health Reform: Reports of Its Demise Are Premature,” Robert Wood Johnson Foundation, January 2011.

5 Institute of Medicine, Hidden Costs, Value Lost: Uninsurance in America, (Washington, D.C.: National Academies Press, 2003).

6 Gerald Kominski, Ken Jacobs, et., al., “Health Insurance Coverage in California under the Affordable Care Act,” (presentation to the California Health Benefit Exchange Board, March 2012); in order to be conservative in our analysis, we rely on their “baseline” rather than their “enhanced” take-up scenario.

7 Kominski and Jacobs, 2012.

8 Jack Hadley et al., “Covering the Uninsured in 2008: Key Facts about Current Costs, Sources of Payment, and Incremental Costs,” Kaiser Commission on Medicaid and the Uninsured, August 2008.

9 Hadley et al., 2008. Both figures are adjusted by 7.4% for inflation between 2008 and 2010; all figures in the report are in 2010 dollars since the analysis compares what the equilibrium state would have been in California had the ACA been fully implemented on the date when it was passed.

10 Kominski and Jacobs, 2012.

11 Shiels and Haught, 2011; see also Mitt Romney, “Mr. President, What’s the Rush,” USA Today, July 30, 2009, 7A.

12 Arindrajit Dube, “Productivity Impact of Health Care Reform in California,” Institute for Labor and Employment, University of California, Berkeley, August 2003.

13 Phillip Cryan, “Will a Pay-or-Play Policy for Healthcare Cause Job Losses?” Economic Policy Institute, June 2009.

14 Office of Management and Budget, Federal government receipts, FY 2012, item 138, table 17-1, available at http://www.whitehouse.gov/sites/default/files/omb/budget/fy2013/assets/receipts.pdf

15 Institute of Medicine, 2003; see also Sarah Axeen and Elizabeth Carpenter, “The Cost of Doing Nothing,” New America Foundation, November 2008. Both of these studies estimated the value of improved health directly, while our report adopted a more conventional economic approach which measures it indirectly through increased labor force participation.

16 Source: 2007 U.S. Economic Census, U.S. Department of the Census.

17 Although California is the largest producer of pharmaceutical products, the state ranks 8th in terms of production per capita.

18 Karen E. Dynan, Jonathan Skinner and Stephen P. Zeldes, 2004. “Do the Rich Save More?” Journal of Political Economy, University of Chicago Press, vol. 112(2), pages 397–444.

19 See technical appendix to this report which is available online (at http://www.bayareaeconomy.org/files/pdf/ACATechAppendix.pdf).

20 Congressional Budget Office, Letter to the Honorable Nancy Pelosi, March 20, 2010 (Washington, D.C.: CBO, 2010), http://www.cbo.gov/sites/default/files/cbofiles/ftpdocs/113xx/doc11379/amendreconprop.pdf

21 David M. Cutler, Karen Davis, and Kristof Stremikis, “The Impact of Health Reform on Health System Spending,” The Commonwealth Fund, May 2010.

22 Sean P. Keehan et al., “National Health Spending Projections Through 2020: Economic Recovery And Reform Drive Faster Spending Growth,” Health Affairs 30, no 8 (2011), 11.