Economic Profile 2020: Housing and Transportation in a Post-Pandemic Bay Area
Housing and transportation are two of the region’s biggest challenges. How will they evolve post-COVID-19?
In the first quarter of 2020, San Francisco (ranking third) and Oakland (ranking seventh) were among the most expensive cities in the country, based on a cost of living index that measures the regional differences in the cost of consumer goods and services. The high cost of living in these urban centers of the Bay Area is largely driven by the high costs of housing, which has spurred an affordability crisis, pushing lower income households to locations farther from the urban job centers. As a result, transportation systems that link to job hubs have become congested. In a post-pandemic Bay Area, both housing and transportation will inevitably be reshaped. The following analysis presents some emerging trends in housing and transportation, to shed insight on how these changes may unfold.
A reversal in housing costs have already materialized in some locations, with rents dropping in historically high cost urban job centers, like San Francisco, and rising in parts of the East Bay. As this redefinition in the geography of housing prices in the region plays out, thousands of people face unemployment in an unaffordable region, making future housing stability an uncertainty for many. Housing protections temporarily in place at the state and county level are set to expire on varying timelines, further contributing to uncertainty surrounding housing security for regional residents in poverty and those currently unemployed.
Transportation has seen unprecedented drops in ridership, leaving agencies across the region grappling with revenue shortfalls. Trends over the past few months show that the demand for transit is returning at a slower pace in the Bay Area than other metros nationally and internationally. Additionally, ridership has fallen less at transit stations in predominately Black and Latinx populations, showing that minority communities are more reliant on transit during the pandemic.
Exhibit #1: Rents and home sale prices show a change in housing demand and location desirability in the region.
In the months since COVID-19 emerged, the Bay Area housing market has seen significant disruption. Urban cores that have historically been the most expensive places to live have seen drops in median rent prices, while suburbs in inland counties of the region are experiencing rising housing costs. These trends could represent a temporary change in the desirability of housing in the urban core or they could signal a more permanent shift toward less dense suburban locations throughout the region becoming the preferred geography for more residents.
Average rent for a one bedroom in San Francisco has fallen by 20 percent year over year as of October 2020– the largest percent decrease out of any city in the nation including peer metros such as New York (-12 percent), Seattle (-12 percent), and Los Angeles (-11 percent). The locations in the Bay Area with the largest percent drop in rental prices still have the highest rents. For example, while average rent for a one bedroom in San Francisco is one fifth lower than a year ago, it remains the highest in the region at $2,830 per month. Similarly, peninsula cities such as Mountain View, Cupertino, and Menlo Park saw large percent decreases but still have nominally higher rental costs than other locations in the region.

In contrast to the drop in rental prices across the region, home sale prices have increased across the Bay Area during the pandemic. Across seven metro areas in the region, all have seen increases in sale prices in the eight months since January 2020. Most significantly, sale prices jumped by 35 percent in San Rafael metro area, 25 percent in San Jose metro area, and 22 percent in Oakland metro area– indicating growing popularity of suburban areas in the region.
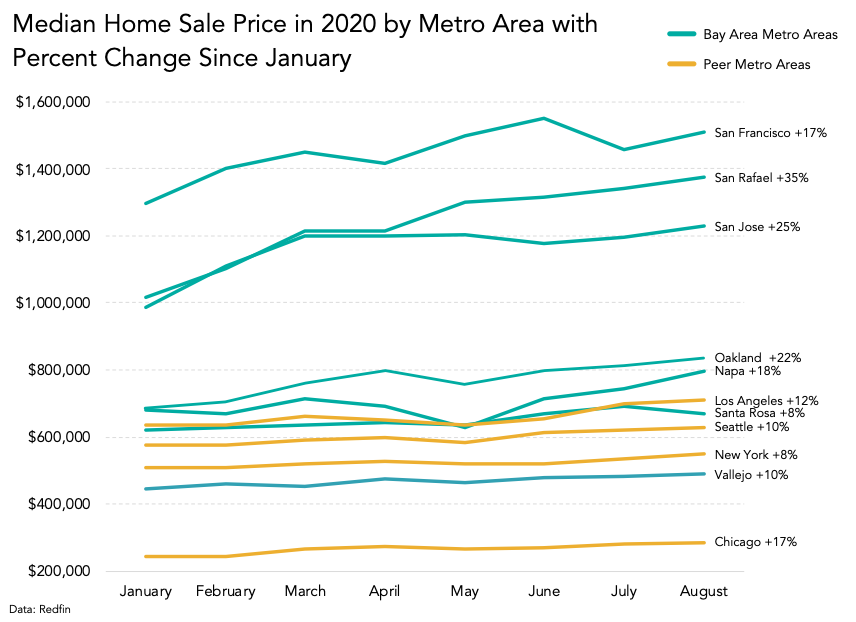
The rise in home sale price, which is also playing out on a national scale, has been cited as a result of an undersupplied market, as people are more reluctant to list their homes during a pandemic. As a region with already limited supply of housing pre-COVID-19, this upward trend in home sale prices in the Bay Area is increasing pressure on the regional housing market. Home sale prices in metros such as Chicago (+17 percent), Los Angeles (+12 percent), Seattle (+10 percent), and New York (+8 percent) have increased less significantly during the pandemic than most metros in the Bay Area, particularly the suburban areas of the region.
Exhibit #2: Housing cost burdened households are overrepresented in areas with high unemployment.
As various housing protections at the local, state, and national level are set to expire, housing stability among households faced with excessive housing costs hangs in the balance. At the national level, the CARES Act provided 120 days of eviction relief for people living in federally backed housing, which expired July 25, 2020. Since then, the CDC has issued an order to halt certain residential evictions through December 31, 2020. Fannie Mae and Freddie Mac announced assistance for borrowers, providing mortgage forbearance for 12 months, waving related late fees, and suspending reporting related delinquency to credit bureaus. Additionally, the two agencies suspended foreclosure sales and evictions until the end of December 2020 and have offered loan modification options for borrowers.
Under new legislation at the state level, no tenant can be evicted before February 1, 2021 for rent owed that was accrued as a result of COVID-19 hardship between March 4 and August 31, 2020. For rent owed that was accrued between September 1, 2020 and January 31, 2021 due to COVID-19 related hardship, tenants must pay 25 percent of the rent due to avoid eviction.
As these housing protections expire, households with unaffordable housing costs are at risk. Many locations within the Bay Area with the highest unemployment rates in the wake of COVID-19 are also locations that have higher shares of households with excessive housing costs. An example on the high end of the spectrum is Antioch, in Contra Costa County, which has a 13 percent unemployment rate and where 43 percent of total households are housing cost burdened, defined as 30 percent or more of income spent on housing costs. On the opposite end, Lafayette also in Contra Costa County, has only 6 percent unemployment and 28 percent of households that are housing cost burdened.
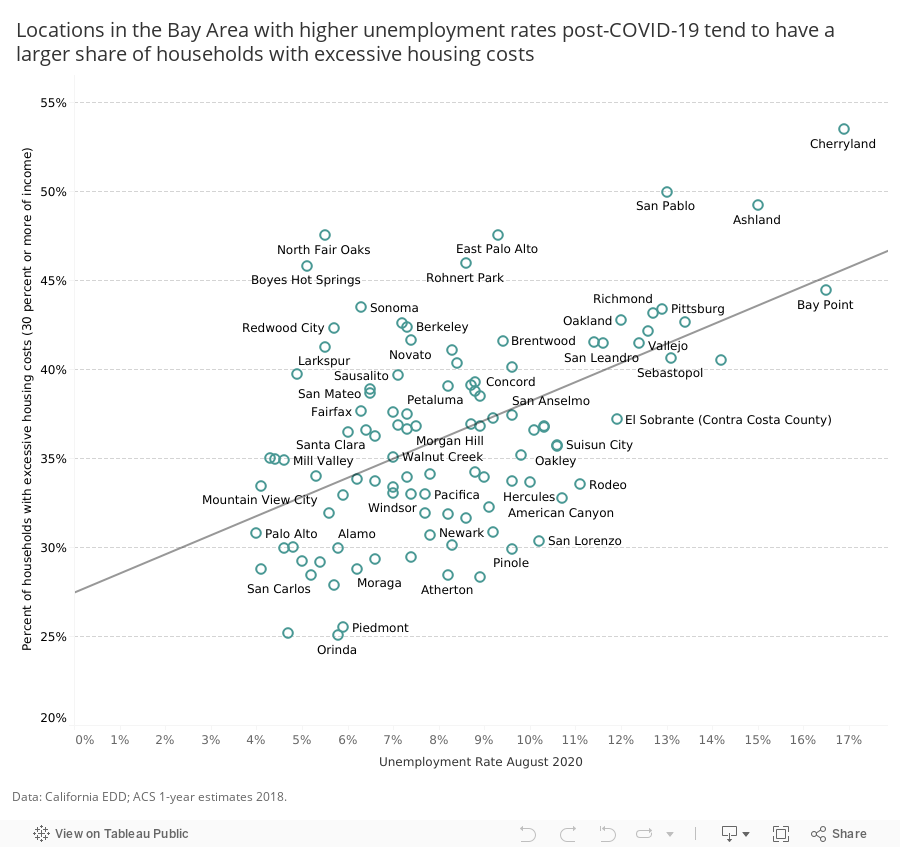
One study has estimated that in Contra Costa County alone 10,000 households are at risk of eviction when the eviction moratorium expires and an additional 9,500 became at risk of eviction when the Federal Pandemic Unemployment Compensation program expired. The study also found that the most significant eviction risk is concentrated among Black and Latinx renters who are already disproportionately economically insecure. The concentration of households with excessive housing costs in locations with higher rates of unemployment reveals that the expiration of both unemployment benefits and eviction protections could have an impact on housing stability.
Based on a weekly Pulse Survey from the Census Bureau, 11 percent of renters were not caught up on housing payments as of the week of September 16, 2020 in the San Francisco Metro Area. As of this most recent update to the Pulse Survey, the San Francisco Metro Area has a smaller share of those unable to make housing payments compared to most peer metros. The New York (17 percent), Chicago (15 percent), and Los Angeles (15 percent) metro areas all saw larger percentages of people reportedly unable to make rent payments last month, while Seattle (6 percent) was had a smaller share behind on rental payments.
Though the San Francisco Metro Area has seen lower reports of those unable to pay rent, of those who did report an inability to pay rent last month over half (54 percent) were Latinx or Black while the same group makes up only 29 percent of the population. This inequity, along with the finding of increased eviction risk among Black and Latinx renters, reveals that the Bay Area has become disproportionately unaffordable for Black and Latinx individuals and households in the wake of COVID-19.
Exhibit #3: Ridership drops incite transit funding concerns.
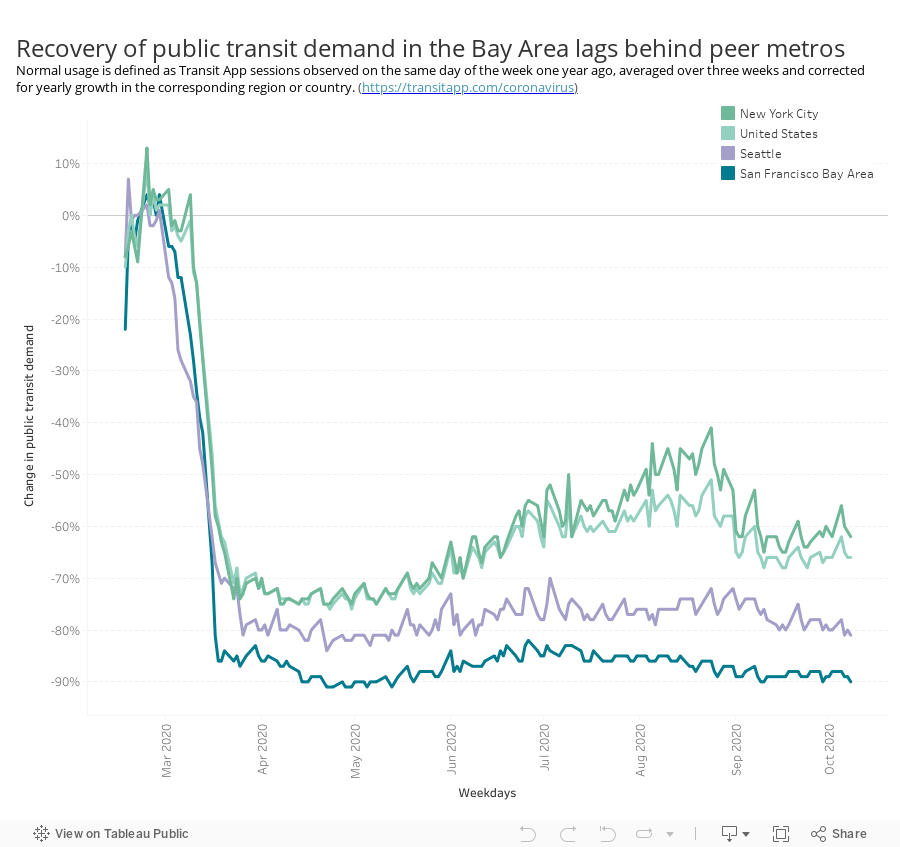
Public transit demand fell sharply across the globe as shelter in place orders went into effect. As riders have begun to return to transit, locations are experiencing varying speeds in return to normal demand. Transit in the U.S. as a whole has reached two thirds of pre-COVID-19 demand, but the Bay Area is lagging behind the national recovery in demand, with only 10 percent of pre-COVID-19 transit demand as of early October 2020.
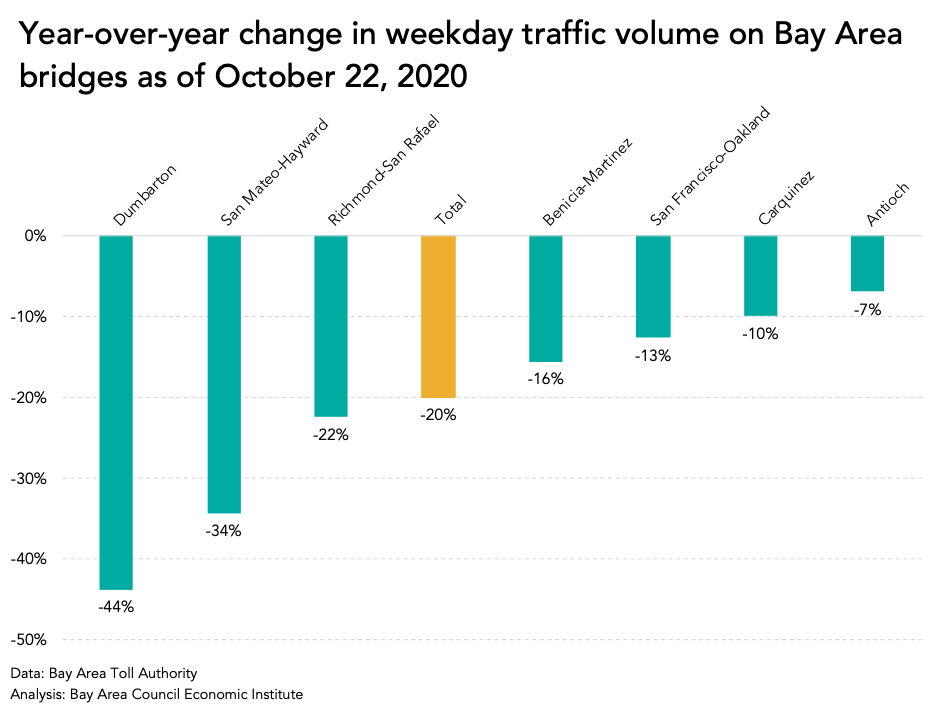
In terms of ridership trends by agency in the Bay Area, average weekday BART ridership was down 89 percent year-over-year as of September 2020 and total Caltrain ridership was down 95 percent year-over-year as of August 2020. In contrast, toll counts in the region have sustained less significant declines. As of the end of October 2020 the year-over-year decline in weekday toll tags was only 13 percent for the Bay Bridge, 34 percent for the San Mateo Hayward Bridge, and 44 percent for the Dumbarton Bridge. Bridges that have seen the most significant year-over-year loss in traffic volume had more of total pre-pandemic weekday toll volume concentrated in commute hours. For example, in September of 2019, 47 percent of total weekday Dumbarton bridge traffic volume occurred between 7AM and 10AM, while only 24 percent of the total weekday Bay Bridge traffic volume occurred during those same hours. This indicates that traffic in locations primarily servicing commuters that work traditional hours have seen slower demand recovery, more akin to transit demand decline, while routes serving more diverse types of trips are recovering to pre-pandemic volumes faster. This reveals the scale of transit demand recovery is likely tied to when and how many employees return to work in-person work in the region.
As transit agencies grapple with the economic fallout from the precipitous drop in ridership, the finances of agencies will reshape how transit operates in the region. Prior to COVID-19, transit agencies in the Bay Area collected over $1 billion in farebox revenue annually, but with many of the region’s agencies now projecting at least 50 percent loss in ridership for 2021, the budget shortfalls from ridership losses could amount to as much as $500 million. Factors such as continued remote work adoption and mode share trends based on population shifts away from the urban centers to suburban communities, could cause the decline in ridership to persist even once it is safe to return to work, further jeopardizing transit investments and operation in the Bay Area.
The transit agencies that provide relief to the highways on key commute corridors in the region, such as BART along the Transbay Corridor and Caltrain along the peninsula, are grappling with financial hardship as a result of lost ridership. These agencies relied heavily on farebox recovery prior to the pandemic. For fiscal year 19-20 Caltrain had the highest farebox recovery out of 23 transit agencies in the region at 68 percent. BART had the third highest in the region, at 51 percent for fiscal year 19-20. This leaves these agencies susceptible to revenue shortfalls that could impact their service.
Ensuring these regional rail agencies that operate along the most congested corridors in the region are able to continue operate with enough frequency and reliability to incentivize commuters choose to transit as they return to work will be important to achieving a sustainable mode share post-COVID-19 in the Bay Area. In order to continue to deliver reliable frequent transit despite ridership woes, collaboration and potentially consolation across agencies could aid a more feasible long-term vision for how transit investments and operations can be shaped and funded to match the changing commute patterns and home location desirability.
Exhibit #4: Change in station ridership shows racial disparities in BART usage during COVID-19.
BART ridership has fallen less significantly at stations located in neighborhoods with a higher percentage of Black and Latinx residents. An analysis of year over year change in BART entries by station in the months following the statewide shelter-in-place order shows that ridership—while still down significantly—was less impacted at stations located in predominately Black and Latinx zip codes.
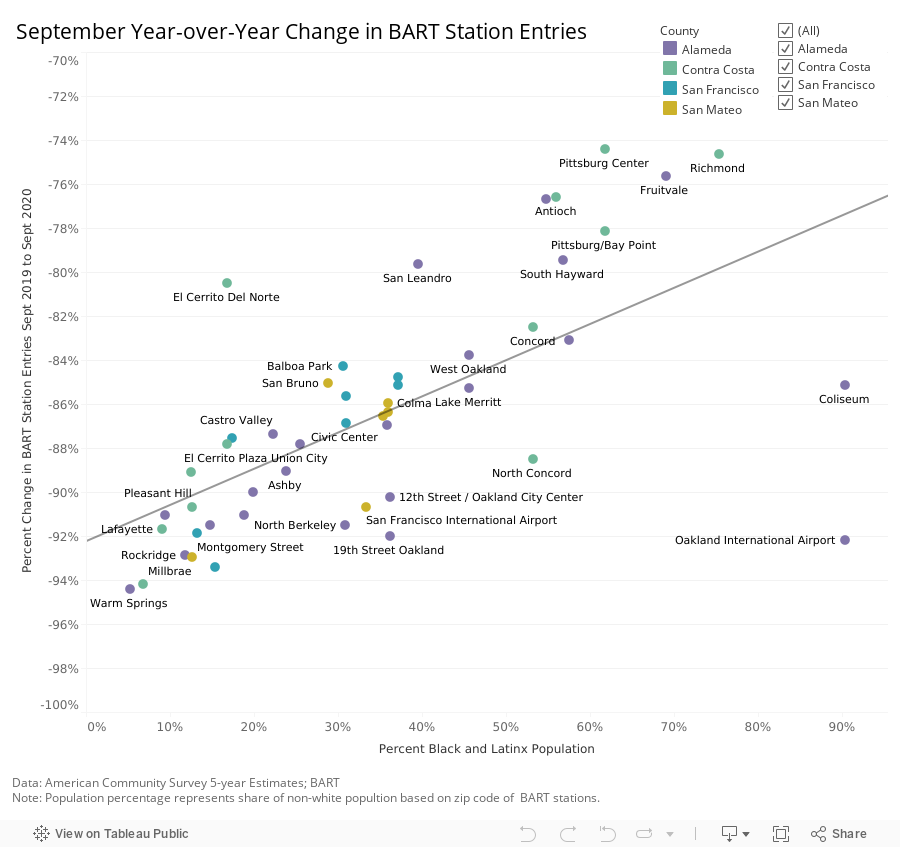
Station entries across the whole BART system dropped 87 percent year over year in September 2020, but the loss in ridership was not consistent across all stations. Ridership at Orinda Station, which is located in a zip code where 72 percent of the population is white, saw a 94 percent drop in year over year ridership. In comparison, Richmond Station, which is located in a zip code where 75 percent of the population is Black or Latinx, saw an 75 percent drop in year over year ridership. This trend holds true across the system: the higher the share of Black and Latinx residents, the less significant the decline in ridership.
High unemployment, shifts to remote work, and cutbacks in service and frequency have all impacted BART ridership levels. This analysis reveals that Black and Latinx communities are more reliant on transit post COVID-19 than white communities. If service cutbacks persist as demand for transit stays low in the Bay Area, the effects of fewer travel options could disproportionately affect these minority groups that this analysis shows are most reliant on sustained and reliable transit service post-pandemic. Thus, ensuring that transit services are able to continue operation is not only an economic issue, it is also a racial equity issue.
Conclusion
The growing popularity of suburban locations in the wake of COVID-19 suggests that regional public transit investments will be key to ensuring commute times along key corridors do not rise drastically if and when people return to work in the urban centers. While dependent on factors such as the long-term adoption of remote work and how long unemployment remains high in the region, the corridors that were congested with single occupancy commuters before COVID-19 are likely to return to the same congested state. If outmigration from the urban core continues to accelerate, population growth in locations with fewer transit options could push more commuters into their cars as the regional workforce returns to the office.
Tracking mode share trends as people return to in person work will be a key indicator as to how the region can prepare for the long-term impacts of housing preference shifting away from dense urban areas and its impact on the regional transportation network. As housing prices fluctuate across the region based on these developing factors, examining where high unemployment rates persist and the trajectory of home prices in varying geographies will be important indicators in ensuring housing affordability does not worsen for communities already burdened with excessive housing costs.