Bay Watch: A Weekly Look into the Bay Area Economy
September 6, 2022
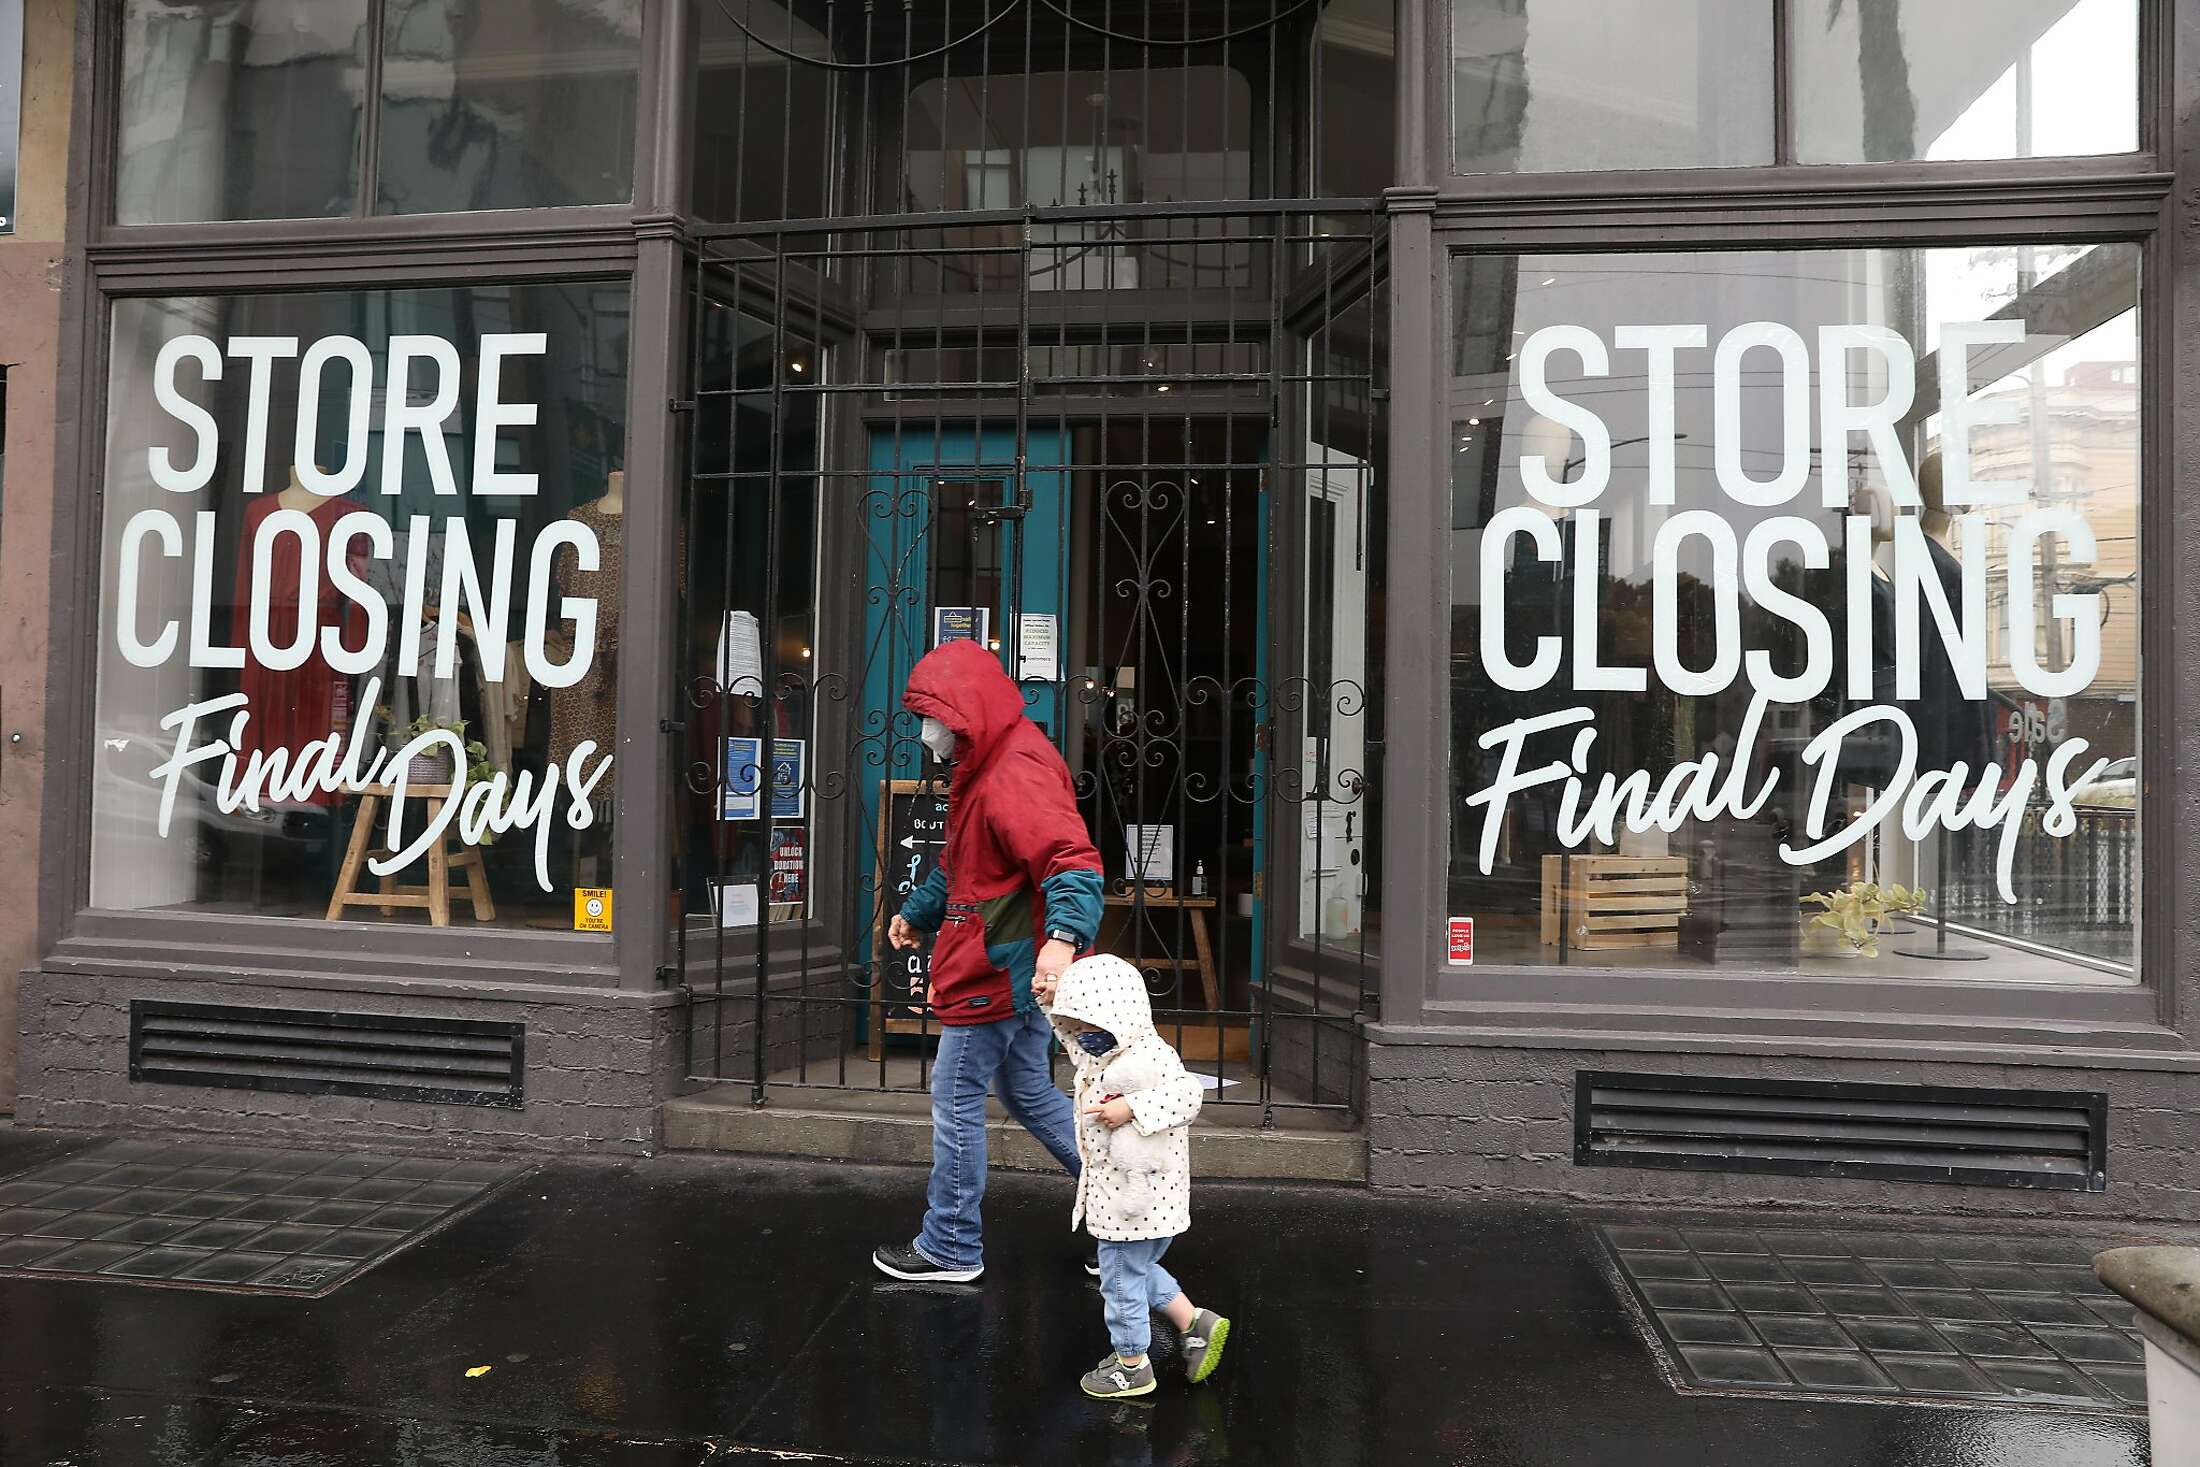
It’s been two and half years since the onset of the COVID-19 pandemic, and many businesses in San Francisco have struggled to stay afloat amidst new variants, shutdowns, and a shift to remote work. Throughout the pandemic, the spotlight has been on downtown activity as a measure of the city’s economic health and vitality – but how much worse is downtown faring in terms of business starts and closures? Are trends downtown representative of the city at large, or are other neighborhoods bolstering the city’s business activity?
A north/south divide
Since March 2020, over 27,000 businesses (or 10% of pre-pandemic businesses) of all sizes have closed across the City of San Francisco, based on real time data from the Office of the Treasurer and Tax Collector, which tracks businesses that are registered and pay taxes to the city. The Financial District has taken the biggest hit, accounting for nearly 20% of the city’s overall business closures. For every business that closed in the Financial District, less than half of one business opened (in other words, 2.2 businesses closed for every 1 business that opened). The city overall fared better, as 0.81 business openings for every business closure, largely attributable to the city’s southern-most neighborhoods such as Bayview/Hunter’s Point, Visitacion Valley, Excelsior, Portola, and Oceanview/Merced/Ingleside, all of which saw more business openings than closures during the pandemic.
Compare these trends to pre-pandemic patterns from 2018 and 2019, when 75% of the city’s neighborhoods saw more openings than closures. While growth in the Financial District was not nearly as fast as growth in other parts of the city, downtown San Francisco still experienced slightly more business openings than closures, keeping its net growth in businesses above zero.
Restructuring away from downtown and towards smaller community hubs
On the surface it may appear that the pandemic initiated a restructuring of business away from downtown and toward southern neighborhoods and community hubs. While this is partially true, this trend started long before the pandemic. In 2010, new business openings in downtown and its surrounds comprised nearly 30% of all openings citywide. Over time, this share dwindled, hitting 23% in 2019 and declining another 4 percentage points since the onset of the pandemic. The city’s southernmost neighborhoods, on the flip side, saw the inverse effect, comprising only 11% of new business openings in 2010, growing steadily and hitting an all-time high of 16% in 2022.
Heading in the right direction
So far in 2022, the city is seeing more business openings to closures, with a higher ratio than in years leading up to the pandemic. As businesses and employees alike enter an age of remote work, residential neighborhoods are seeing an uptick in business activity and commercial vitality, compensating for the decline in new businesses in and around downtown. Thus far in 2022, 1.23 businesses have opened across San Francisco for every business that has closed.
The overall number of new businesses is still far below what it was pre-pandemic. In 2019 from January to August, San Francisco saw 10,168 new businesses open, compared to 6,502 for the same months in 2022. However, factoring in the number of business closures, the city is still netting a higher number of new businesses (1,195 so far this year versus 1,047 for the same period in 2019). While we may see fewer businesses open than the historic average, we’re also seeing far fewer closures.