
Pace of Recovery
November 23, 2020
The highlights:
• The Bay Area recorded substantial (32,800) job growth in October as many counties relaxed restrictions on reopening.
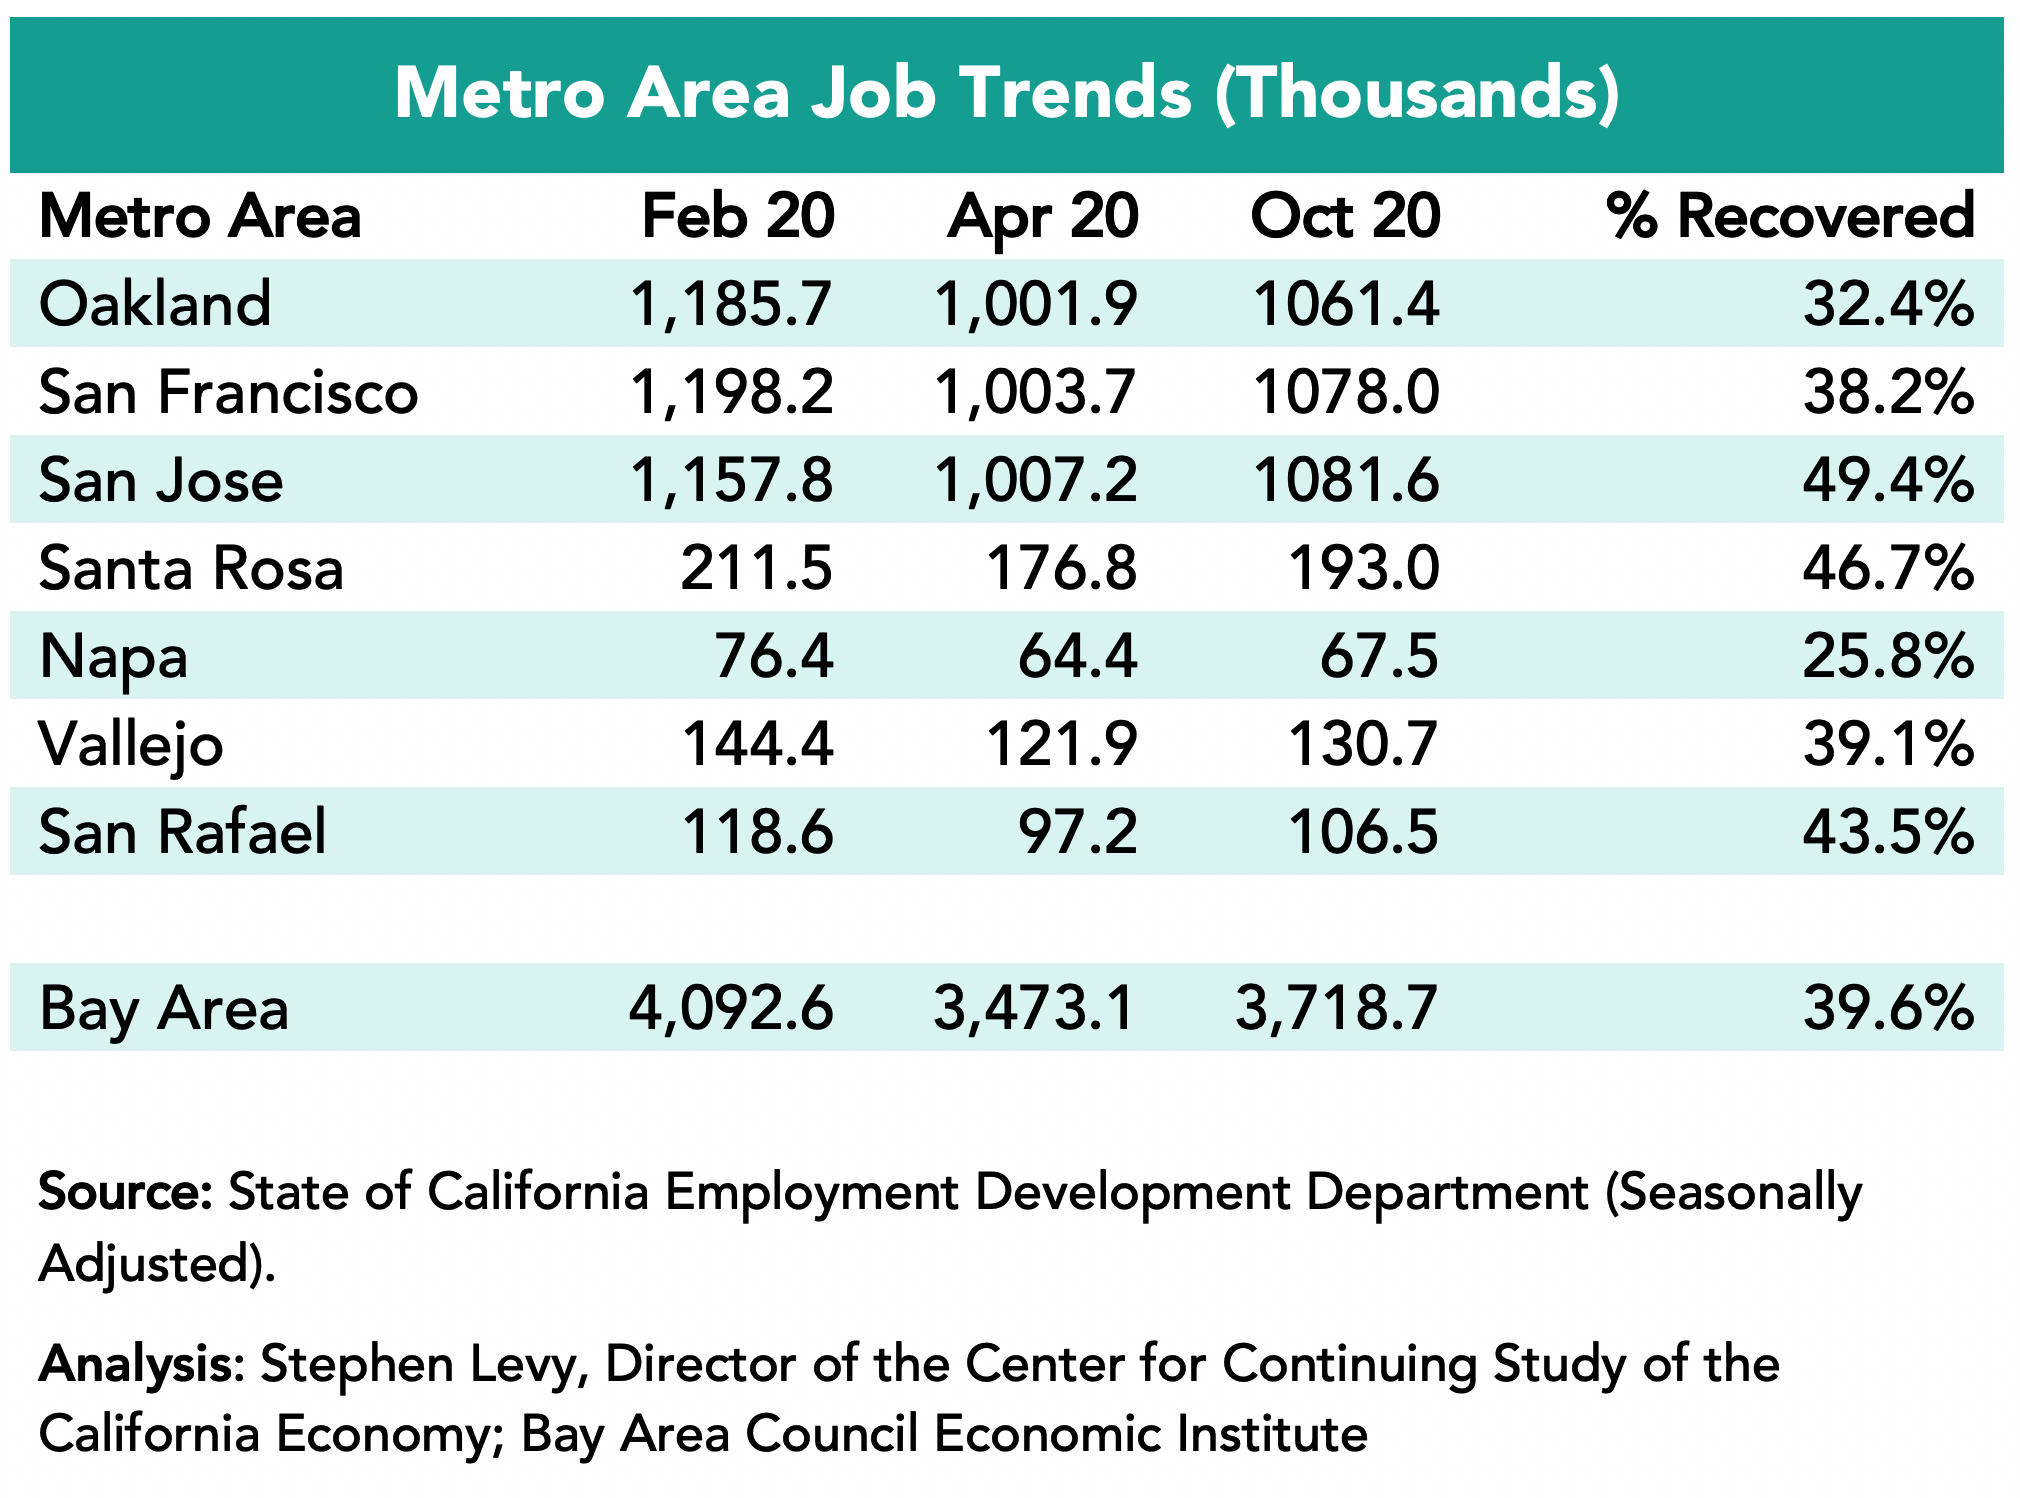
• Between April and October, the Bay Area recovered 39.6% of the jobs lost between February and April trailing the state and nation. The pace of Bay Area recovery accelerated in October. However, the recent restrictions imposed should cause a temporary slowing in job growth.
• Longer term prospects have improved with the Biden election. The Bay Area will benefit from a more welcoming immigration policy, a more collaborative approach to foreign trade and the new administration’s proposals if they can be implemented.
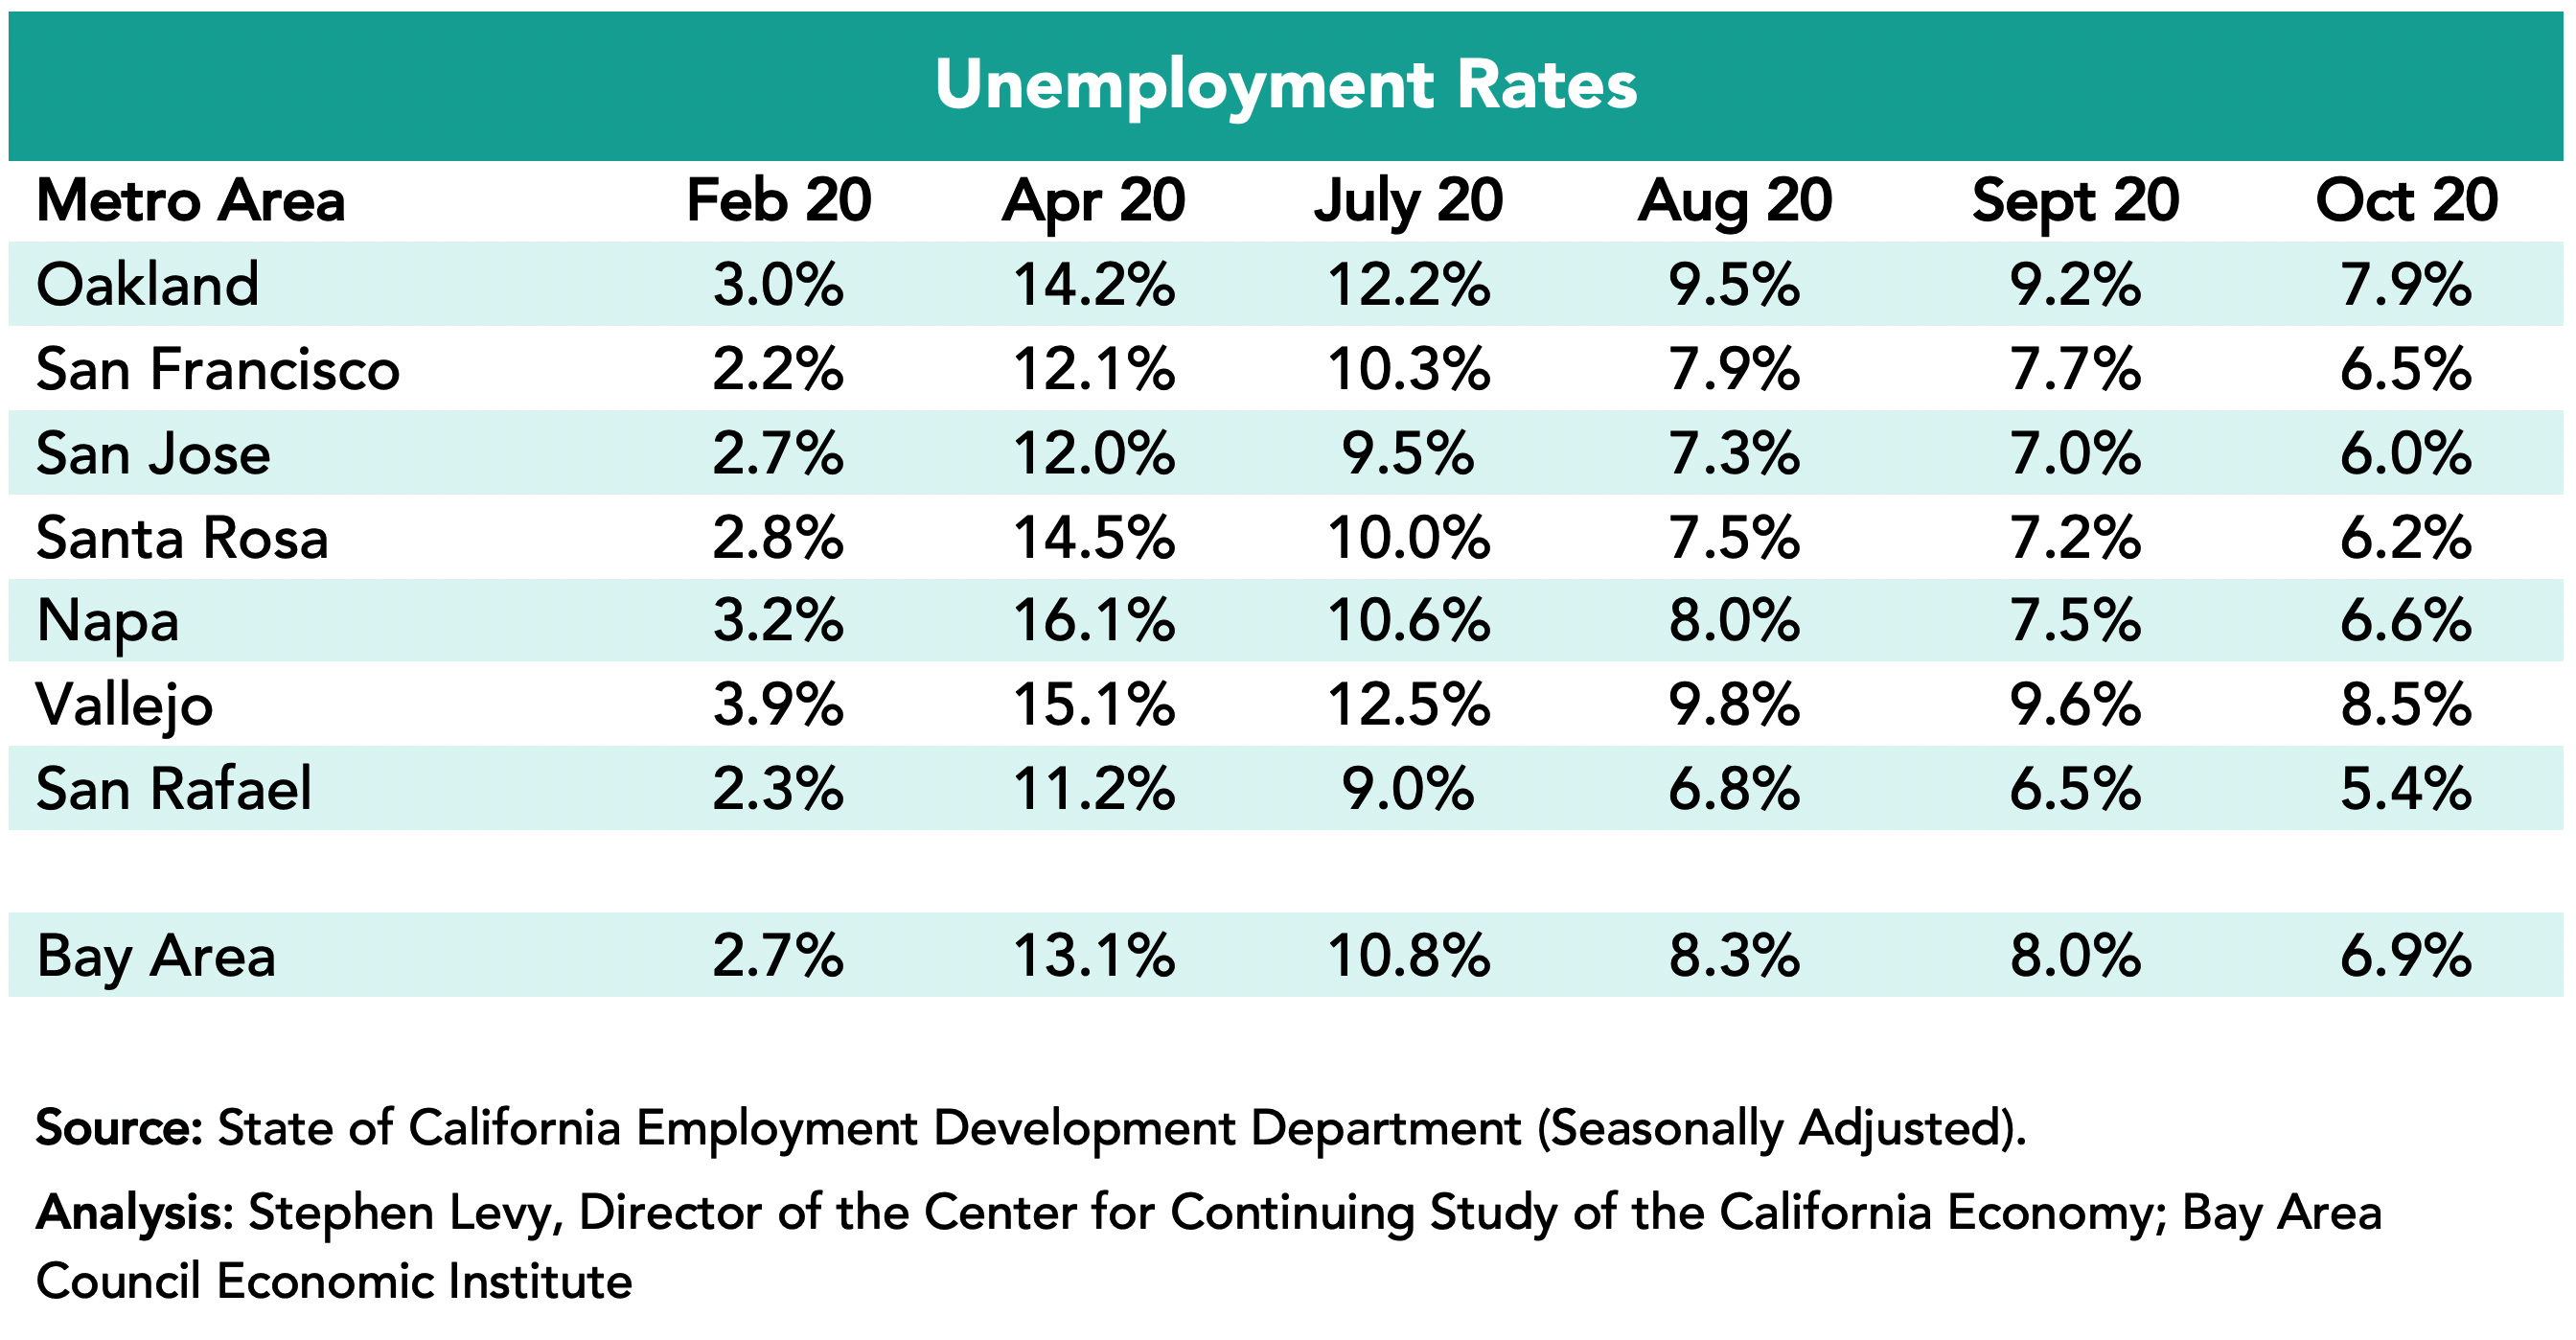
• The regional unemployment rate was 2.7% in February, 13.1% in April and 6.9% in October. For the first time in many months, a large number of residents rejoined the workforce.
• This update also looks at industry sector trends, air travel data, and the Bay Area Regional Housing Needs Assessment (RHNA)
California and the Bay Area Lagged the Nation in Job Recovery in October Despite Strong Job Gains
The state and Bay Area recovered a smaller share of the jobs lost by October compared to the nation. This is the result of our more cautious reopening pace and the more than 80% decline in business and visitor travel and resulting loss of spending and jobs. The Bay Area did see more reopenings in October and an increase in the % of jobs recovered.
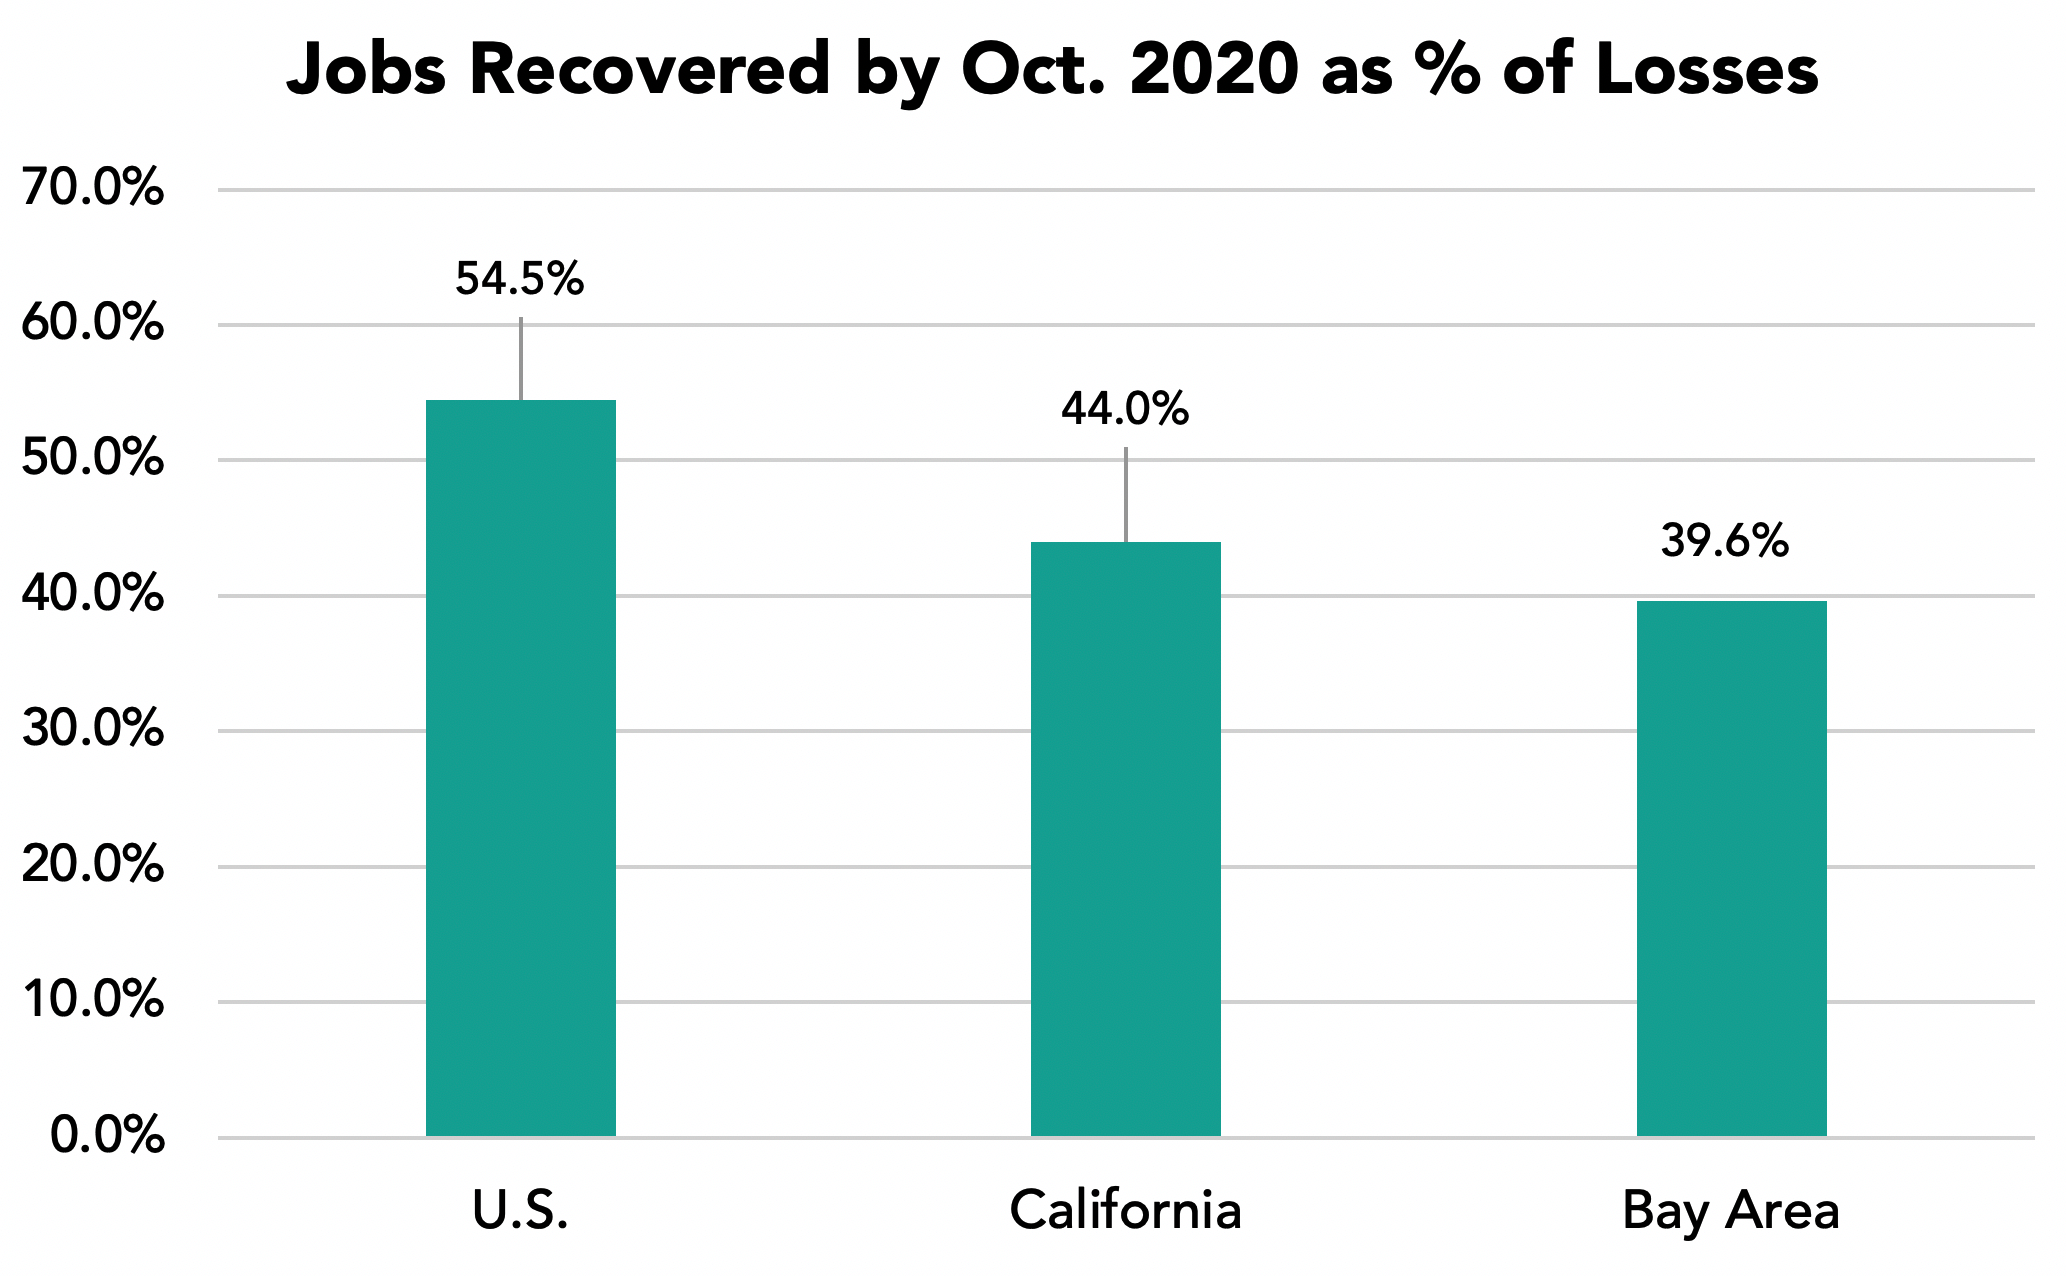
The share of jobs recovered by October varies somewhat among the metro areas with the largest share recovered in the San Jose metro area (49.6%) and the smallest share in the Napa metro area (25.8%).
Unemployment rates rose sharply between February and April throughout the region. October data showed large declines in unemployment rates across the region. The regional unemployment rate declined from 13.1% in April to 8.0% in September and 6.9% in October. All metro areas had rates below 9%.
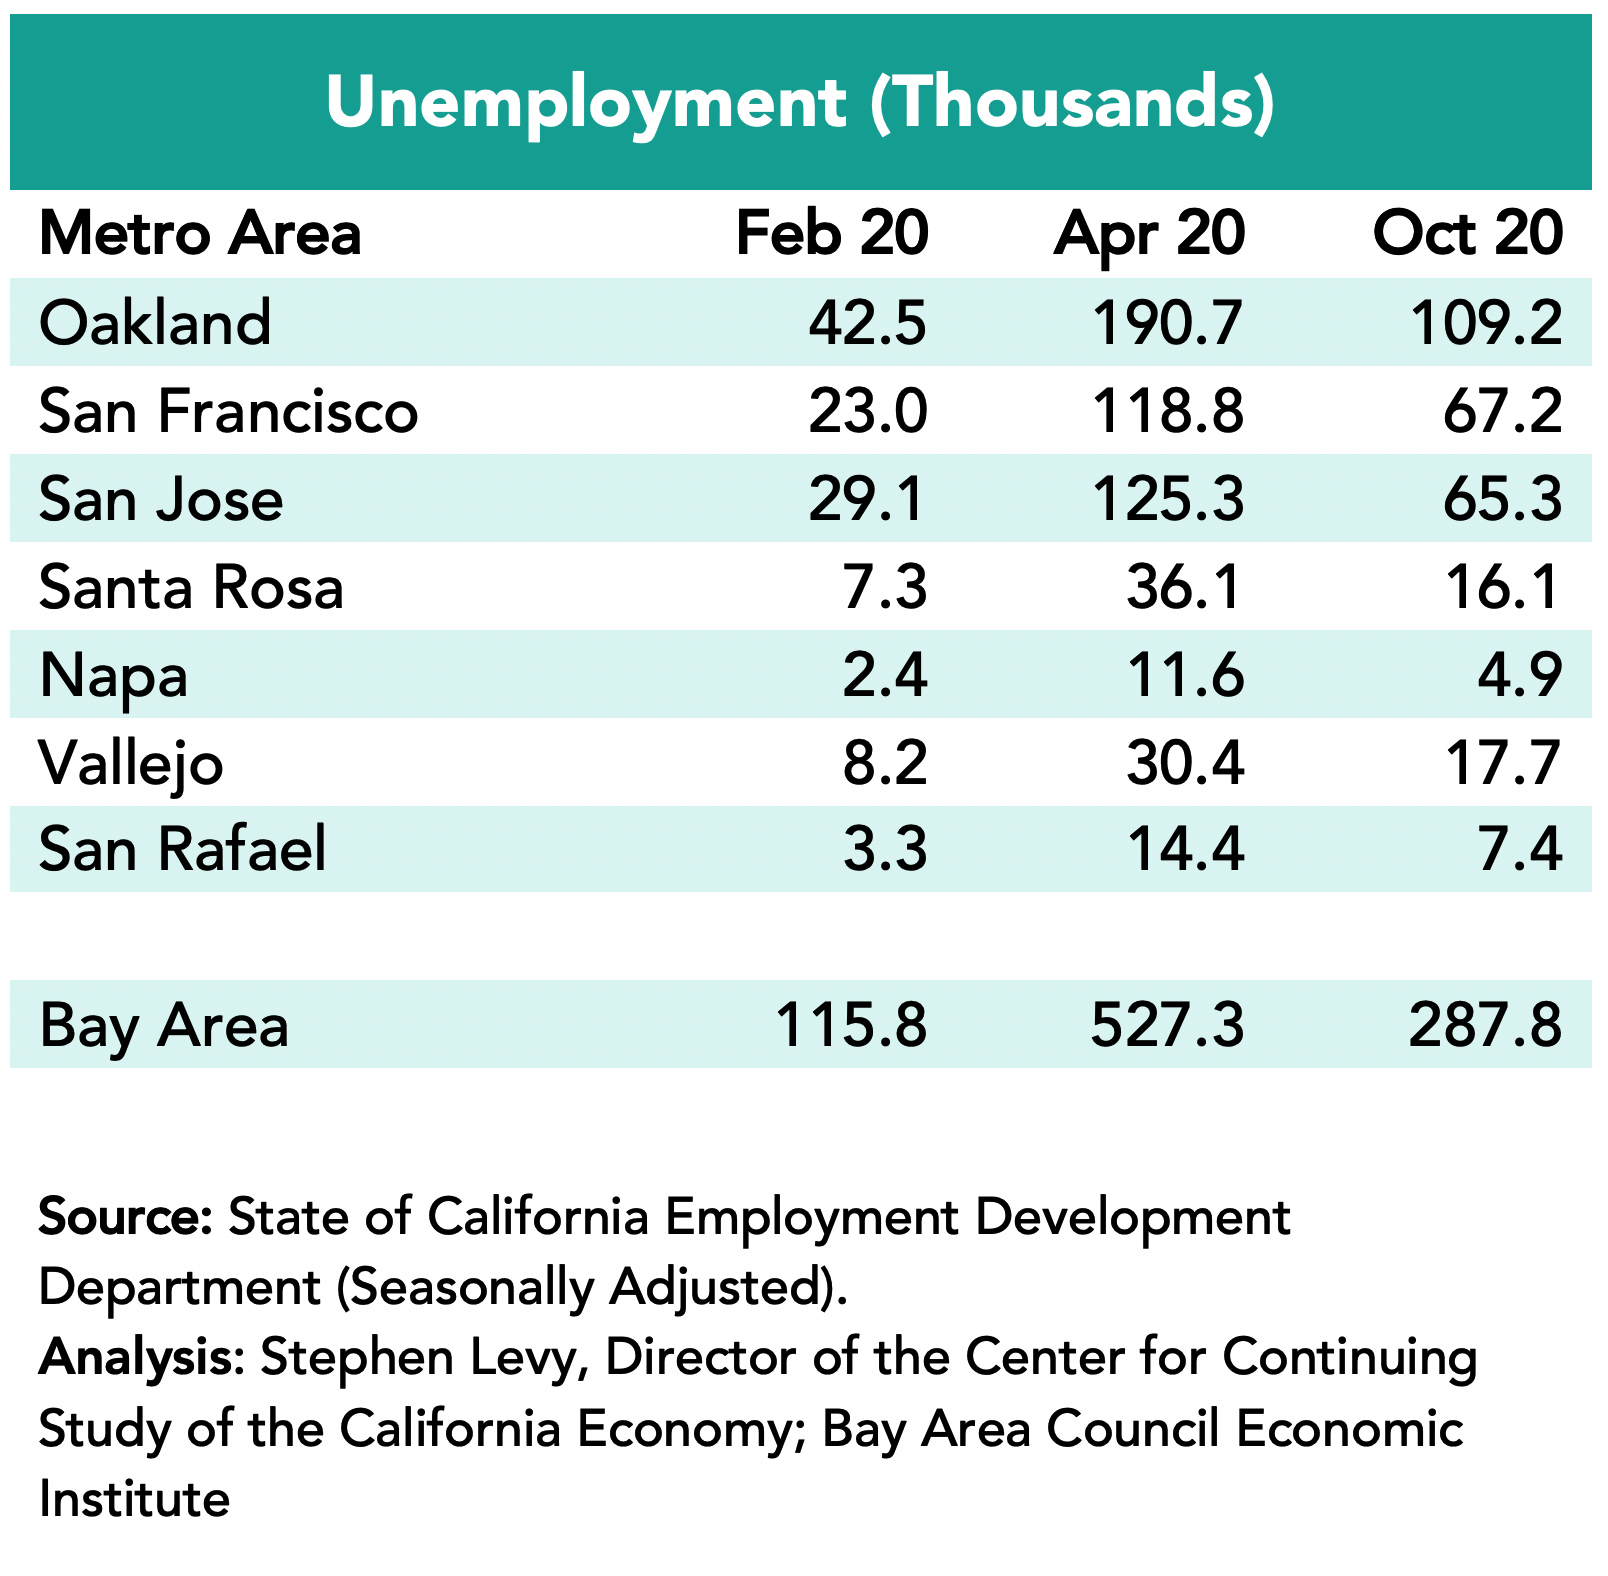
The number of unemployed residents fell quite a bit in October to 287,800 from 325,200 in September. But there are still more than twice as many residents unemployed compared to February before the pandemic spread.
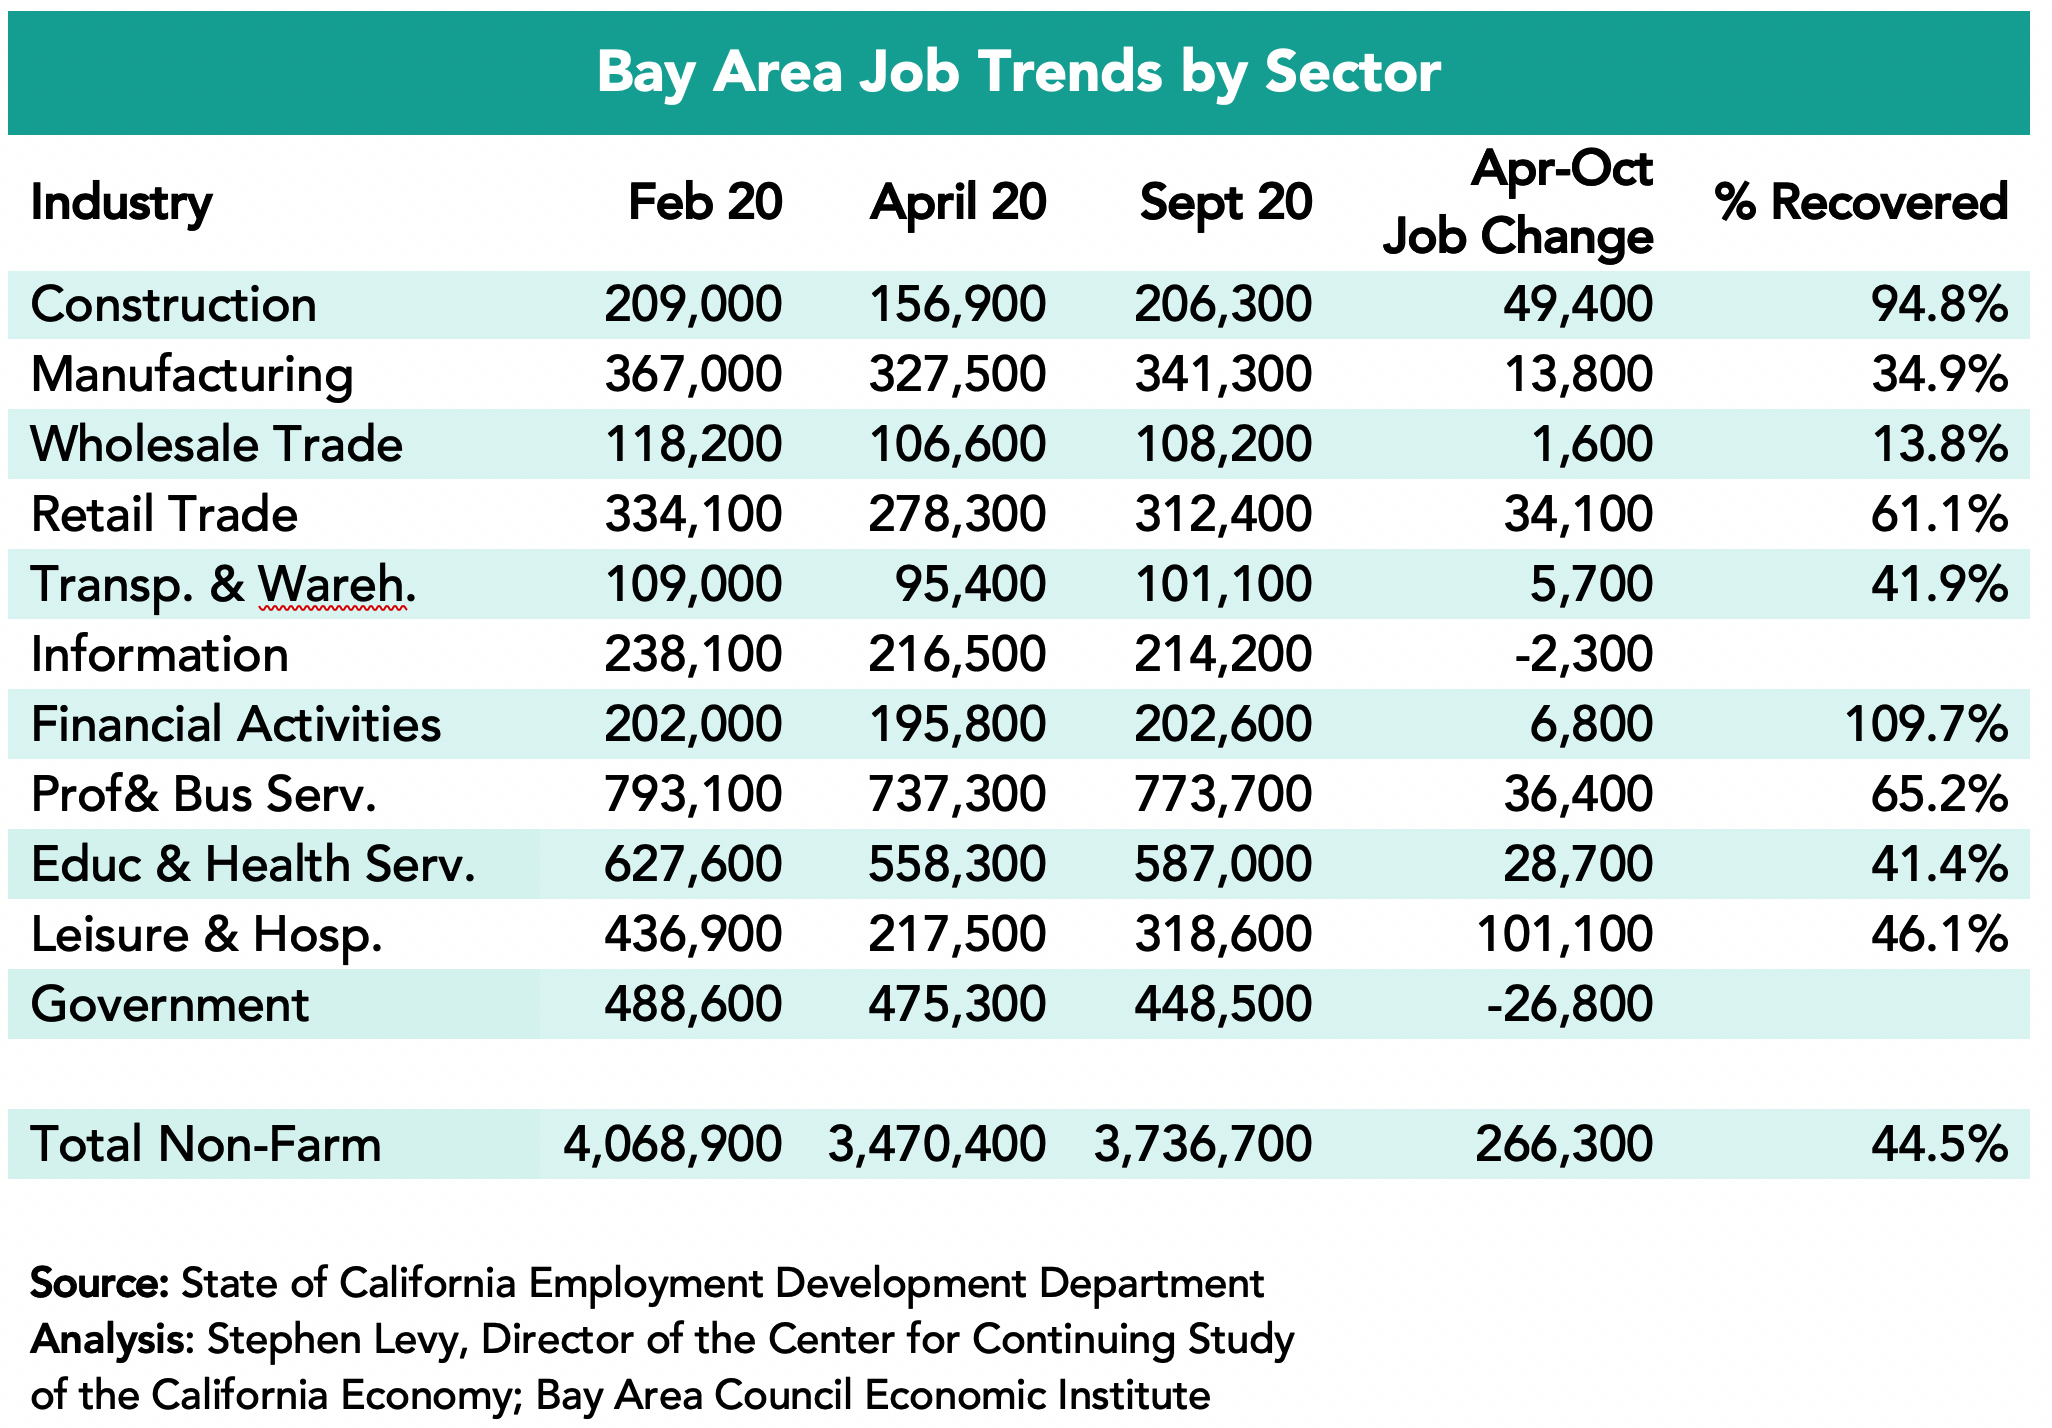
The largest job losses were in Leisure and Hospitality where half the jobs went away between February and April. Financial Activities (109.7%) and Construction showed the biggest recovery by October (94.8%) while the Wholesale Trade sector had a relatively small recovery rate so far. Government and Information are the only sectors to lose jobs after April. The overall job losses and recovery are affected by the continuing decline in Information and Government jobs.
Air travel plummeted after February with losses of 90% or more. There was a small rebound since August but air travel remains deeply depressed.
Oakland airport reported a 68% decline in October while SFO reported an 80% decline in September close to the 81% decline reported by SJC. Airlines are reporting holiday cancellations after the stay at home guidance from health officials.
The ABAG RHNA allocation methodology committee made their final recommendation on Friday. The regional allocation from HCD is described first and then the decision on local area allocation afterwards.
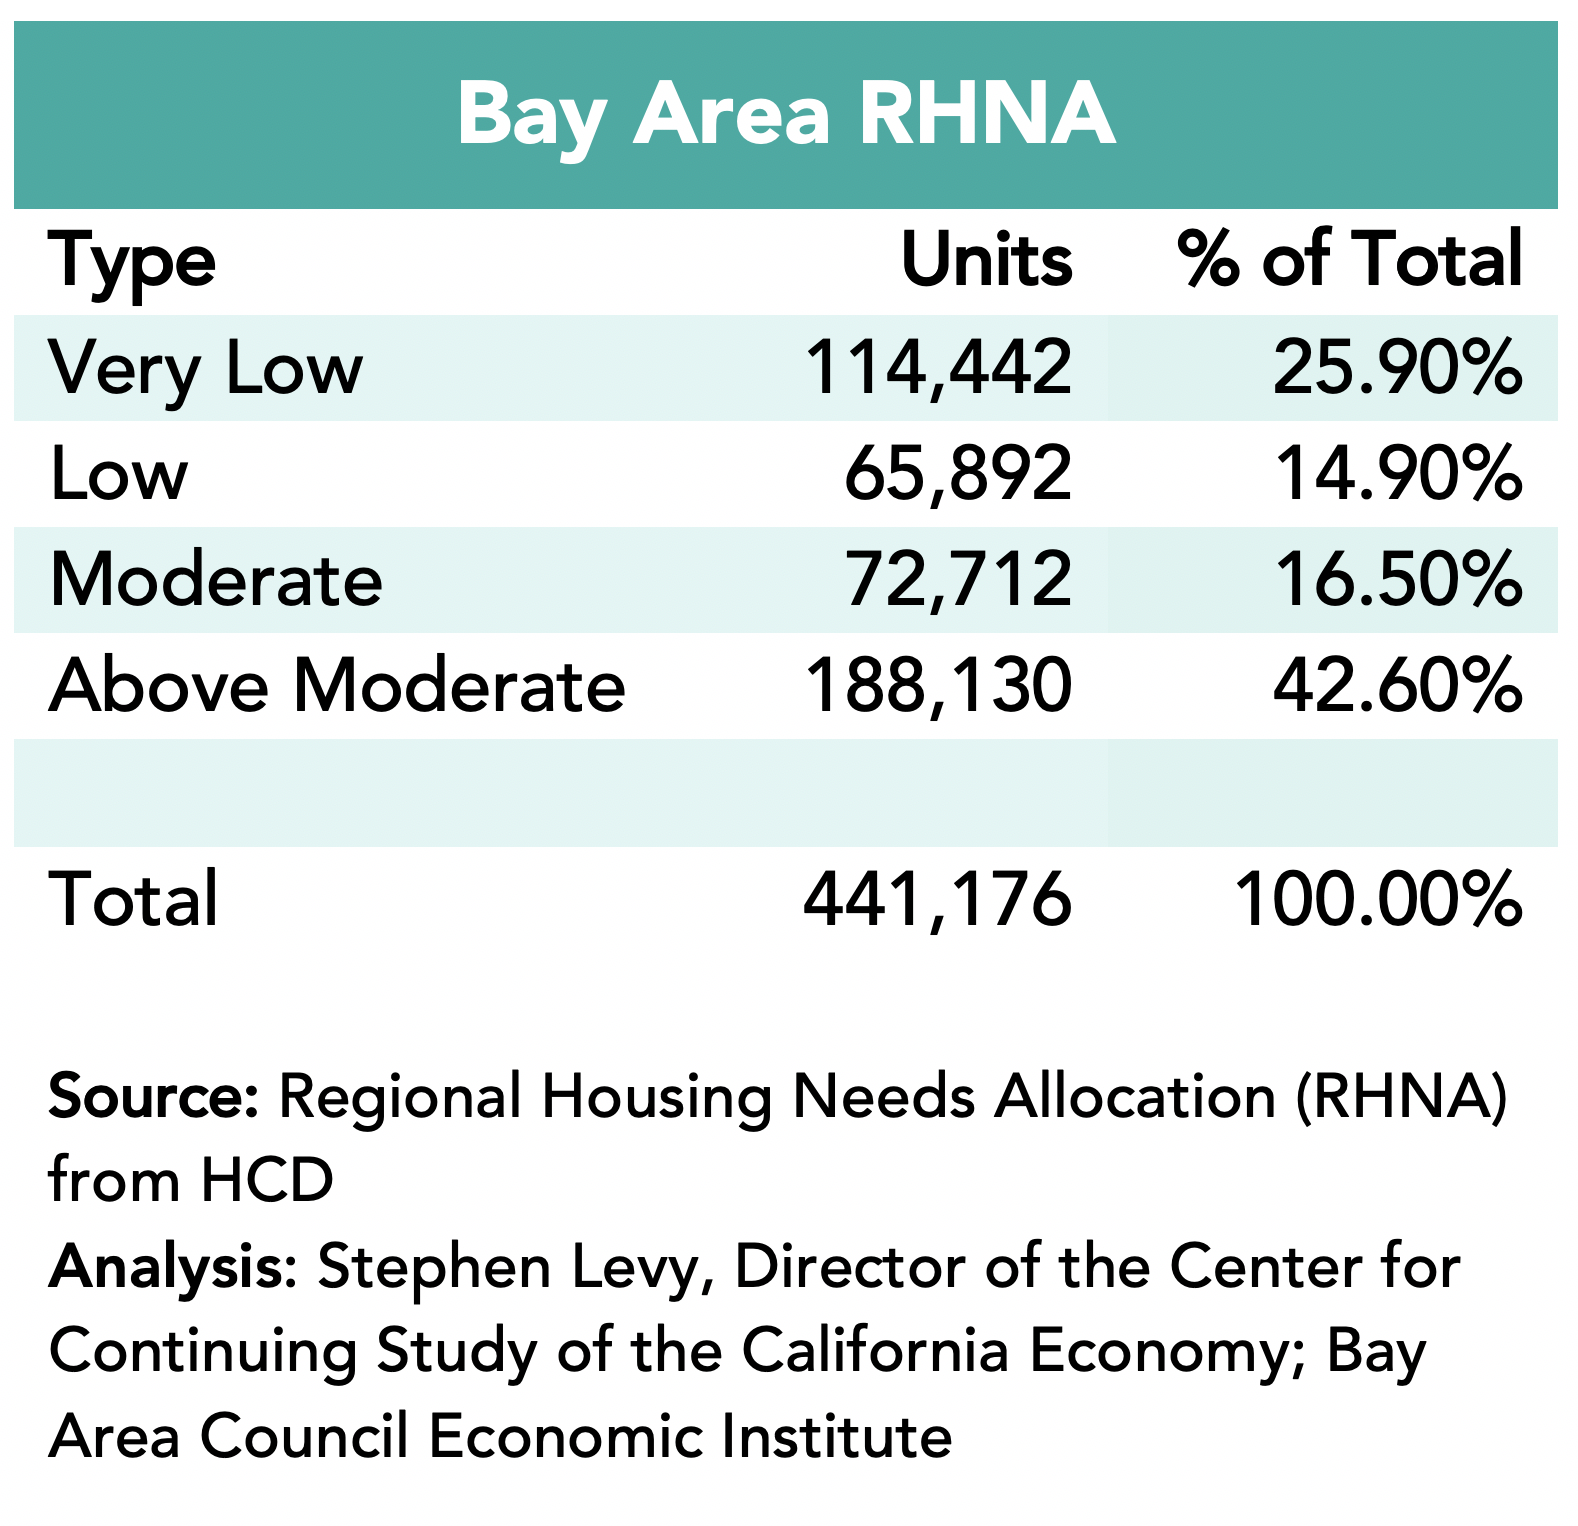
The California Department of Housing and Community Development (HCD) just released the Regional Housing Needs Determination (RHNA) for the Bay Area for the period from June 2022 through December 2030. The HCD letter can be seen at https://hcd.ca.gov/community-development/housing-element/docs/ABAGRHNA-Final060920(r).pdf. The Bay Area target is 135% higher than the current target and includes 441,176 units distributed among four income groups – very low (for residents up to 50% of area median income (AMI)), low (50% to 80% of AMI), moderate (80% to 120% of AMI) and above moderate. A majority of the units needed are in the very low to moderate income groups.
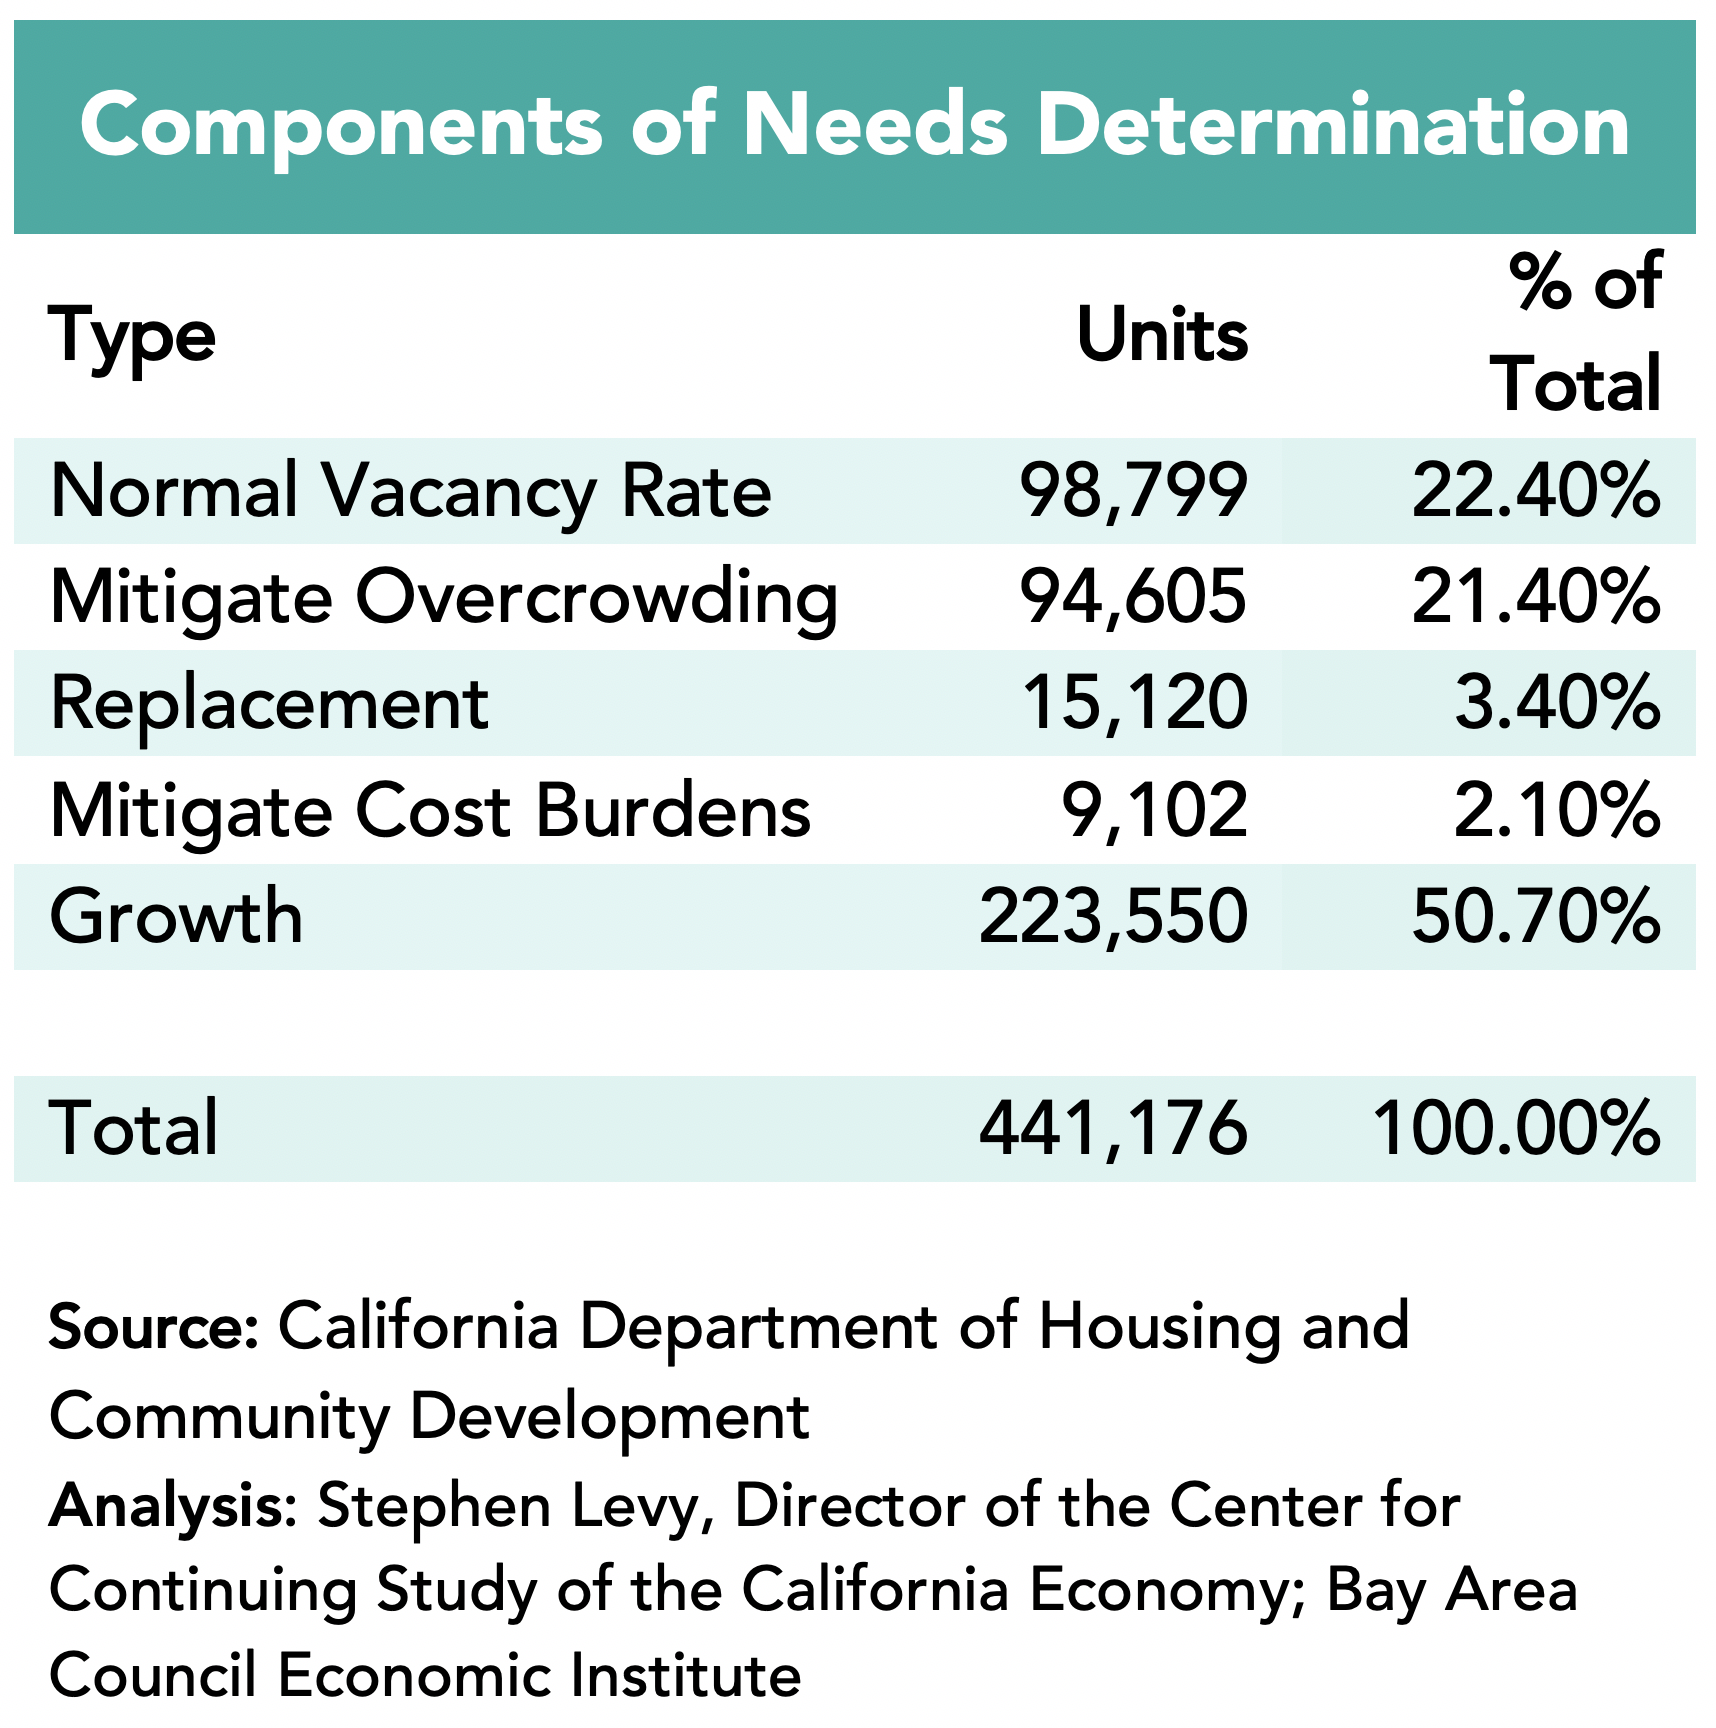
HCD used a new methodology to develop the needs assessment. Recent state legislation required HCD to include housing units to reduce the number of households that are overcrowded and cost-burdened. HCD compared the Bay Area to shares in comparable regions. HCD has always included units to return the region to a normal vacancy rate and to replace demolished housing.
The final determinant is allowance for units to accommodate the region’s expected growth. HCD used new population projections from the state Department of Finance (DOF) instead of the regional growth forecast developed by ABAG that projected 400,000 more residents than DOF in 2030.
Only half of the Bay Area housing needs according to this analysis come from growth. The rest come as a result of correcting existing shortages.
The ABAG RHNA allocation methodology committee recommended an approach that allocates an above average share of the regional RHNA to cities that are considered high opportunity areas and cities that have good auto and transit proximity to jobs. The result is that the largest % increases in housing went to communities along the peninsula.
The details and city by city allocations are found in the meeting materials that can be found here.
The recommended allocation is alternative 8A that allocates 70% of the low and very low-income units based on high opportunity areas and 15% each to proximity to jobs for transit and autos. For moderate and above moderate income units the allocation was based 40% on high opportunity areas and 60% on auto proximity to jobs.