Pace of Recovery
August 25, 2020
The highlights:
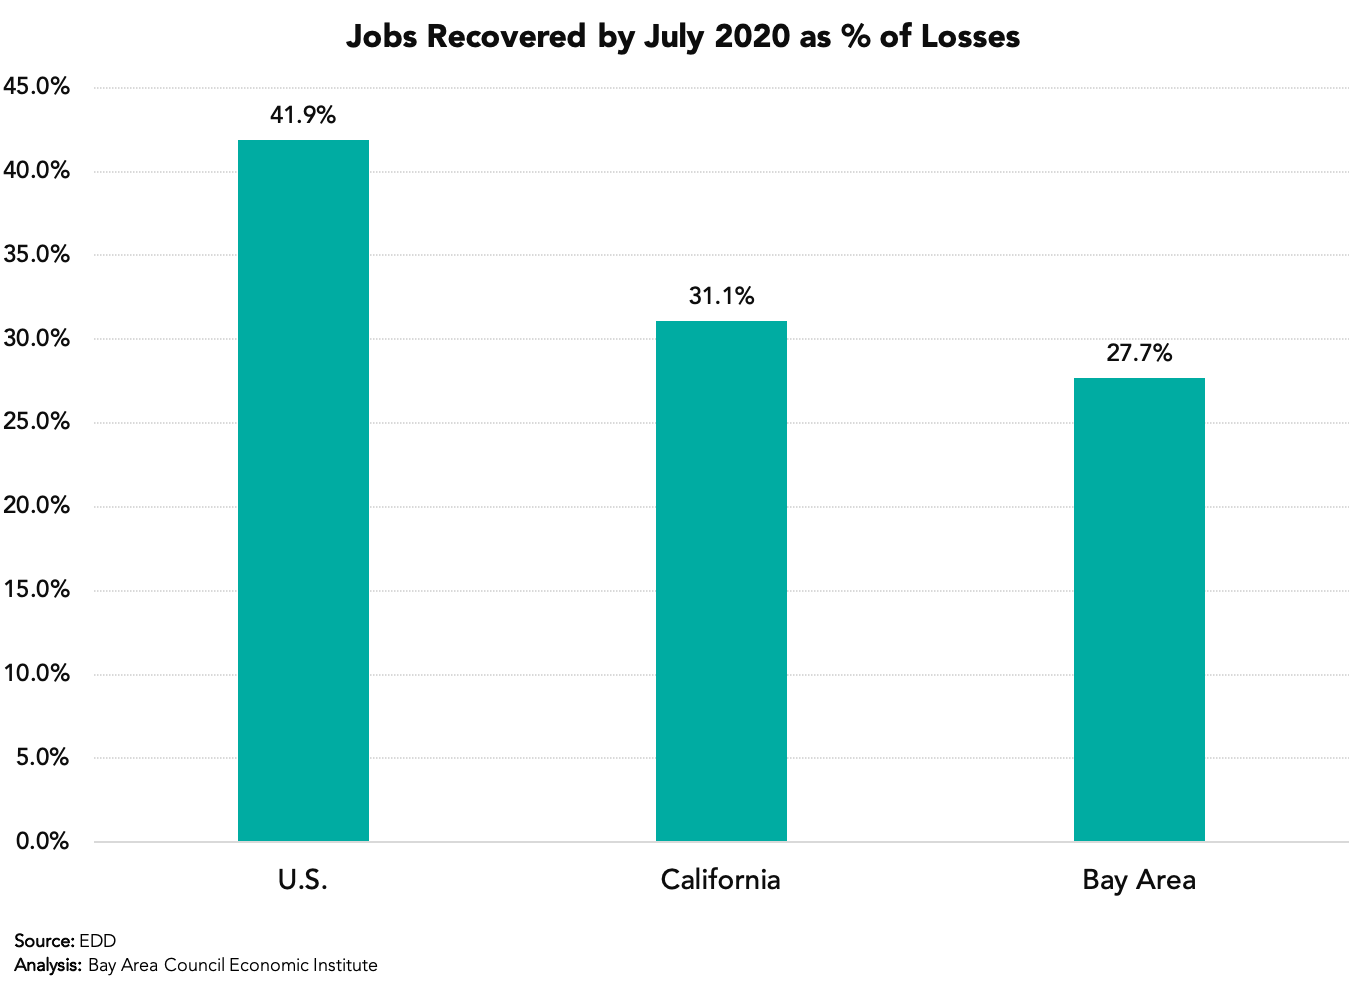
• Between April and July, the Bay Area recovered just over one quarter of the jobs lost between February and April trailing the state and nation.
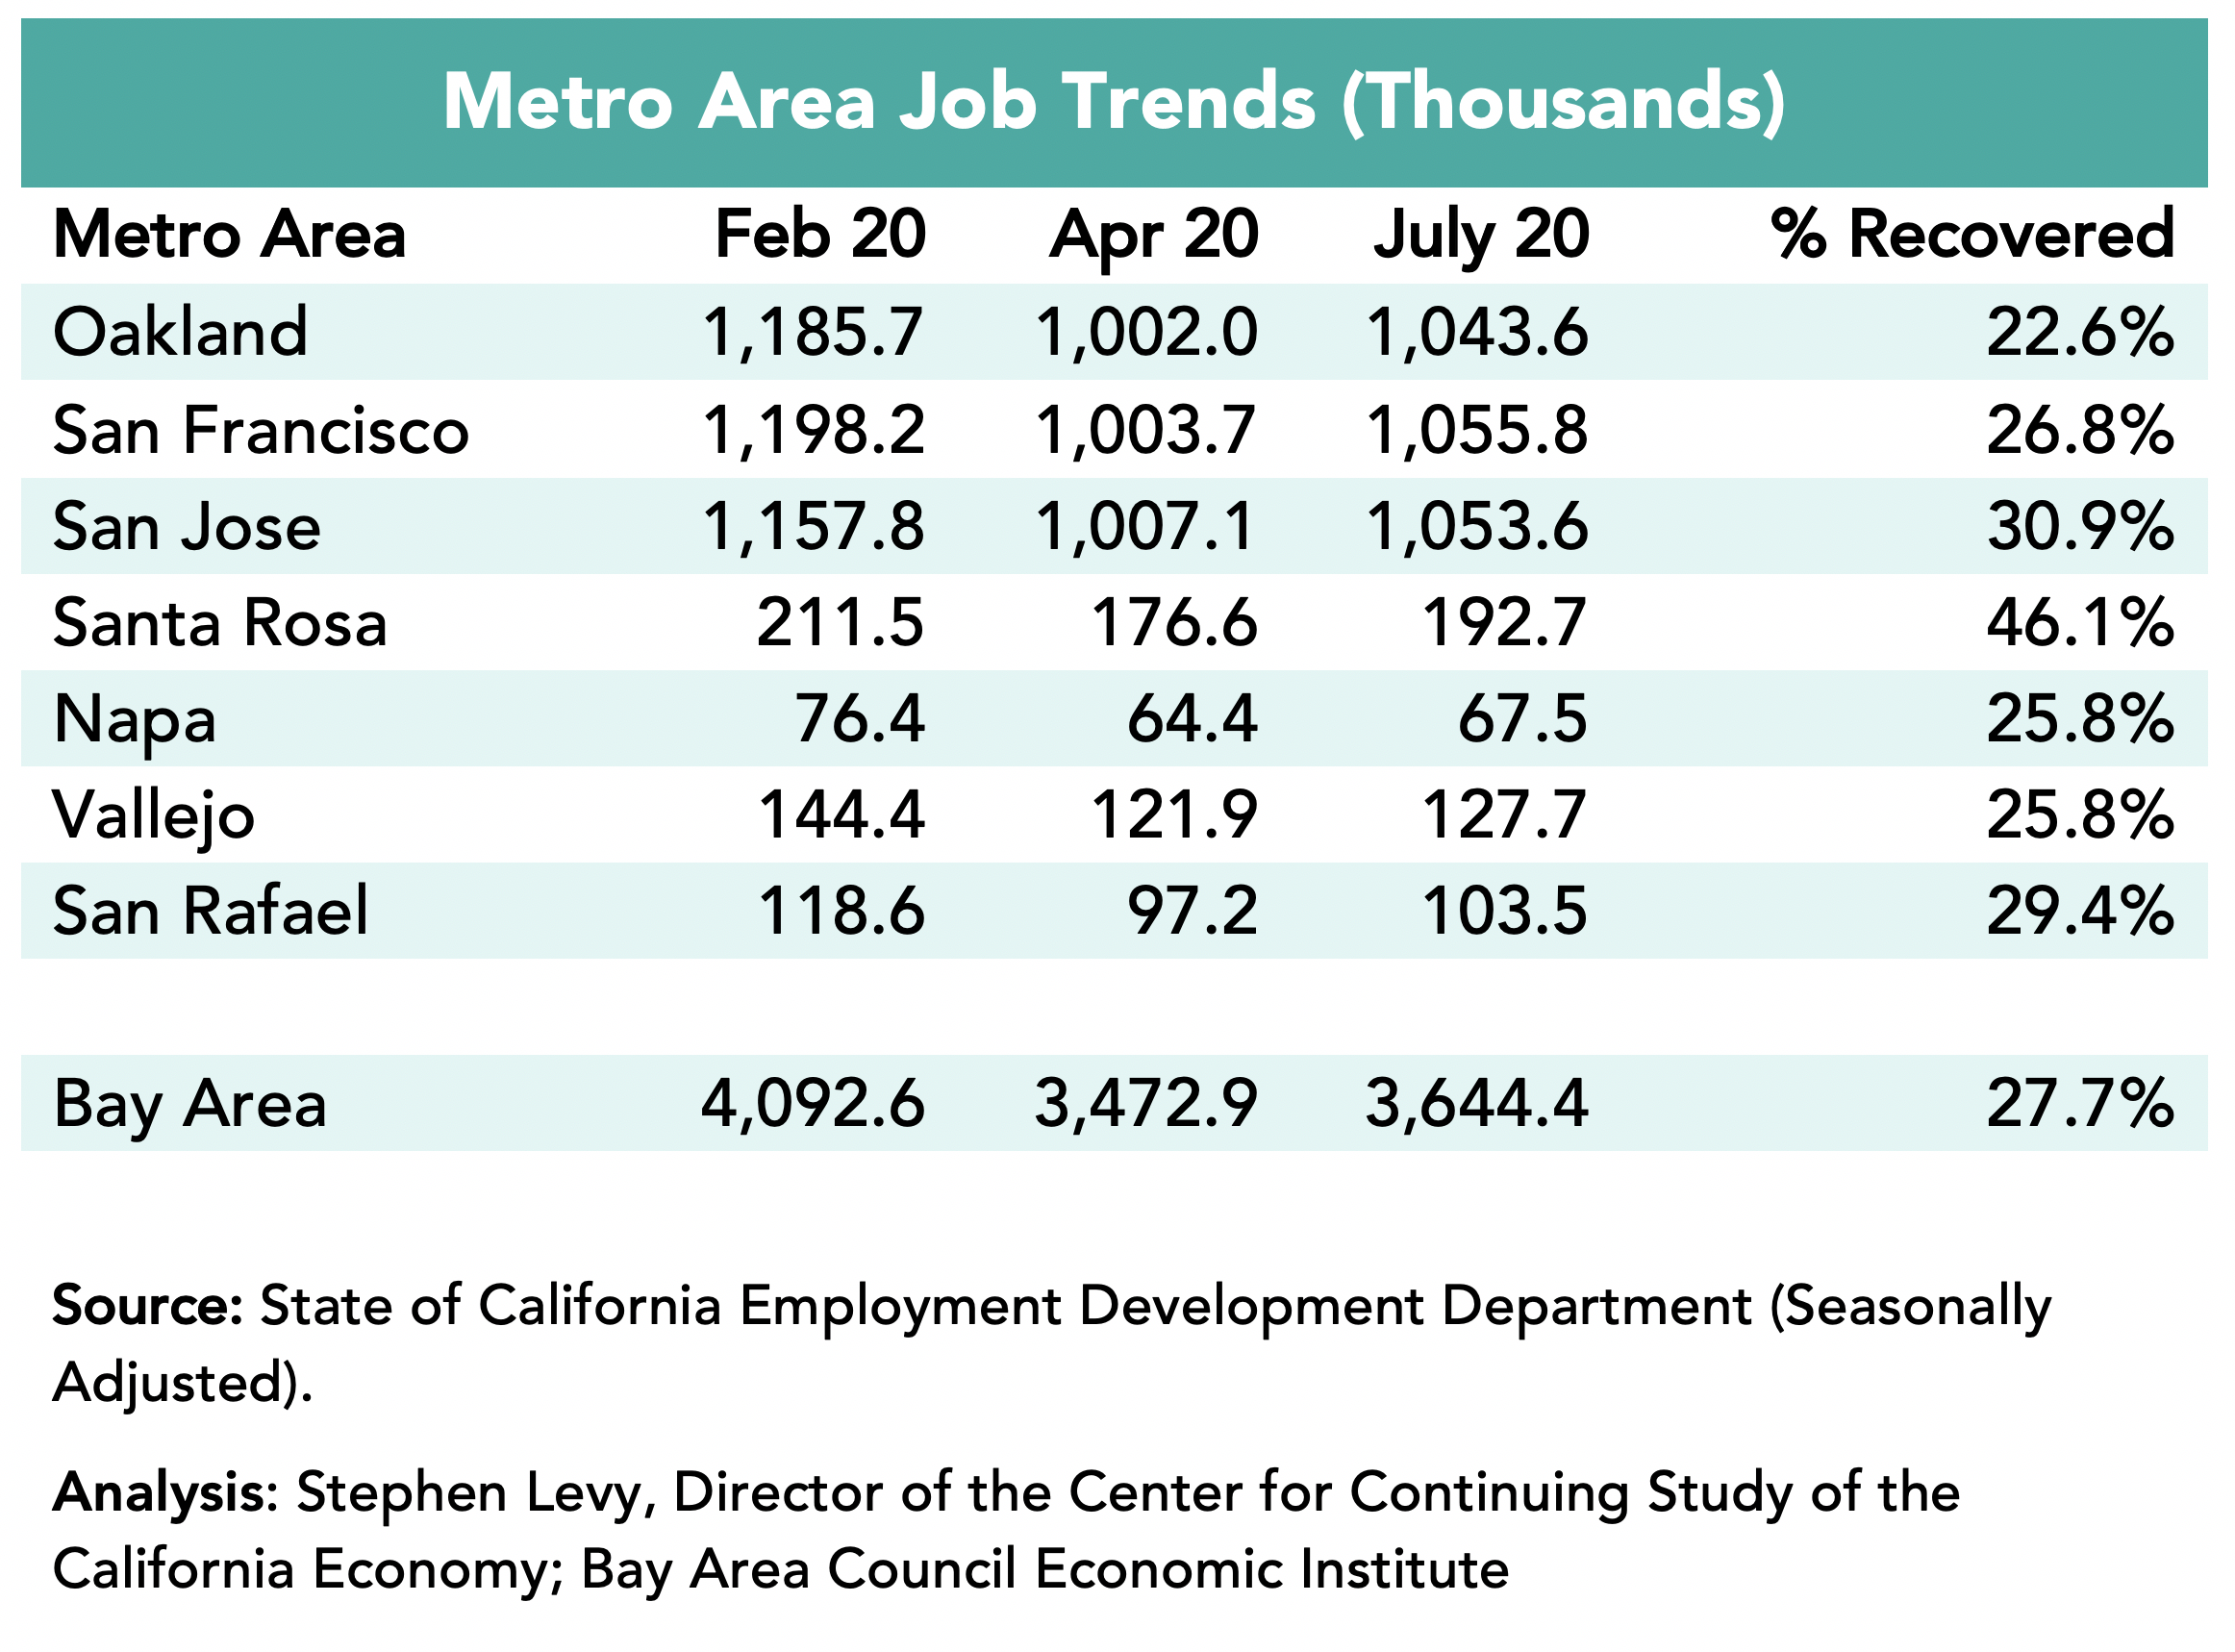
• The Santa Rosa, San Rafael and San Jose metro areas recovered the highest % of jobs lost.
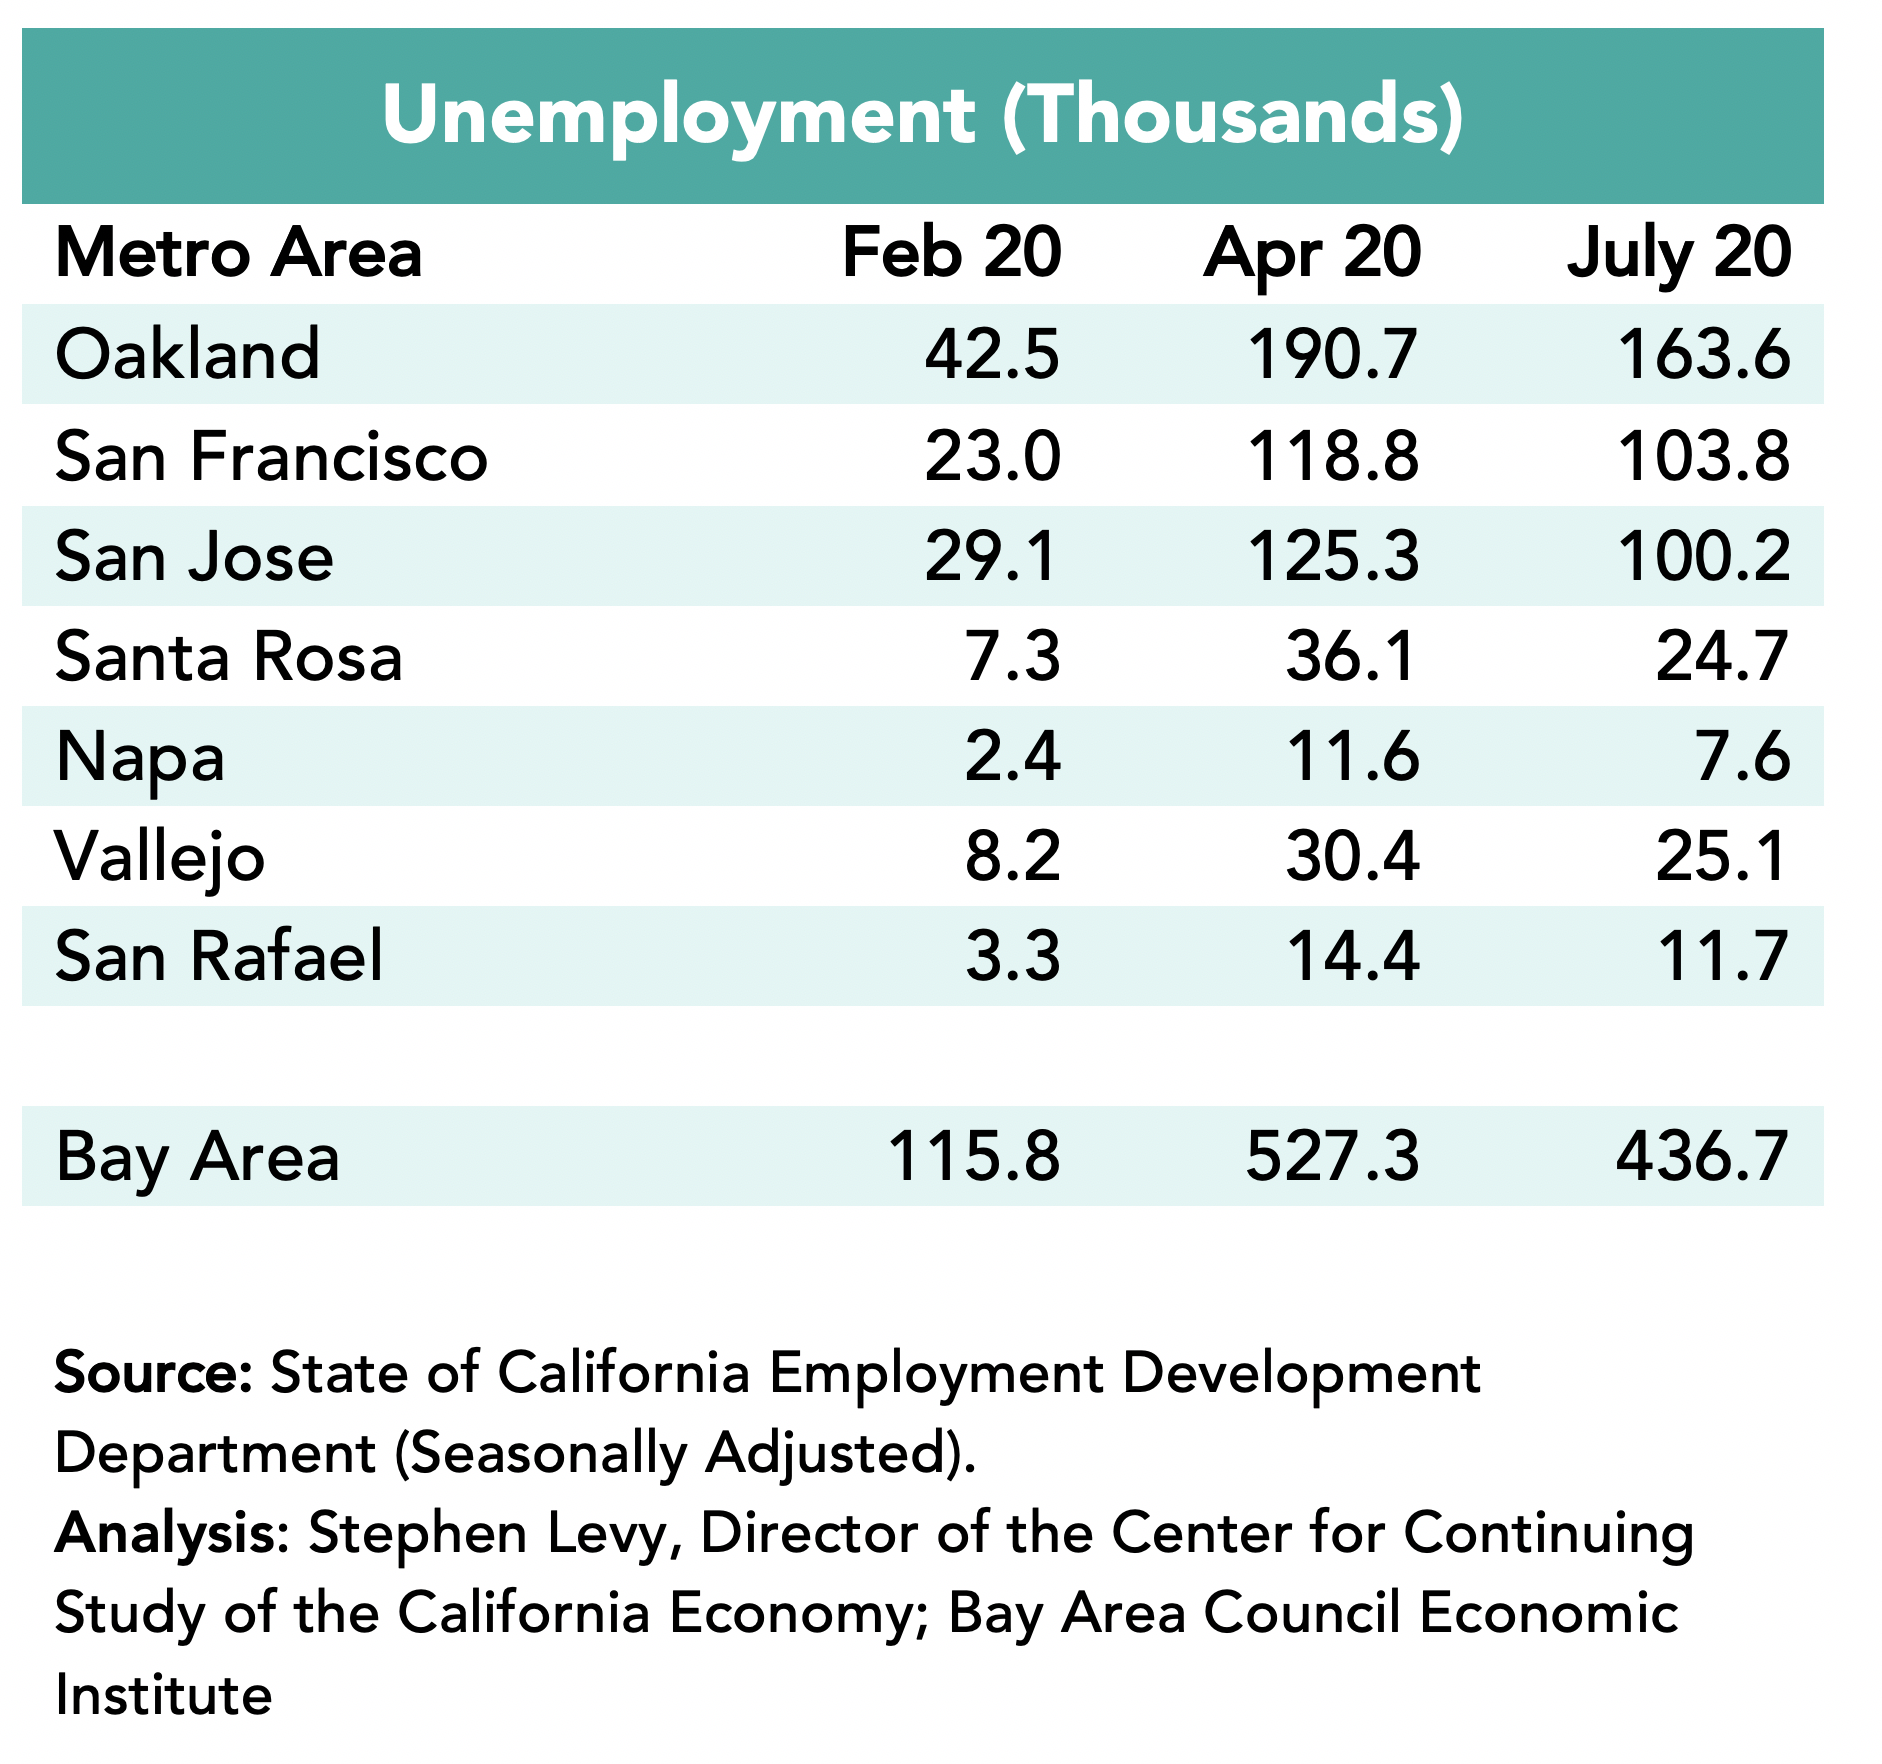
• The regional unemployment rate was 2.7% in February, 13.1% in April and 10.6% in July. Unemployment rates declined only slightly in the three large metro areas. Total unemployment declined only slightly from 527,300 in April to 436,700 in July.
• This update also looks at industry sector trends, air travel data and the Bay Area Regional Housing Needs Assessment (RHNA)
California and the Bay Area Lagged the Nation in Job Recovery in June
The state and Bay Area recovered just over one quarter of the jobs lost by July compared to 1/3 for the nation. This is most likely the result of our more cautious reopening pace. The July data shows the impact of restrictions in states like Florida, Texas and Arizona as well as the recent restrictions in California and the Bay Area.
The share or jobs recovered by July varies among the metro areas with larger gains in the smaller metro areas except for the relatively strong performance in the San Jose metro area.
Unemployment rates rose sharply between February and April throughout the region. The regional unemployment rate declined from 13.1% in April to 10.6% in July. As of July, three of the seven metro areas finally returned to single digit unemployment rates.
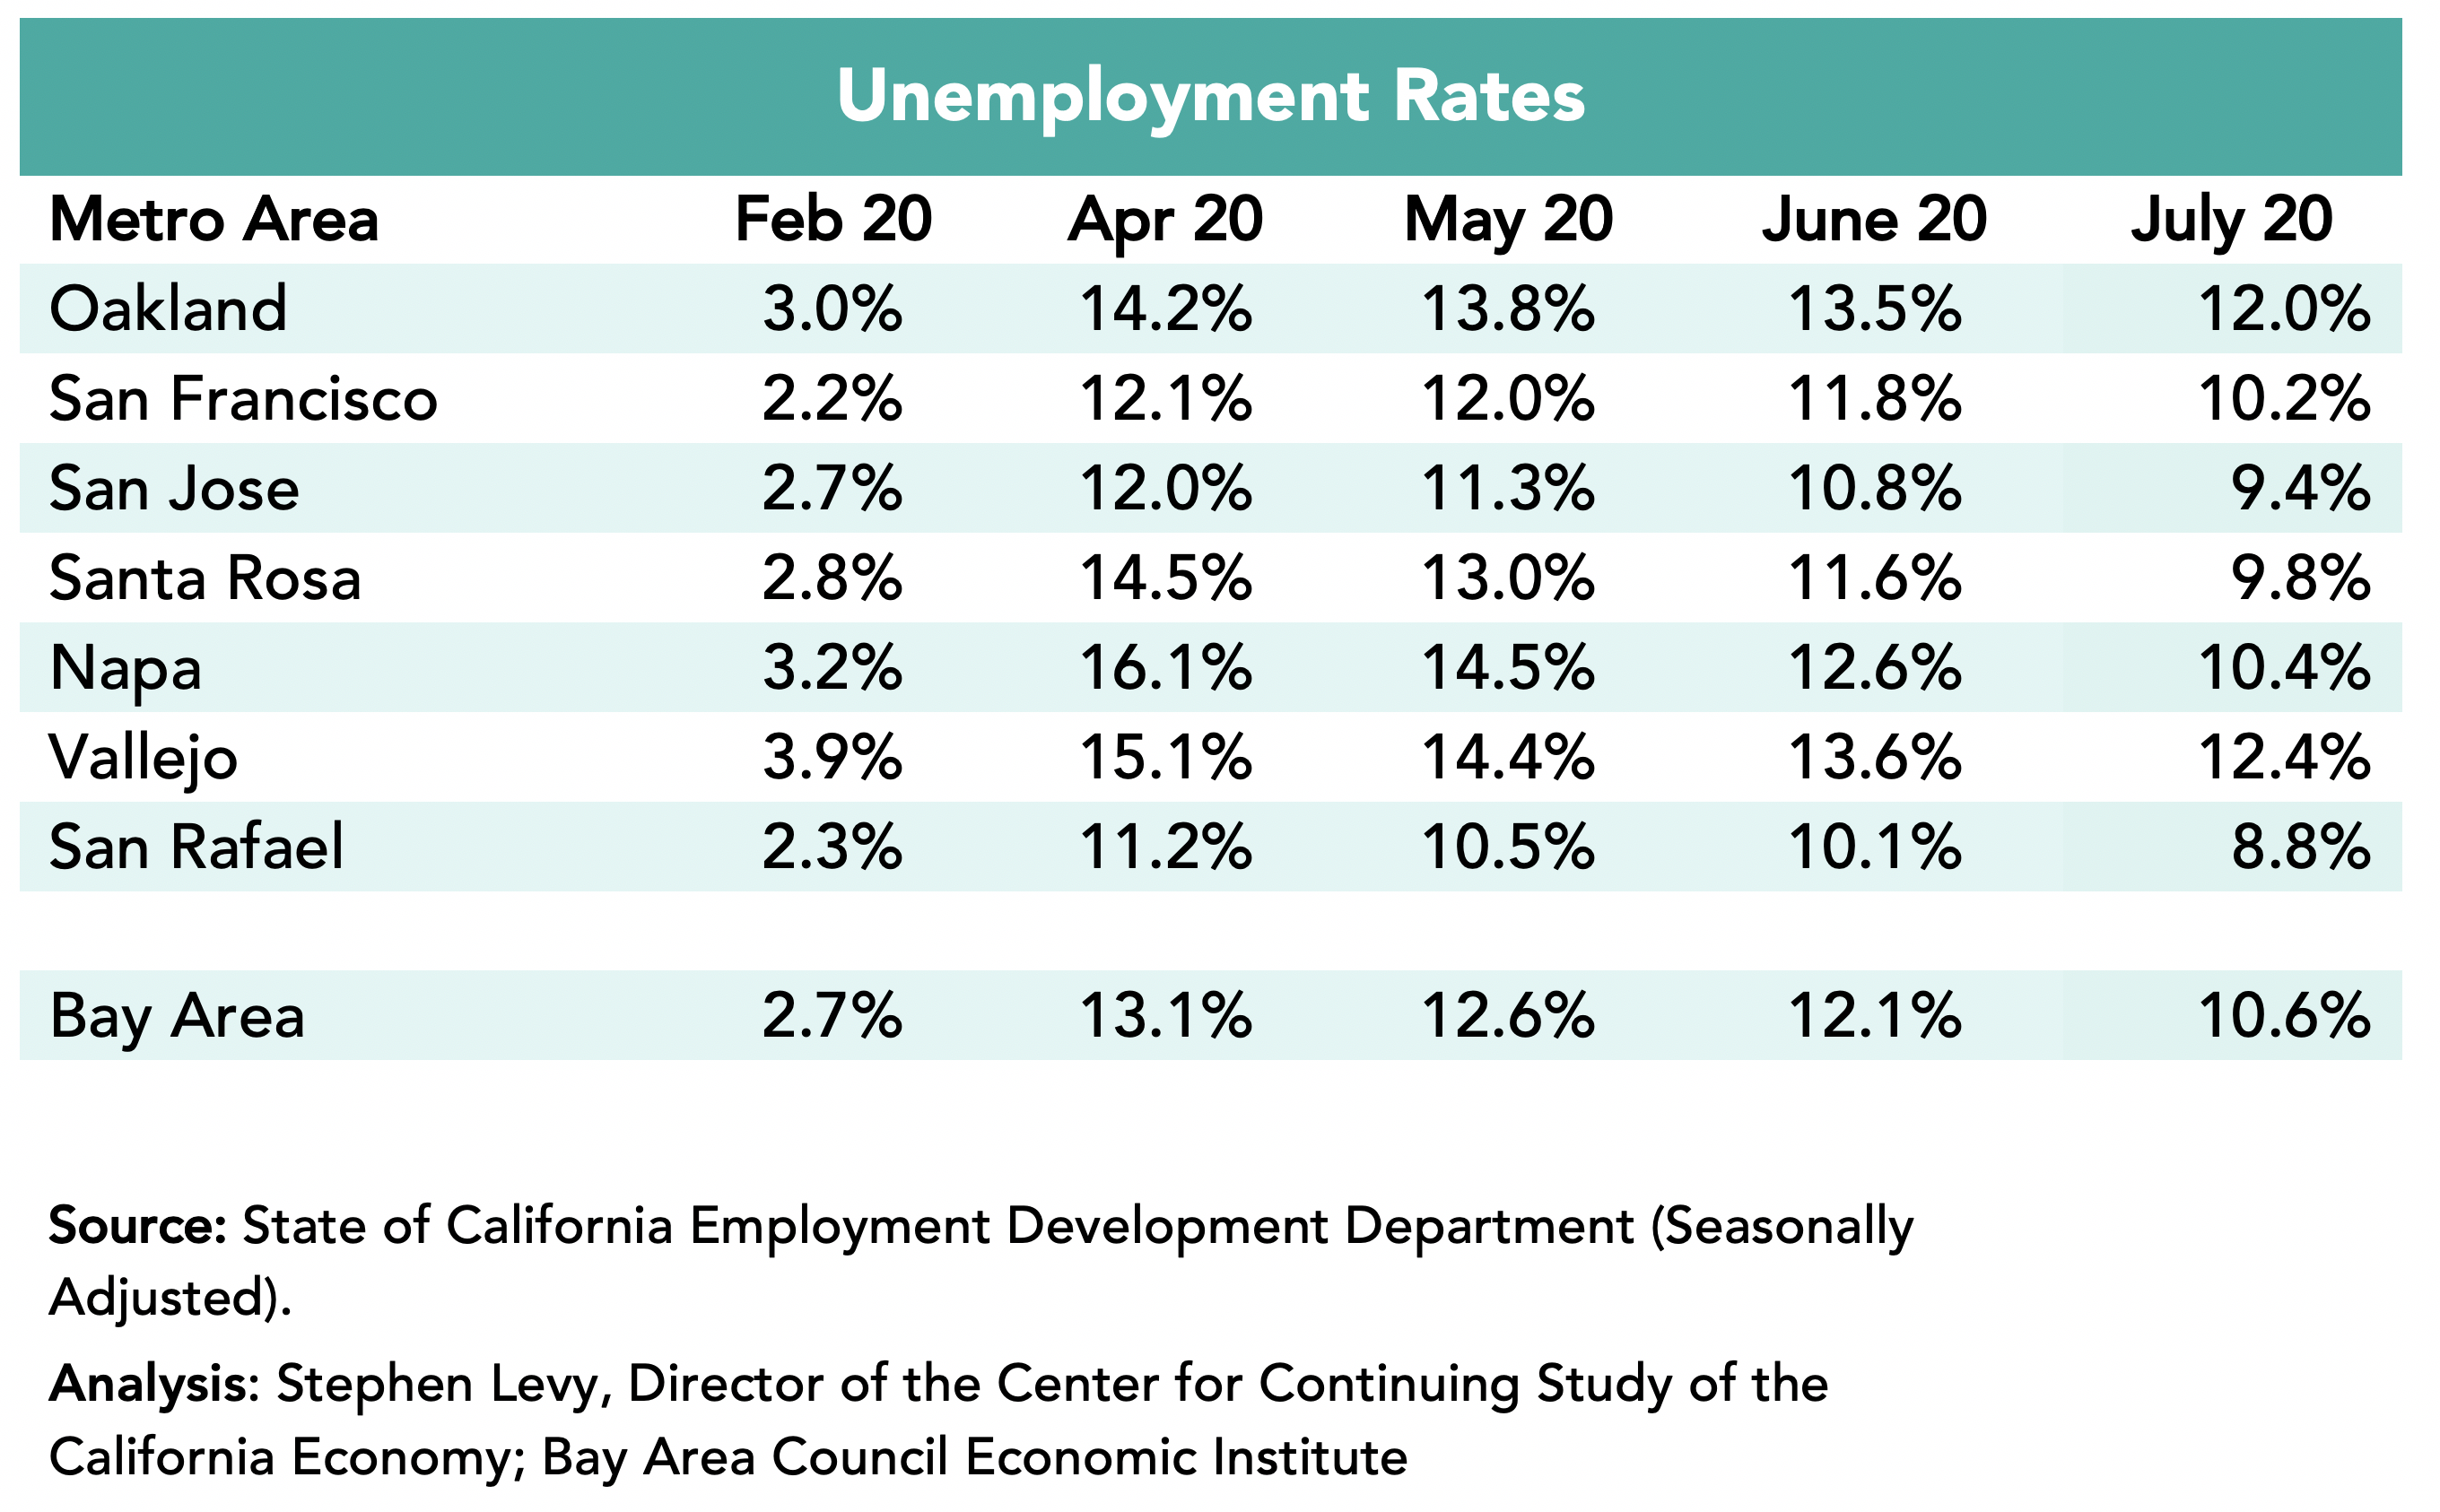
The number of unemployed residents fell very slightly as some people reentered the workforce in the past two months. The largest decline was in the San Jose metro area but that was only a decline of 10,100. 436,700 residents were unemployed in July up from 116,000 in February.
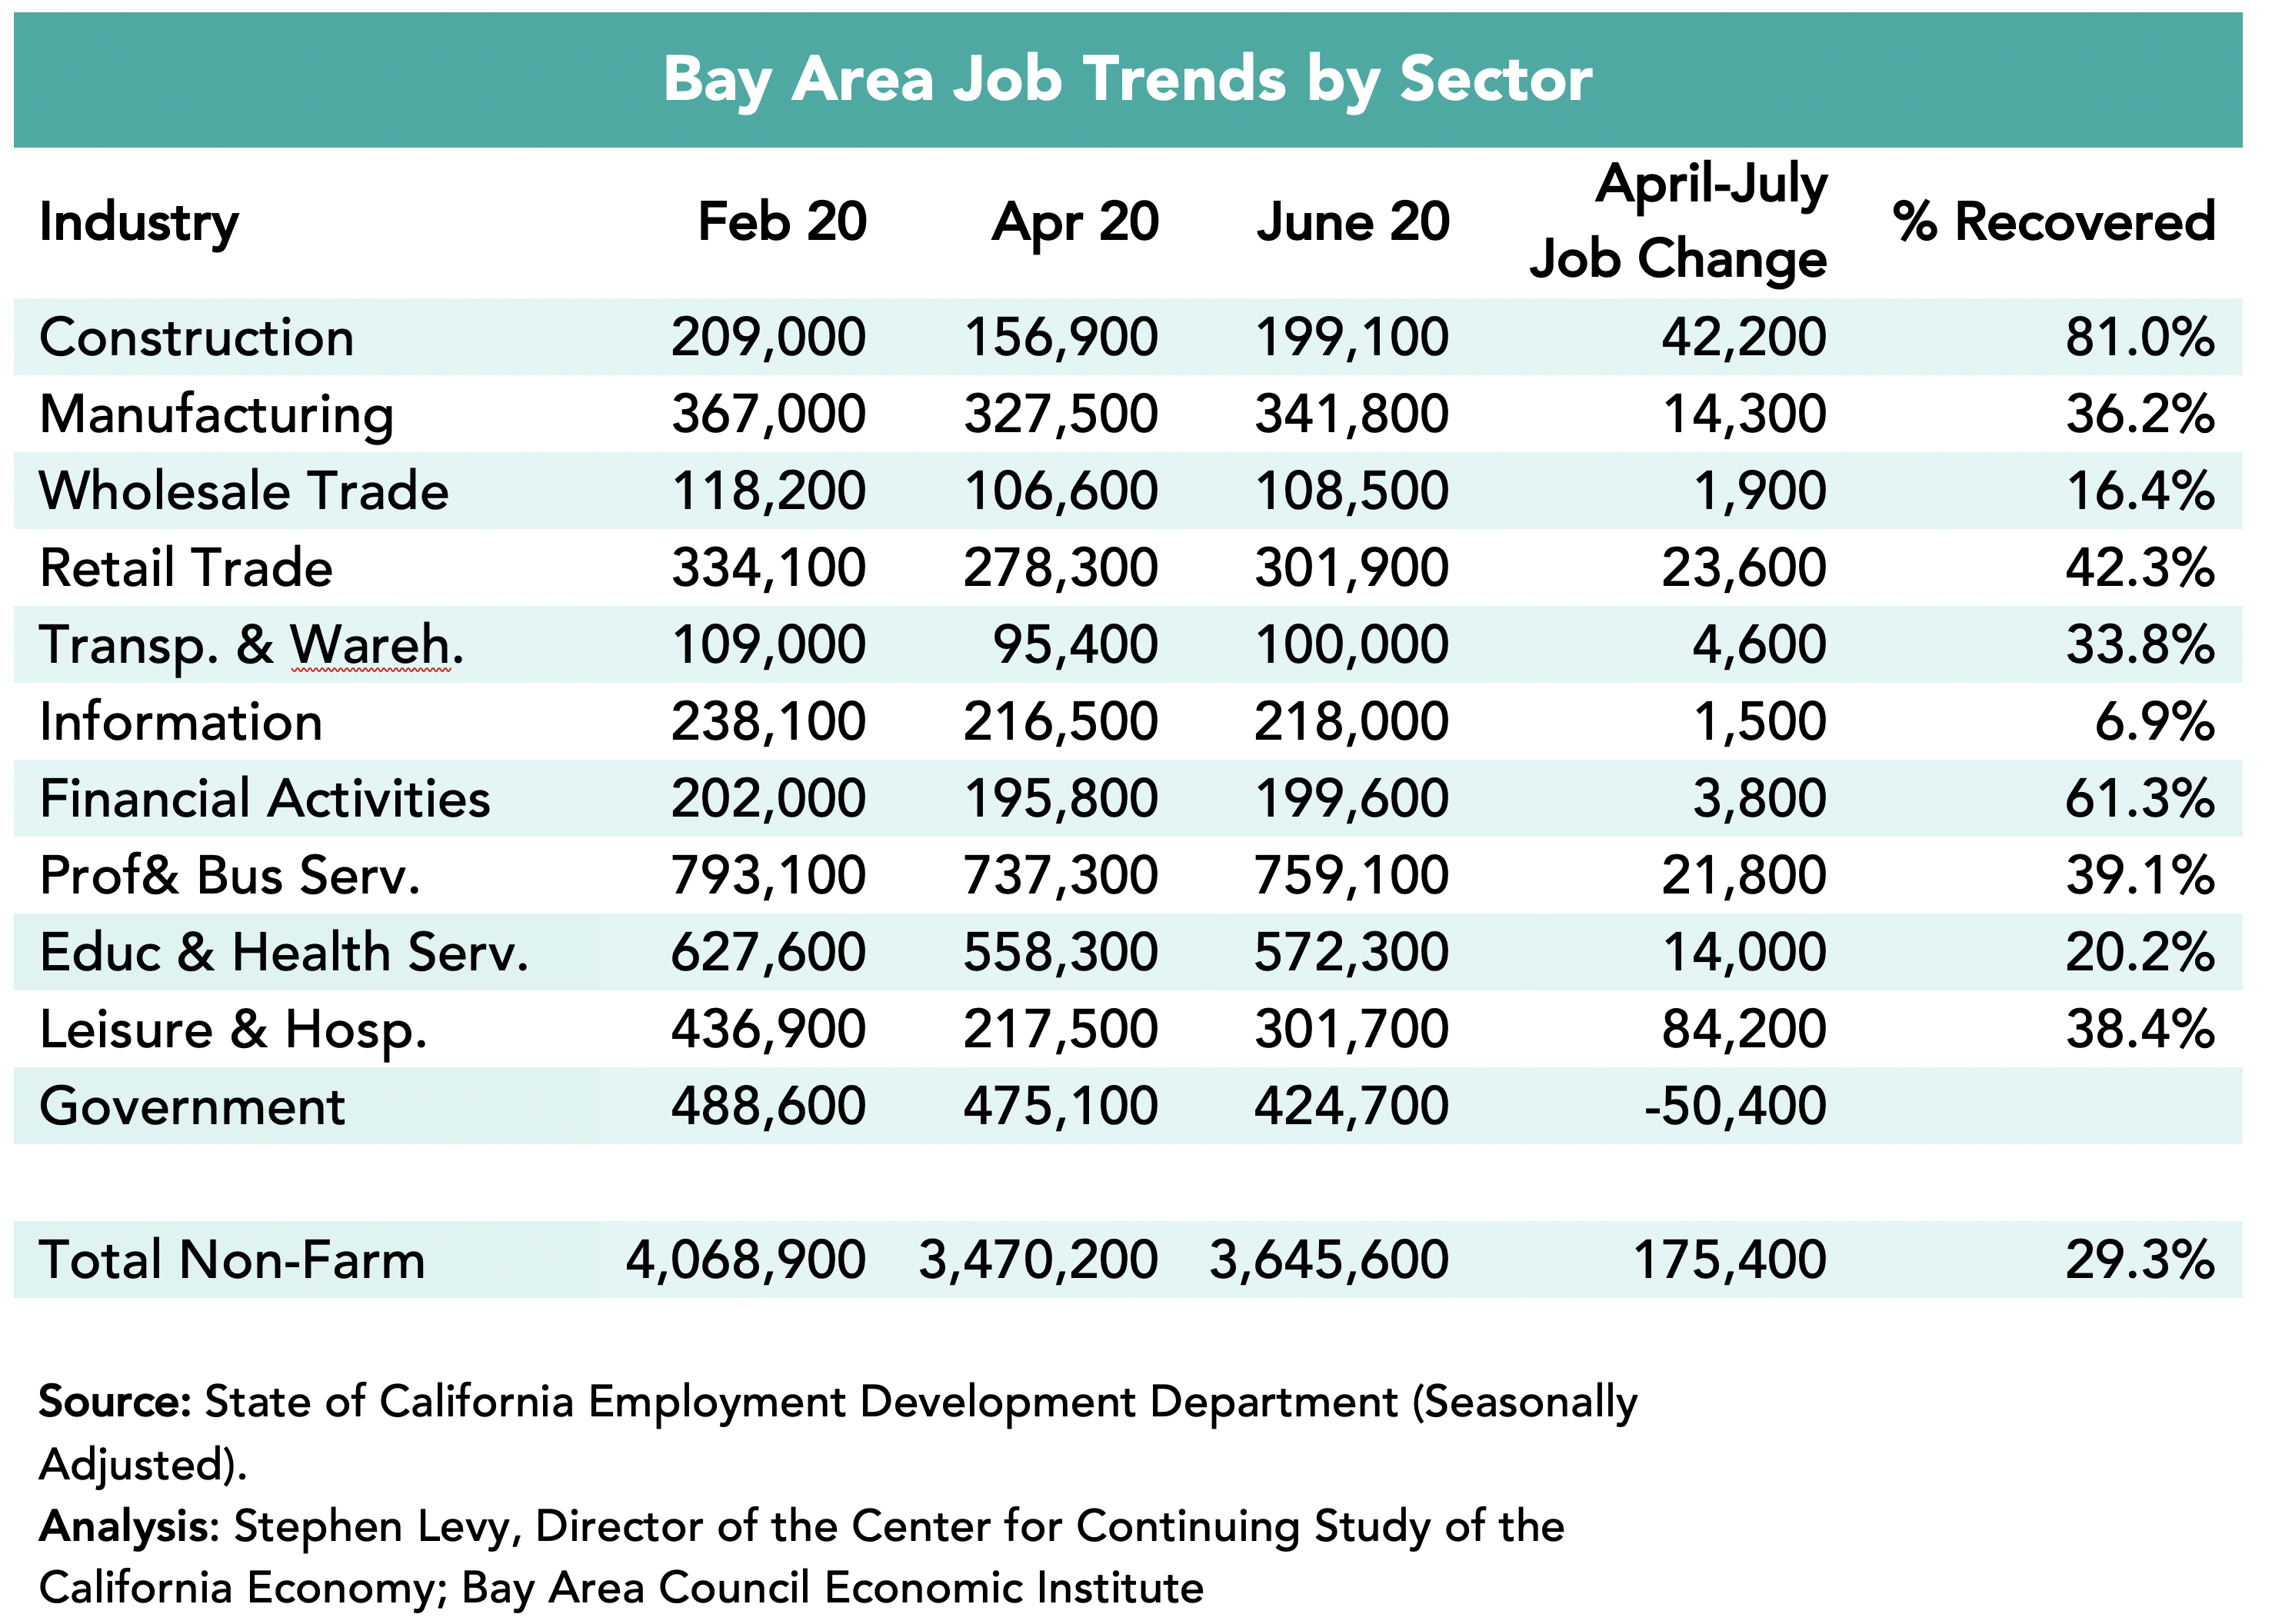
The largest job losses were in Leisure and Hospitality where half the jobs went away between February and April. Construction showed the biggest recovery by July (81.0%) while the Information and Wholesale Trade sectors had relatively small recovery rates so far. Government is the only sector to lose jobs after April. The overall job losses and recovery are affected by the continuing decline in government jobs. Most of the improvement in July was a rebound in Retail and Hospitality and growth in Professional Services.
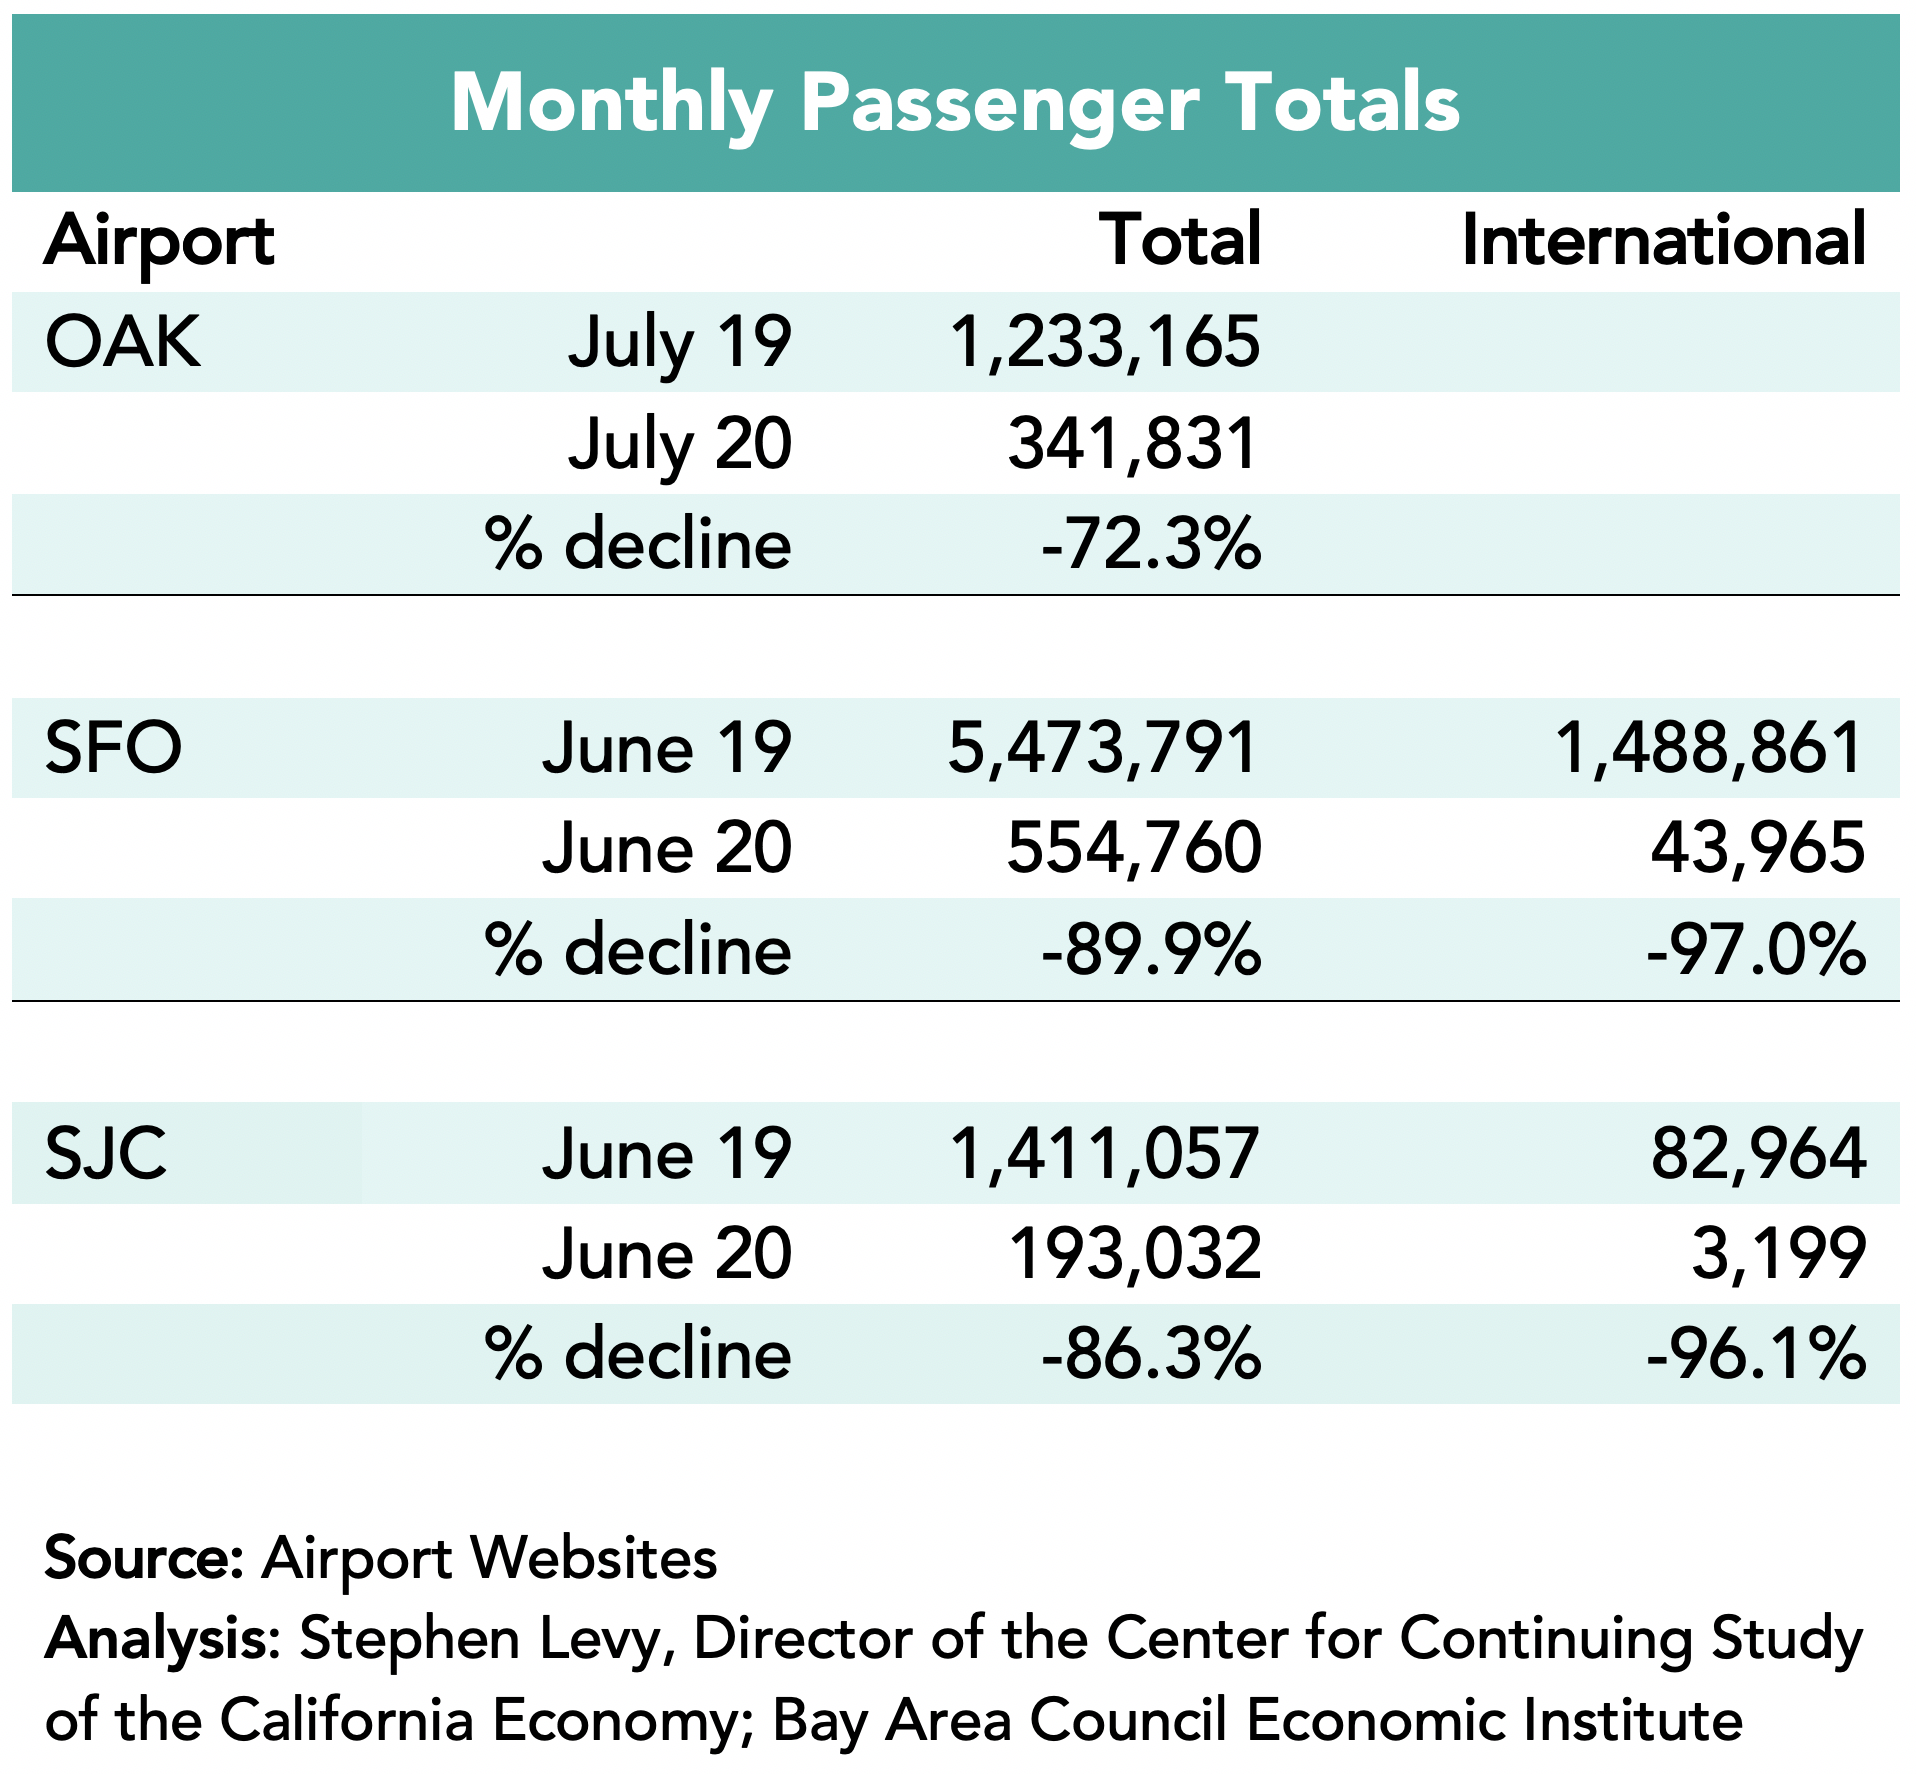
Air travel plummeted after February with losses of 90% or more. SFO has reported June data and there was a small recovery in June. Sill, SFO had a decline of 89.9% in June only slightly better than the 94.3% loss in May. International travel fell even more. San Jose airport did slightly better in June with an 86.3% decline. There was a pickup in July. So far only Oakland airport has reported and travel rebound so the July loss was just 72.3%, still very large.
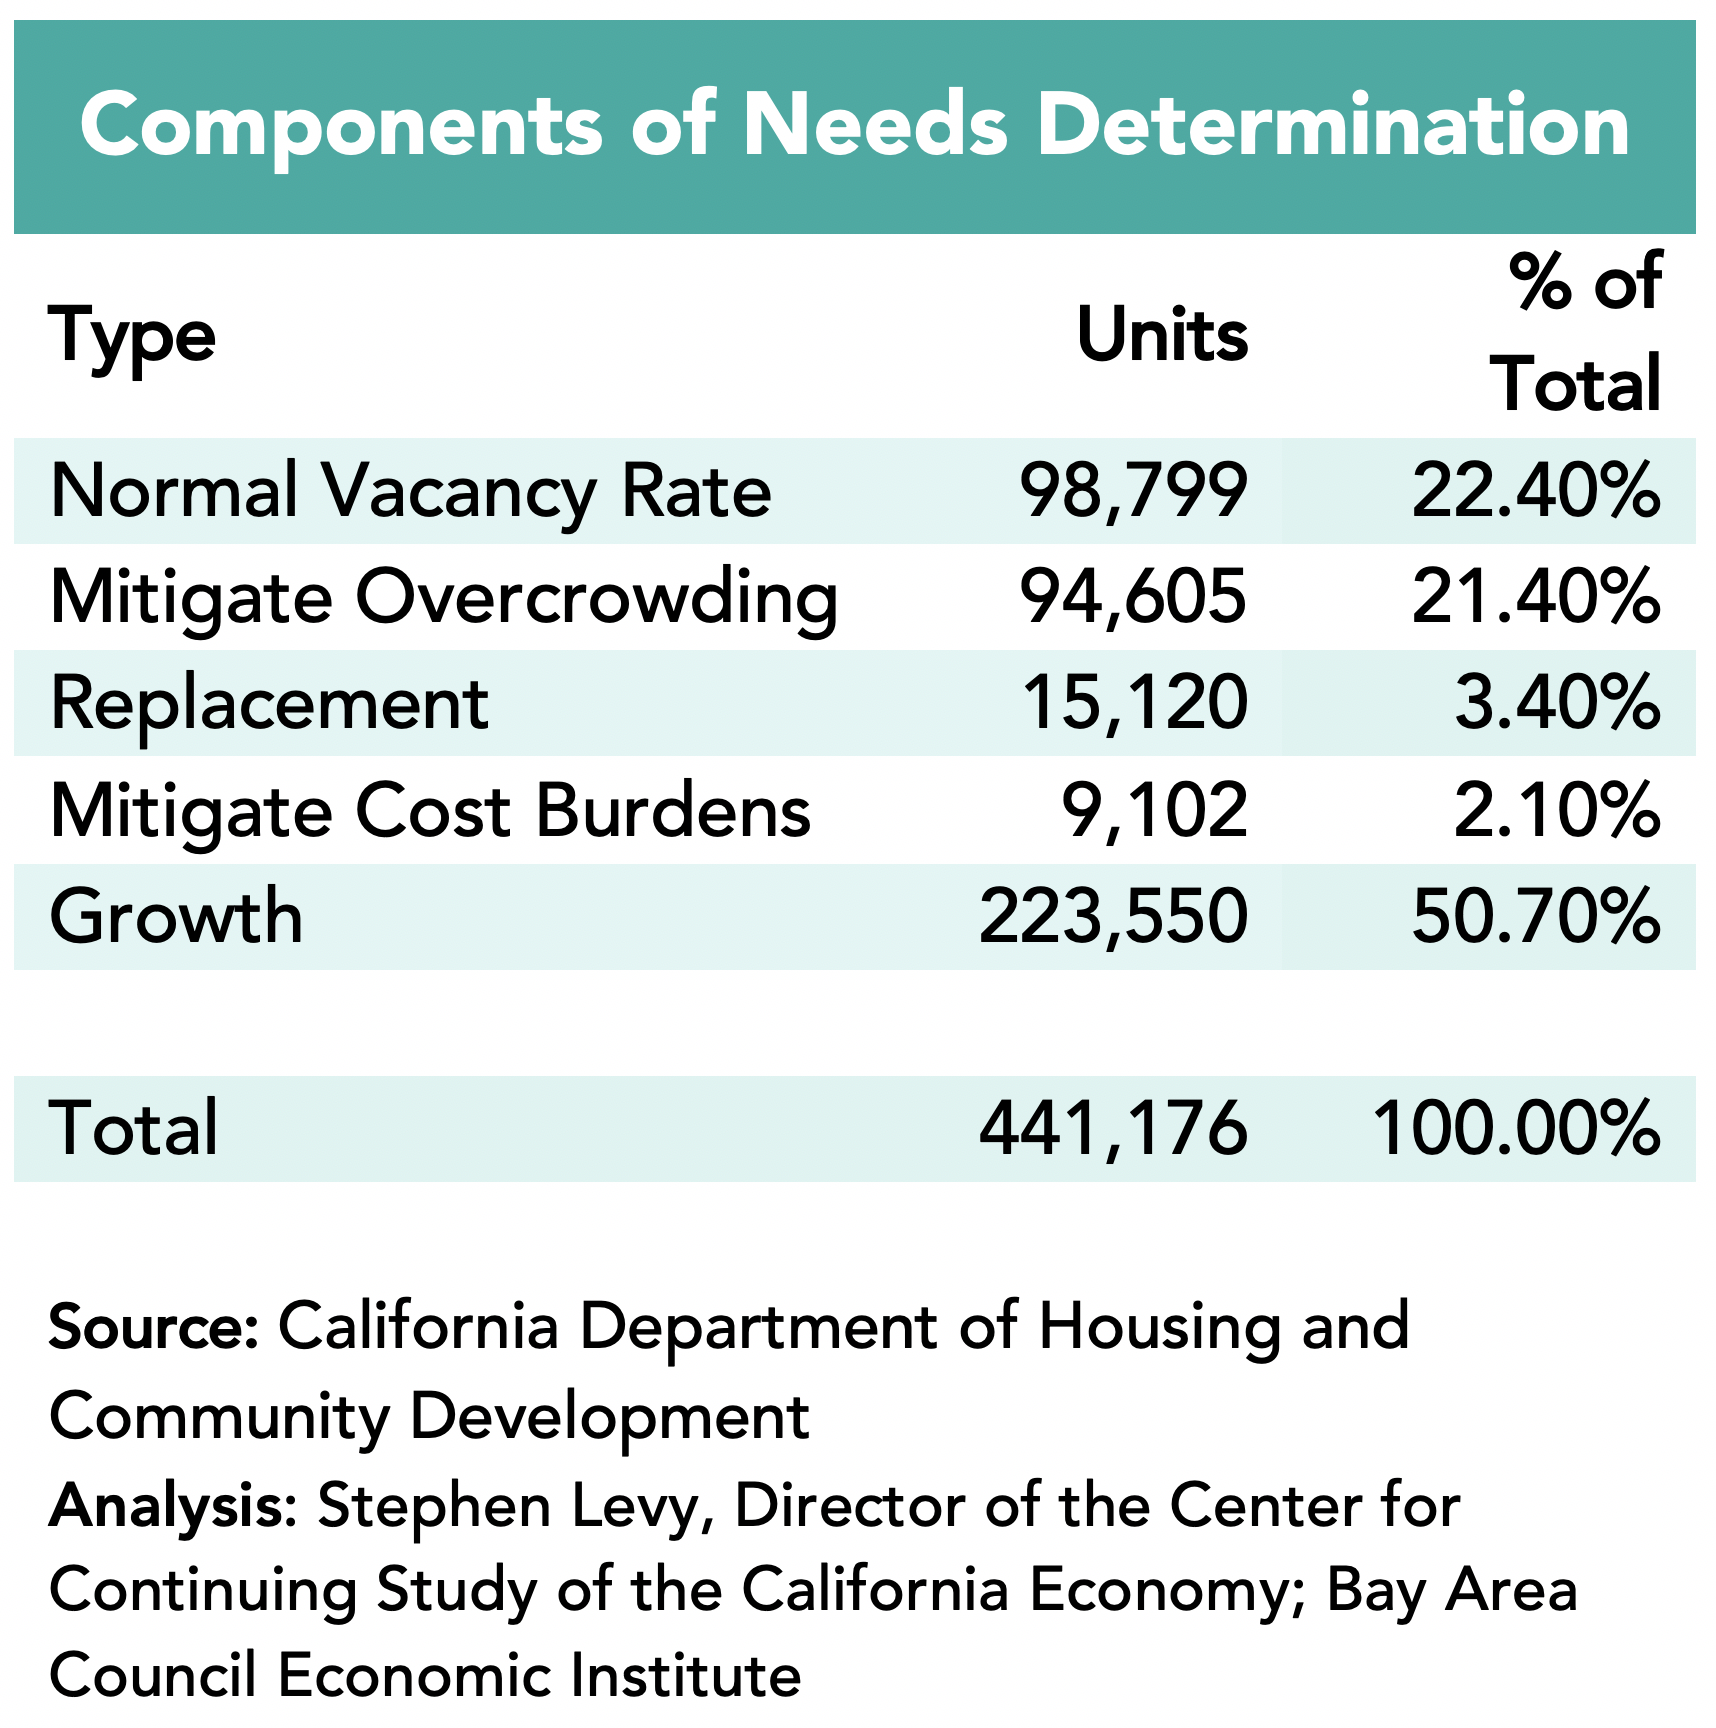
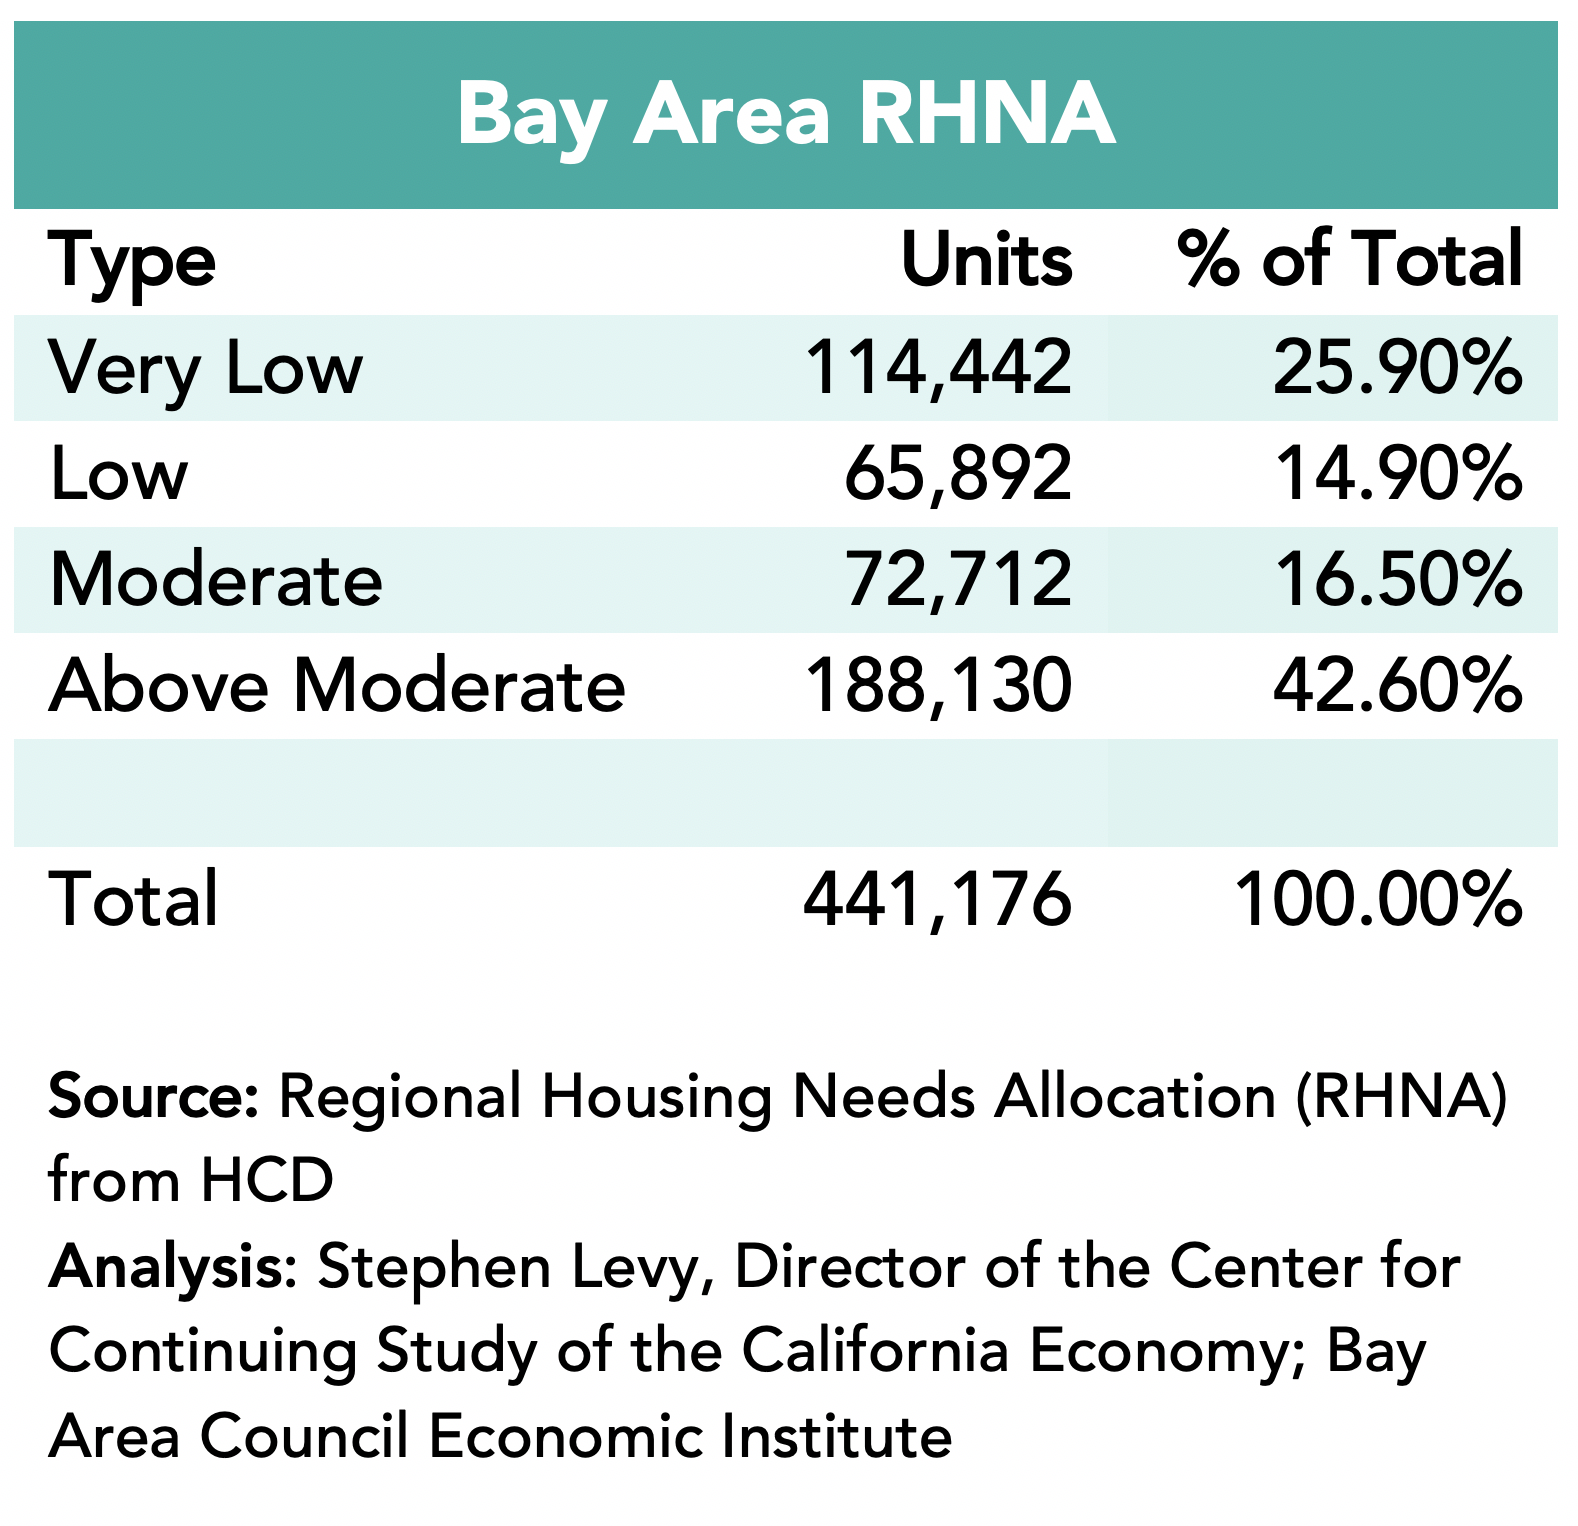
The California Department of Housing and Community Development (HCD) just released the Regional Housing Needs Determination (RHNA) for the Bay Area for the period from June 2022 through December 2030. The HCD letter can be seen at https://hcd.ca.gov/community-development/housing-element/docs/ABAGRHNA-Final060920(r).pdf. The Bay Area target is 135% higher than the current target and includes 441,176 units distributed among four income groups – very low (for residents up to 50% of area median income (AMI), low (50% to 80% of AMI, moderate (80% to 120% of AMI and above moderate. A majority of the units needed are in the very low to moderate income groups.
HCD used a new methodology to develop the needs assessment. Recent state legislation required HCD to include housing units to reduce the number of households that are overcrowded and cost-burdened. HCD compared the Bay Area to shares in comparable regions. HCD has always included units to return the region to a normal vacancy rate and to replace demolished housing.
The final determinant is allowance for units to accommodate the region’s expected growth. HCD used new population projections from the state Department of Finance (DOF) instead of the regional growth forecast developed by ABAG that projected 400,000 more residents than DOF in 2030.
Only half of the Bay Area housing needs according to this analysis come from growth. The rest come as a result of correcting existing shortages.
The next step is for ABAG to allocate the units to local areas, which will take place over the coming months. Current emphasis is on allocating units more to areas that have high amenities and to areas that have substantially more jobs than housing.