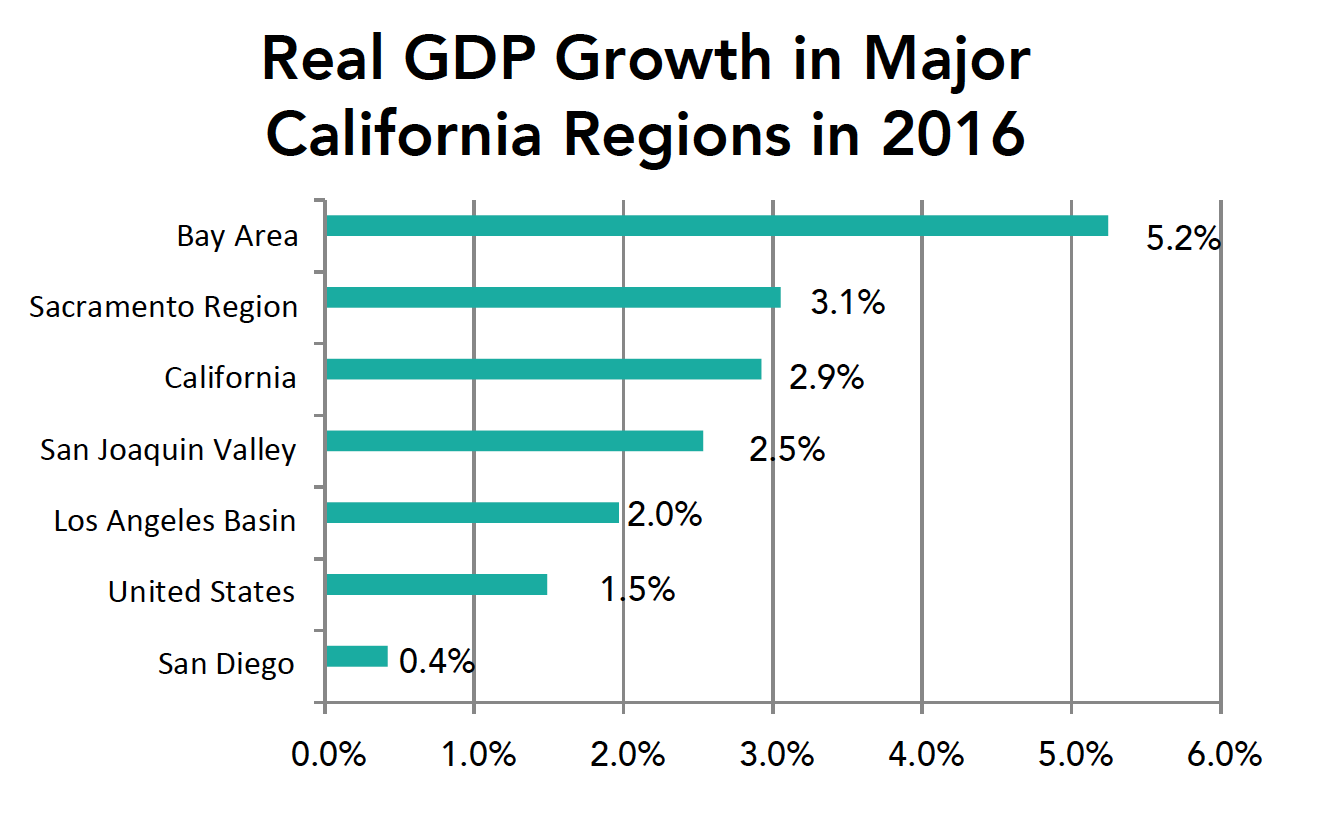
The Bay Area led California and the nation with a real (inflation-adjusted) GDP gain of 5.2% in 2016, more than 3 times faster than the national growth rate. The Sacramento region rebounded from years of slower growth to post a 3.1% real (beyond inflation) growth rate.
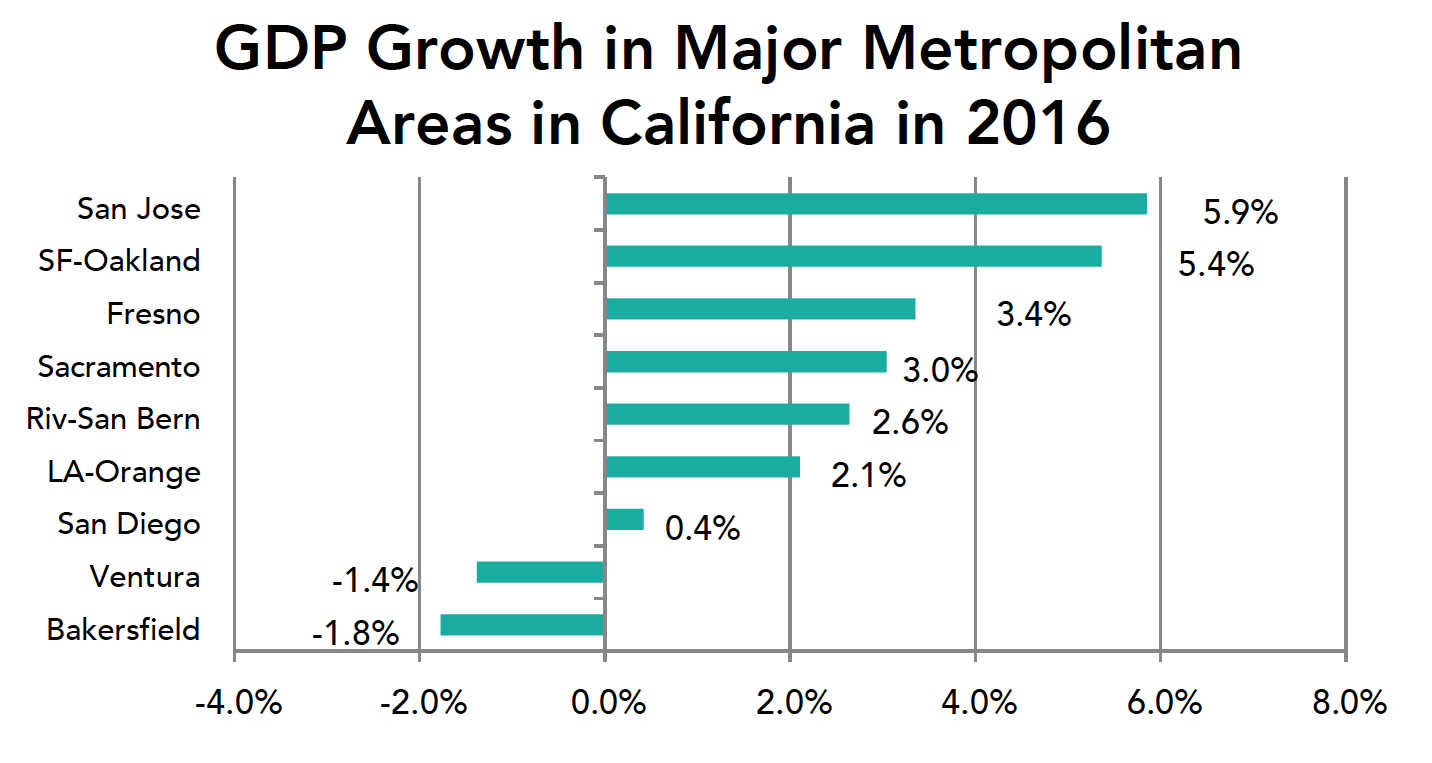
San Jose led all metro areas in California with a real GDP increase of 5.9% in 2016 led by gains in tech related sectors. The San Francisco-Oakland metro area was 2nd at 5.4% with gains in tech and finance.
2016 saw areas outside of the Bay Area with strong gains as these areas are now fully participating in the state’s growth. Fresno GDP grew by 3.4% led by gains in agriculture, construction, health care and government. The Bakersfield metro lagged as the oil cutbacks restrained growth.
The Sacramento metro area was led by gains in finance and professional services. The Ventura and San Diego metro areas lagged as a result of major declines in manufacturing GDP.
The Riverside-San Bernardino metro area was led by gains in construction, finance and health care that offset losses in manufacturing. The LA-Orange metro area was led by gains in information, which includes motion pictures and Internet Services.
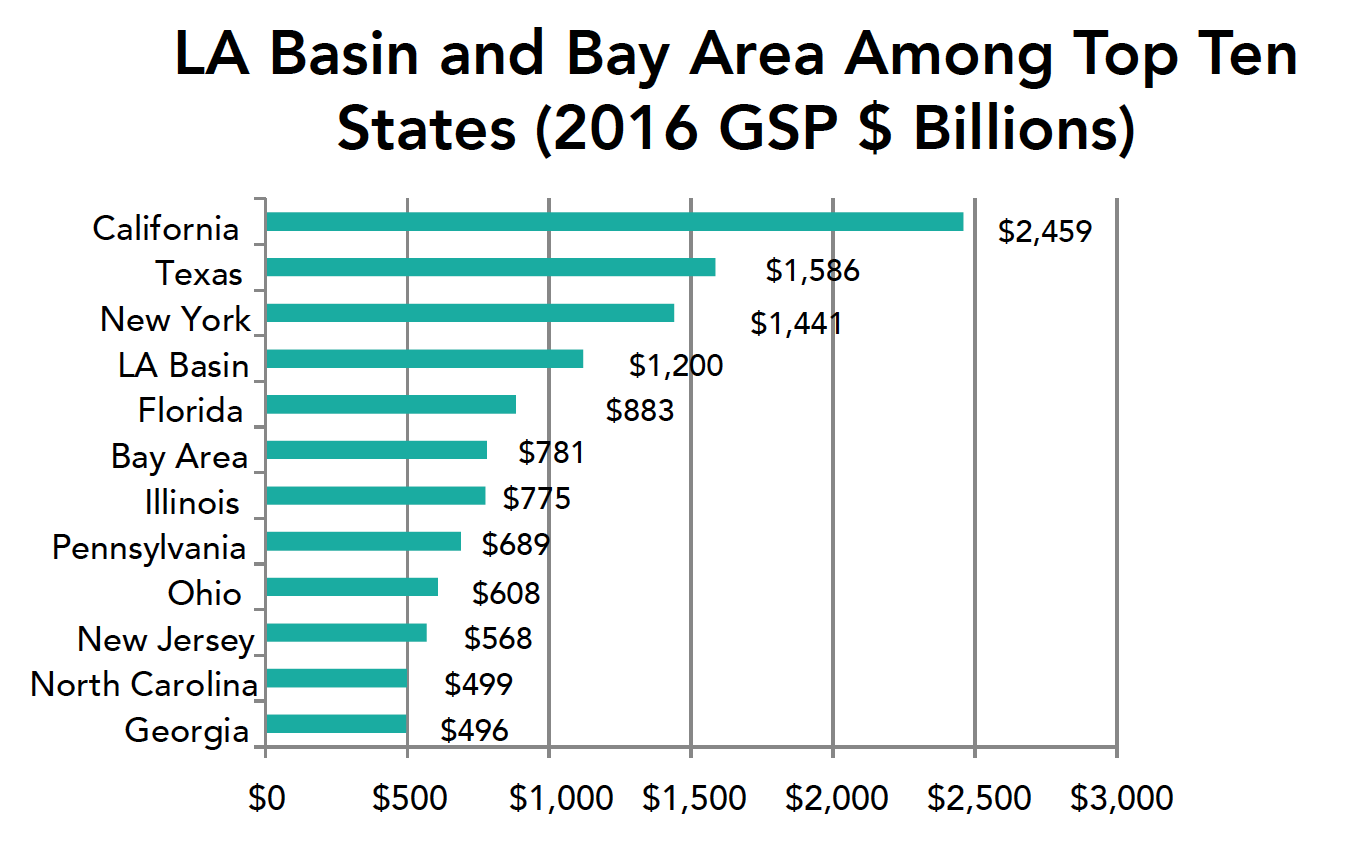
The LA Basin and Bay Area rank high in comparison to most states.
The five county LA Basin economy ranks behind only California, Texas and New York in 2016 with a $1.2 trillion dollar economy. The nine county Bay Area economy would rank 5th among all states (up from 6th last year) with a $781 billion dollar economy measured by the value of goods and services produced in each area.
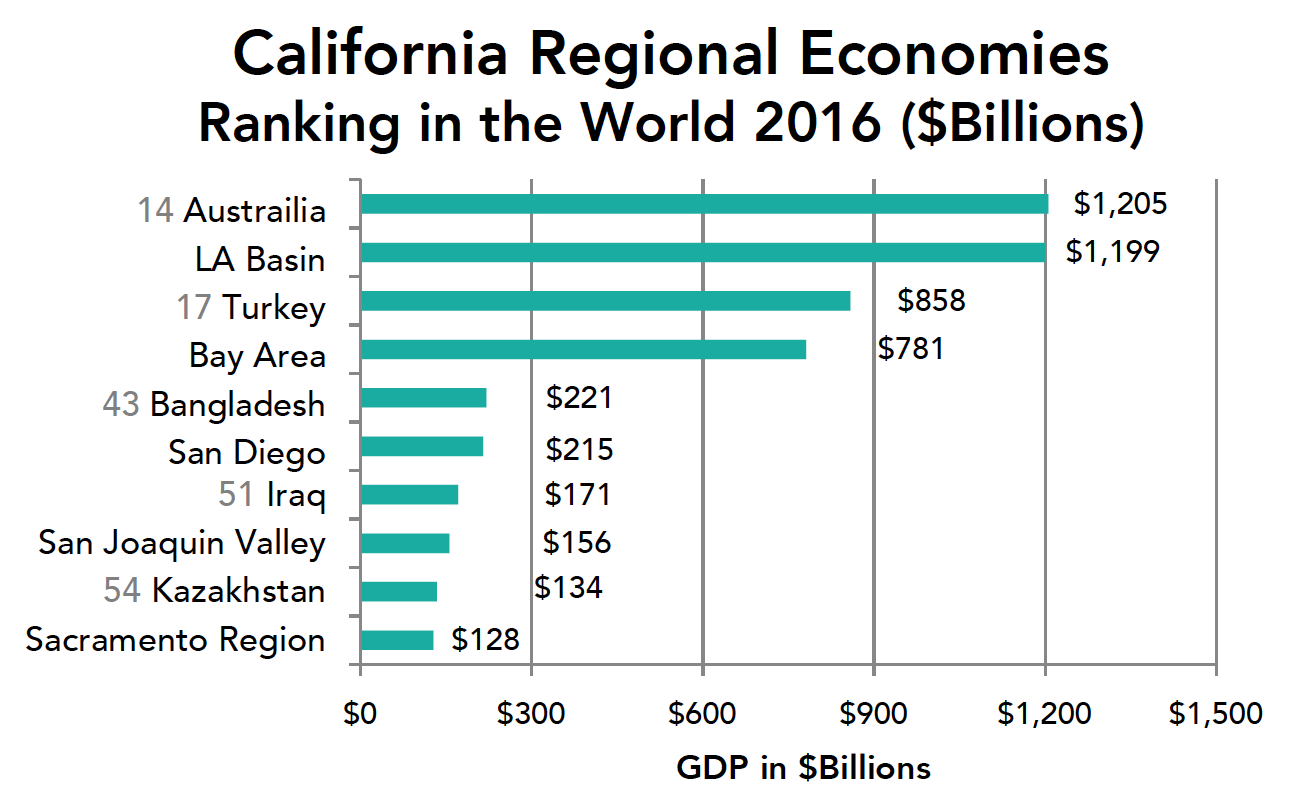
Where do California Regions Rank Worldwide?
The LA Basin economy would rank 15th (up from 16th last year) in terms of the output of goods and services behind Australia and ahead of Mexico. The Bay Area would rank 18th behind Turkey and ahead of the Netherlands. San Diego County would rank 44th behind Bangladesh and ahead of Portugal. The eight county San Joaquin Valley would rank 52nd behind Iraq and ahead of Algeria. And the six county Sacramento region would rank 55th behind Kazakhstan and ahead of Hungary. California and the regions were not counted as countries in these rankings. See the below on page 4.
2017 Update and Commentary
Job growth has slowed in the Bay Area and statewide so far in 2017. But job growth continues to spread to areas previously left behind including the Inland Empire, Butte, and many San Joaquin Valley counties.
So it is very likely that GDP growth in the state and many regions in 2017 will be below the 2015 and 2106 levels.
The recently released ACS data remind us of two important points: 1) that though poverty is falling, it remains far above the levels we hope for and 2) that in most areas of the state it is high housing costs that push a large number of residents below the poverty level and that housing remains both an economic, equity and environmental challenge that we need to meet.
Methodology
The estimates presented above are based on 2016 advance metropolitan area estimates published by BEA in September 2017.
GDP is referred to as output or the output of goods and services in the text. GDP is used instead of GSP (gross state product) although the meanings are similar).
The LA Basin includes Los Angeles, Orange, Riverside, San Bernardino and Ventura counties. The Bay Area includes Alameda, Contra Costa, Marin, Napa, San Francisco, San Mateo, Solano and Sonoma counties. The San Diego region includes San Diego County. The San Joaquin Valley region includes Fresno, Kern, Kings, Madera, Merced, San Joaquin, Stanislaus and Tulare counties, The Sacramento region includes El Dorado, Placer, Sacramento, Sutter, Yolo and Yuba counties.