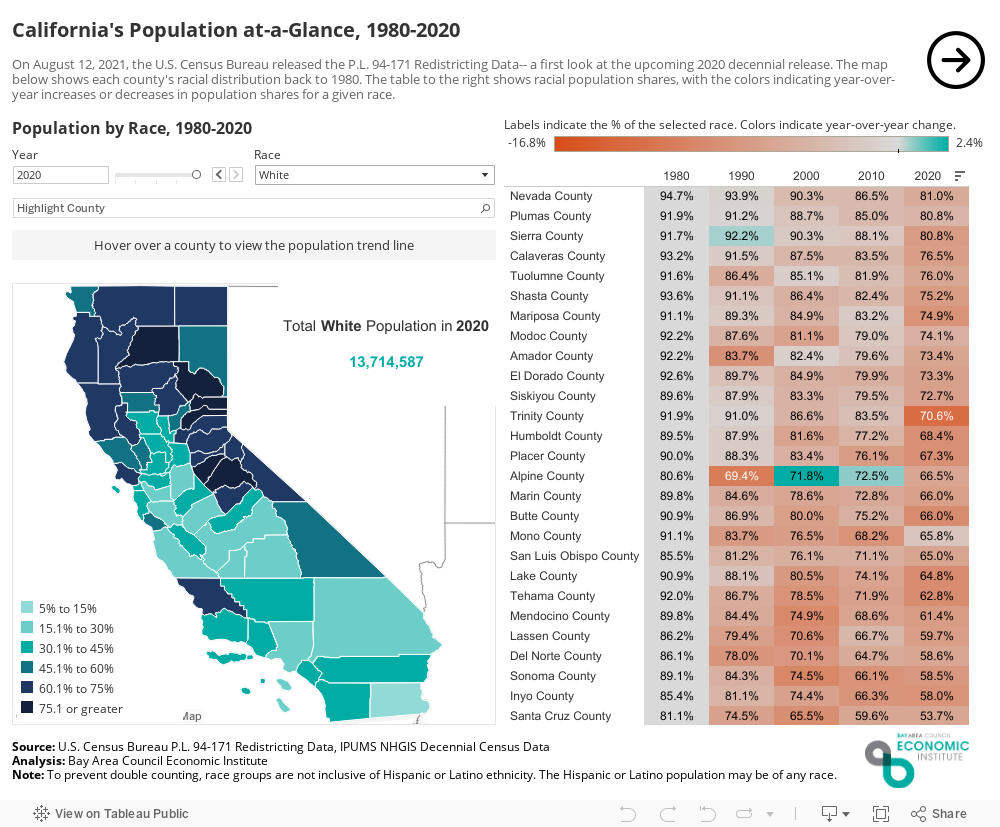
California’s population growth has been slowing, most recently leading to the loss of a congressional seat for the first time in the state’s history. This shift is nothing new, but rather part of a decades-long trend in decreasing birth rates, increasing death rates, and domestic out-migration. The state’s white population, which shrank by 8 percent from 2010 to 2020, lost 1 million people every decade since 1990. The Black population also declined slightly, largely due to decreases within the top six counties in terms of their Black population share.
Still, the state overall added 2.3 million people since 2010, mainly driven by an increase in the Hispanic or Latino population, which accounted for 69% of the state’s total population growth. In the Bay Area, only Solano and Contra Costa counties grew at a faster rate than the state (using 1980 as a baseline), due to a rise in both their Hispanic or Latino and Asian populations, and only a modest decrease in their white populations.
The visualization below illustrates demographic shifts in California from 1980 through the most recent 2020 Census. Explore by toggling buttons by race and year to reveal trends for individual counties, the Bay Area, or the state overall.